Click the blue “Most Programmer” to follow me!
Add a “star“, every day at 18:03 to learn technology together
The commands include: 1. The free command, which displays the system memory status, including physical memory, swap memory, shared memory, and system cache usage; 2. The cat /proc/meminfo command, which reads the contents of the /proc/meminfo file to show memory usage; 3. The vmstat command, which can be used to monitor CPU usage, process status, and other information; 4. The top command; 5. The htop command; 6. The sar command; 7. The smem command; 8. The glances command; 9. The ps_mem command.

This tutorial operates in: Linux 7.9 system, Dell G3 computer.
We often need to check the memory usage of servers and the memory occupied by each process to avoid resource shortages that could affect user experience.
For websites and web services, sufficient memory is essential to handle client requests. If memory is insufficient, it can become slow, congested, or even crash during peak requests. The same principle applies to desktop systems.
Memory management and optimization are crucial components of Linux system performance optimization. In other words, whether memory resources are sufficient directly affects the performance of application systems (including operating systems and applications).
Below are several system commands that allow you to quickly view memory usage in the Linux system.
1. Using the <span>free</span> command
<span>free</span> command is the simplest and most commonly used memory viewing command in Linux systems.
The free command displays the system memory status, including physical memory, virtual memory (swap partition), shared memory, and system cache usage.
Example:
|
|

|
|

Here, the -m option displays memory usage information in MB; the -h option displays it in human-readable units.
In the example above, the line Mem: shows:
-
<span>total</span>indicates a total of<span>7822MB</span>of physical memory (RAM), which is<span>7.6G</span>. -
<span>used</span>indicates the amount of physical memory used, approximately<span>322M</span>. -
<span>free</span>indicates free memory; -
<span>shared</span>indicates shared memory; -
<span>buff/cache</span>indicates the amount of cache and buffer memory; the Linux system caches many things to improve performance, and this memory can be released for other programs when necessary. -
<span>available</span>indicates available memory;
The output is easy to understand. The Swap line indicates swap memory, and from the numbers in the example, it can be seen that swap memory is hardly used.
2. Viewing <span><span>/proc/meminfo</span></span>
Another method is to read the <span>/proc/meminfo</span> file. We know that the <span>/proc</span> directory contains virtual files that include dynamic information related to the kernel and operating system.
|
|
Key data to focus on:
-
<span>MemTotal</span>, total memory -
<span>MemFree</span>, free memory -
<span>MemAvailable</span>, available memory -
<span>Buffers</span>, buffers -
<span>Cached</span>, cache -
<span>SwapTotal</span>, swap memory -
<span>SwapFree</span>, free swap memory
The information provided is similar to what is seen with the free command.
3. Using the <span><span>vmstat</span></span> command
The vmstat command, short for Virtual Memory Statistics, can be used to monitor CPU usage, process status, memory usage, virtual memory usage, disk input/output status, and more.
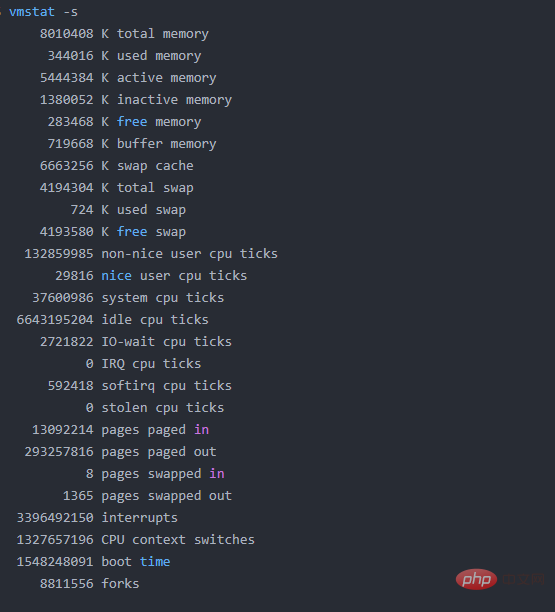
Using the <span>vmstat -s</span> command and option can provide statistics on memory usage, similar to <span>/proc/meminfo</span>.
Example:
|
|

The first few lines display total memory, used memory, and free memory information.
4. Using the <span><span>top</span></span> command
<span>top</span> command is generally used to view the CPU and memory usage of processes; it also reports total memory and memory usage, so it can be used to monitor physical memory usage. Summary information is displayed at the top of the output.
Example output:
|
|
Various parameters provided by different operating systems may vary slightly, but generally, they can be sorted by CPU and memory.
For example:
|
|
If you encounter any confusion, please use <span>top -h</span> to view help information.
Focus on the top lines of <span>KiB Mem</span> and <span>KiB Swap</span>, which indicate total memory, used memory, and available memory. The buffer and cache sections are similar to what is displayed by the <span>free</span> command.
5. Using the <span><span>htop</span></span> command
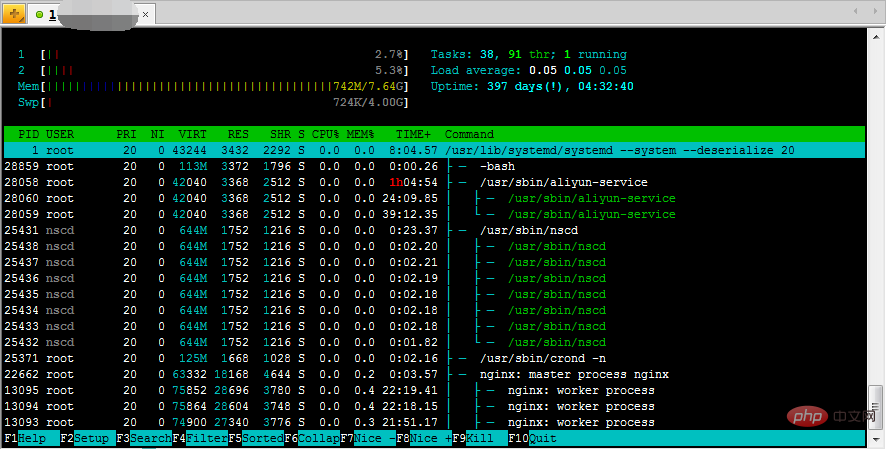
The htop command is an interactive process viewer for Linux/Unix systems. It is a text-mode application that requires the ncurses library, developed by Hisham. It is designed as an alternative to the top command. Similar to the top command, it allows you to scroll vertically and horizontally to view all processes running on the system. htop features visual colors, which are very helpful when tracking system performance. You can freely perform any process-related tasks, such as terminating and renicing processes, without entering their PID.
Similar to the <span>top</span> command, but <span>htop</span> also displays various additional information and supports color display.
|
|

The top message displays CPU usage, as well as RAM and swap memory usage.
If not installed, you can use a similar command:
|
|
6. Using the <span>sar</span> command
The sar command can also be used to monitor Linux memory usage. By using the sar -r combination, you can view the usage rates of system memory and swap space.
The
sarcommand is powerful and is one of the important tools for analyzing system performance. It can comprehensively obtain performance data for the system’s CPU, run queue, disk read/write (I/O), partitions (swap space), memory, CPU interrupts, and network.
Below is the output of the sar -r command:
|
|

In this output, the meanings of various parameters are as follows:
-
<span>kbmemfree</span>: indicates the size of free physical memory; -
<span>kbmemeused</span>: indicates the size of used physical memory; -
<span>%memused</span>: indicates the percentage of used memory relative to total memory; -
<span>kbbuffers</span>: indicates the size of physical memory used by buffers; -
<span>kbcached</span>: indicates the size of physical memory used by cache; -
<span>kbcommit</span>and<span>%commit</span>: indicate the size and percentage of memory used by applications in the current system;
Compared to the free command, the output information of the sar command is more user-friendly, providing not only memory usage but also the percentage of memory used and average statistics. For example, just through the %commit item, one can determine that the current system has sufficient memory resources.
7. Using the <span>smem</span> command
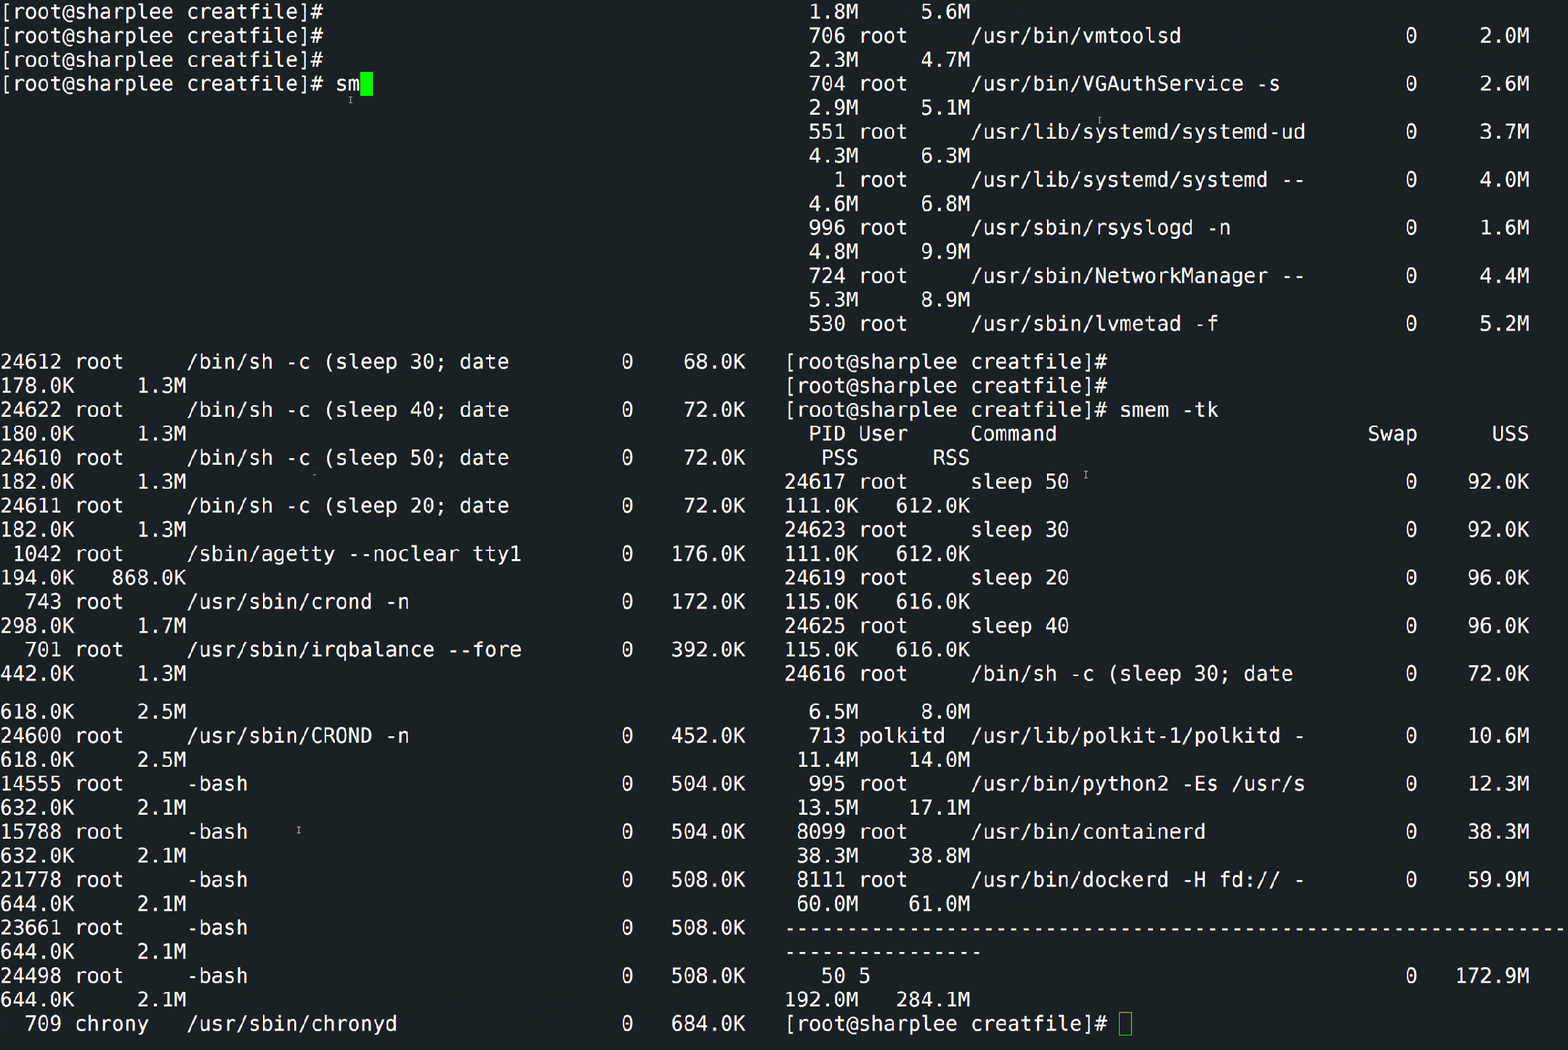
The smem tool provides a detailed report on memory usage in Linux systems. Unlike existing tools, smem can report Proportional Set Size (PSS), Unique Set Size (USS), and Resident Set Size (RSS). Proportional Set Size (PSS): refers to the amount of memory used by libraries and applications in the virtual memory system. Unique Set Size (USS): refers to the memory that is not shared, reported as USS (Unique Set Size). Resident Set Size (RSS): a standard measure of physical memory usage (usually shared among multiple applications) that greatly overestimates memory usage. Note: If the following command prompts that it is not found, please execute yum install smem to install it.
|
|

8. Using the <span>glances</span> command
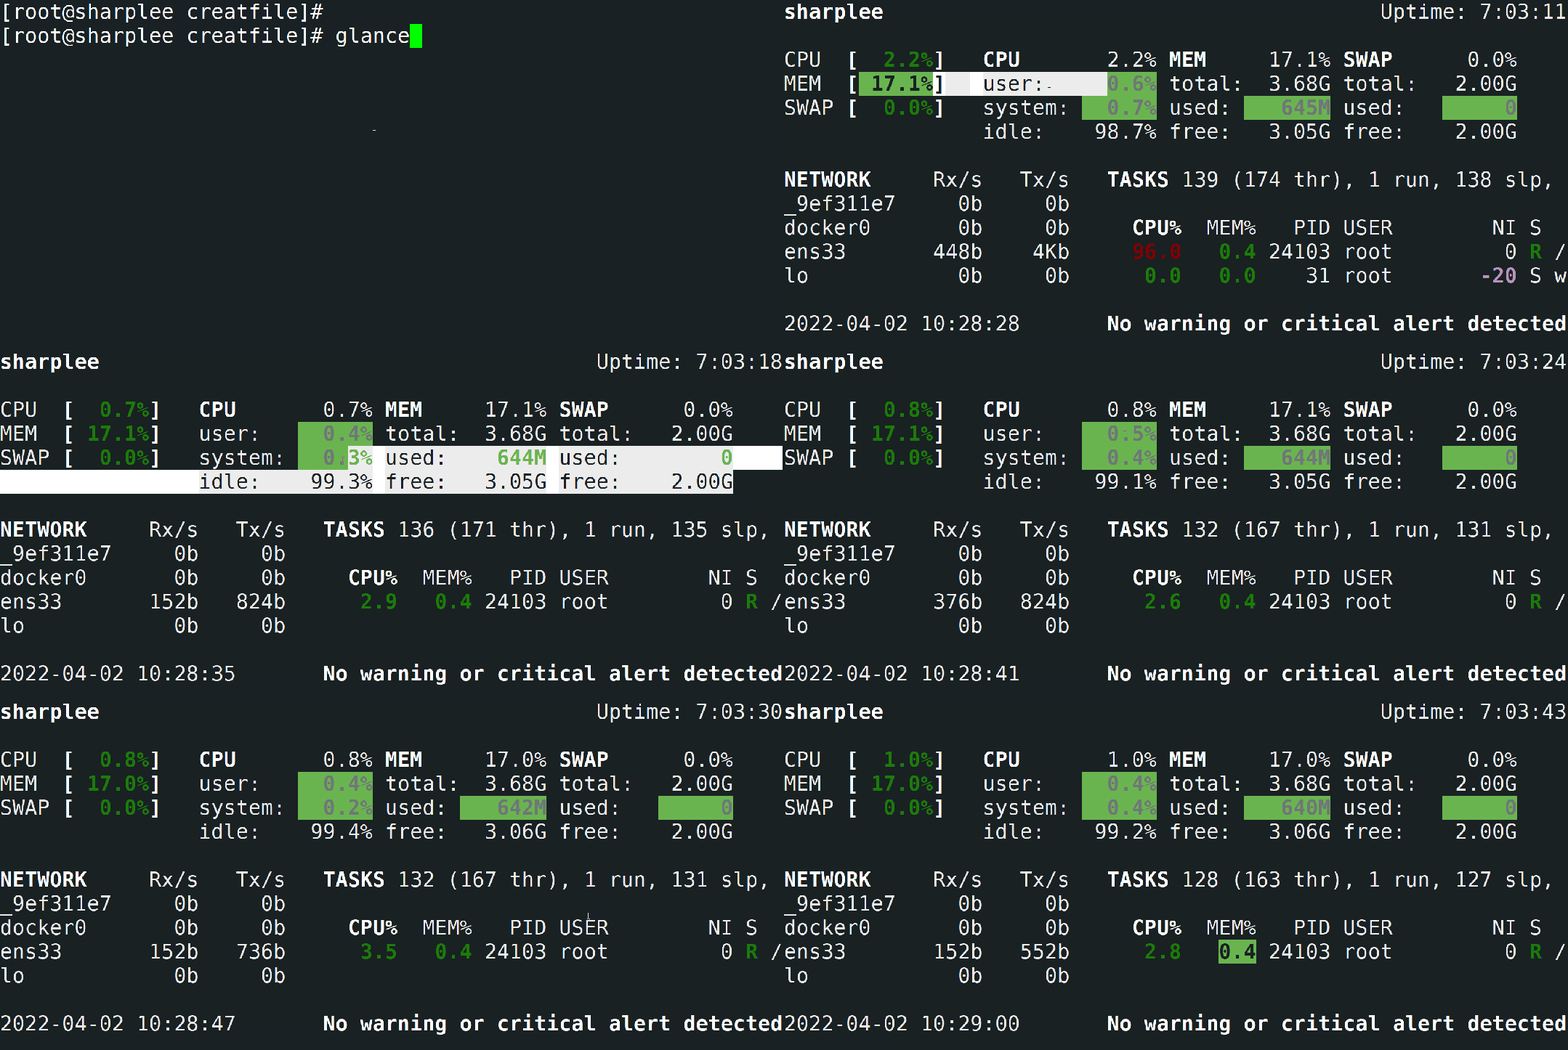
The glances command is a cross-platform system monitoring tool written in Python. It can display all information such as CPU usage, memory usage, running processes, network interfaces, disk I/O, RAID, sensors, filesystem information, Docker, system information, uptime, etc.
|
|


9. Using the <span>ps_mem</span> command
The ps_mem command is a simple Python script that allows you to accurately obtain the core memory usage of programs in Linux. It determines how much RAM each program (rather than each process) uses. It calculates the total memory used by each program as the sum of the dedicated RAM of program processes plus the sum of the shared RAM of program processes. Calculating shared RAM can be problematic, and this tool automatically selects the most accurate method for the running kernel.
|
|

Note: If the following command prompts that it is not found, please execute yum install ps_mem to install it.
Link: https://www.cnblogs.com/tiancai/p/17225905.html