Follow “Java Matters” and select “Star” to receive a free Java book package, whether you are a newcomer or an experienced developer in this new era.Source: Online. When your server’s CPU reaches 100%, how do you troubleshoot the abnormal fault? At the end of this article, a shell script will be shared to help you diagnose CPU 100% issues on Linux systems.Yesterday afternoon, I suddenly received an operations email alert indicating that the CPU utilization of the data platform server had reached 98.94%, and it had been consistently above 70% for some time. It seemed like the hardware resources were reaching a bottleneck and needed expansion. However, upon careful consideration, it became clear that our business system is not a high-concurrency or CPU-intensive application, so this utilization seems exaggerated. The hardware bottleneck should not have been reached so quickly; there must be an issue with the business logic in the code somewhere.
1. Troubleshooting Approach
2.1 Identify High Load Process PID
First, log into the server and use the top command to confirm the server’s specific situation, and then analyze and judge based on the specific situation.

By observing the load average and the load evaluation standard (8 cores), it can be confirmed that the server is experiencing a high load situation;
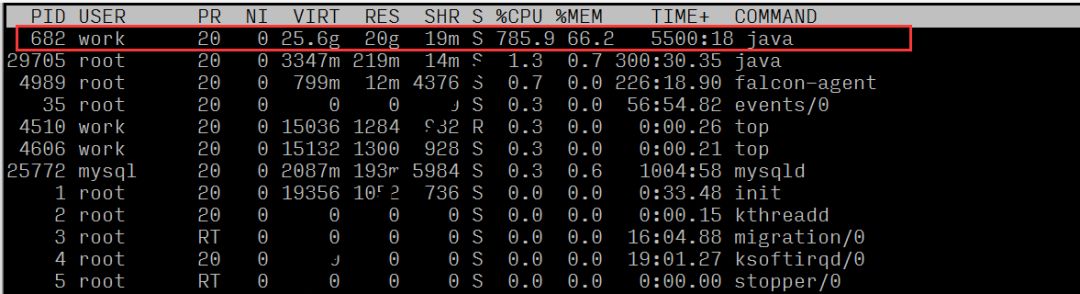
By observing the resource usage of each process, it can be seen that the process with PID 682 has a high CPU usage ratio.
1.2 Identify Specific Abnormal Business Logic
Here, we can use the pwdx command to find the business process path based on the PID, thus identifying the responsible person and project:
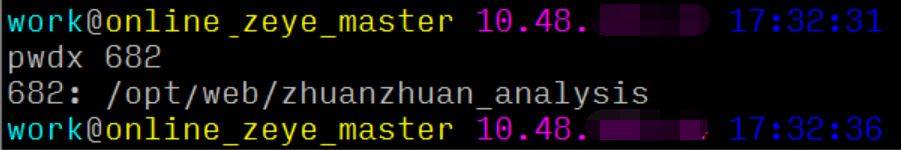
It can be concluded that this process corresponds to the web service of the data platform.
1.3 Identify Abnormal Threads and Specific Code Lines
Traditional solutions generally involve four steps:
1. top ordered by CPU usage:1040 // First, sort by process load to find maxLoad(pid)
2. top -Hp processPID:1073 // Find the relevant load thread PID
3. printf “0x%x ” threadPID: 0x431 // Convert thread PID to hexadecimal for later jstack log lookup
4. jstack processPID | vim +/hexadecimalThreadPID – // For example: jstack 1040|vim +/0x431 –
However, for online issue localization, every second counts, and the above four steps are still too cumbersome and time-consuming. Previously, it was introduced that Taobao’s oldratlee has encapsulated the above process into a tool: show-busy-java-threads.sh, which can conveniently locate such online issues:
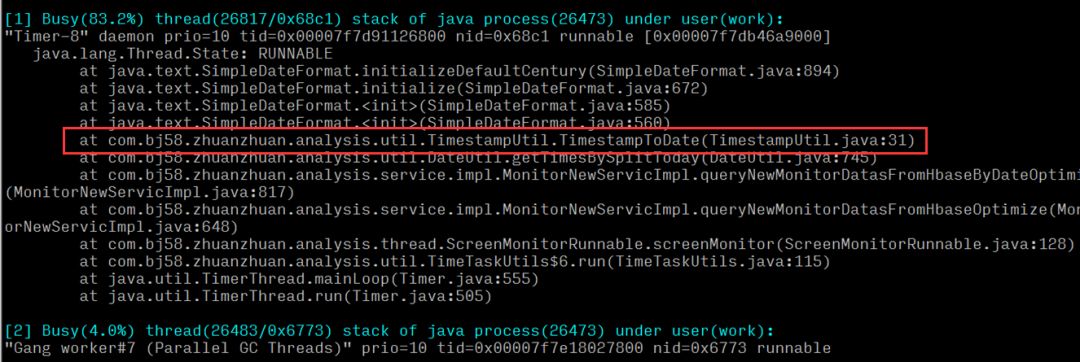
It can be concluded that a time utility method in the system has a high CPU usage ratio. After locating the specific method, check if there are performance issues in the code logic.
※ If the online issue is urgent, you can skip 2.1 and 2.2 and directly execute 2.3. The analysis from multiple angles here is just to present a complete analysis thought process.
2. Root Cause Analysis
After the previous analysis and troubleshooting, the issue was ultimately traced back to a problem with a time utility class, which caused the server load and CPU usage to be excessively high.
-
Abnormal method logic: It converts timestamps into corresponding date and time formats;
-
Upper-level call: It calculates all seconds from midnight to the current time, converts them into the corresponding format, and puts them into a set to return the result;
-
Logical layer: It corresponds to the query logic of the real-time report of the data platform, which will query at fixed time intervals and has multiple (n times) method calls in a single query.
Thus, it can be concluded that if the current time is 10 AM, the number of calculations for a single query would be 10*60*60*n times = 36,000*n times, and as time goes on, the number of calculations per query will increase linearly as it approaches midnight. Due to the large number of query requests from real-time queries, real-time alerts, and other modules, which require multiple calls to this method, it leads to a significant consumption and waste of CPU resources.
3. Solution
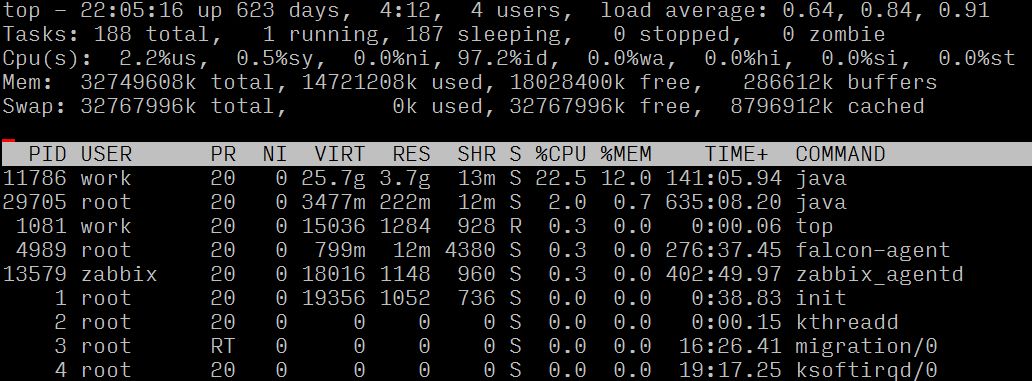
After identifying the problem, the first consideration was to reduce the number of calculations and optimize the abnormal method. After investigation, it was found that in the logical layer, the method’s returned set was not used; instead, only the size of the set was used. After confirming the logic, a new method was implemented to simplify the calculation (current seconds – seconds at midnight) and replace the called method, resolving the excessive calculation issue. After going live, the server load and CPU usage were observed to have decreased by 30 times compared to the abnormal period, returning to normal state, thus resolving the issue.
4. Summary
-
During the coding process, in addition to implementing business logic, attention should also be paid to optimizing code performance. Achieving a business requirement and achieving it more efficiently and elegantly are two entirely different capabilities and realms of an engineer, and the latter is also the core competitiveness of an engineer.
-
After completing the code, conduct more reviews and think about whether it can be implemented in a better way.
-
Do not overlook any small details in online issues! Details are crucial; technical colleagues need to have a curiosity for digging into problems and a spirit of pursuing excellence. Only in this way can they continue to grow and improve.
Attached is the show-busy-java-threads.sh script:
#!/bin/bash

# @Function# Find out the highest cpu consumed threads of java, and print the stack of these threads.## @Usage# $ ./show-busy-java-threads.sh## @author Jerry Leereadonly PROG=`basename $0`readonly -a COMMAND_LINE=("$0""$@")usage() {    cat <<EOFUsage: ${PROG} [OPTION]...Find out the highest cpu consumed threads of java, and print the stack of these threads.Example: ${PROG} -c 10Options:    -p, --pid find out the highest cpu consumed threads from the specifed java process,                    default from all java process.    -c, --count set the thread count to show, default is 5    -h, --help      display this help and exitEOFexit$1}readonly ARGS=`getopt -n "$PROG" -a -o c:p:h -l count:,pid:,help -- "$@"`[ $? -ne 0 ] && usage 1evalset -- "${ARGS}"whiletrue; docase"$1"in    -c|--count)        count="$2"shift 2        ;;    -p|--pid)        pid="$2"shift 2        ;;    -h|--help)        usage        ;;    --)shiftbreak        ;;esacdonecount=${count:-5}redEcho() {    [ -c /dev/stdout ] && {# if stdout is console, turn on color output.echo -ne "\033[1;31m"echo -n "$@"echo -e "\033[0m"    } || echo"$@"}yellowEcho() {    [ -c /dev/stdout ] && {# if stdout is console, turn on color output.echo -ne "\033[1;33m"echo -n "$@"echo -e "\033[0m"    } || echo"$@"}blueEcho() {    [ -c /dev/stdout ] && {# if stdout is console, turn on color output.echo -ne "\033[1;36m"echo -n "$@"echo -e "\033[0m"    } || echo"$@"}# Check the existence of jstack command!if ! which jstack > /dev/null; then    [ -z "$JAVA_HOME" ] && {        redEcho "Error: jstack not found on PATH!"exit 1    }    ! [ -f "$JAVA_HOME/bin/jstack" ] && {        redEcho "Error: jstack not found on PATH and $JAVA_HOME/bin/jstack file does NOT exists!"exit 1    }    ! [ -x "$JAVA_HOME/bin/jstack" ] && {        redEcho "Error: jstack not found on PATH and $JAVA_HOME/bin/jstack is NOT executalbe!"exit 1    }    export PATH="$JAVA_HOME/bin:$PATH"fireadonly uuid=`date +%s`_${RANDOM}_$$cleanupWhenExit() {    rm /tmp/${uuid}_* > /dev/null}trap"cleanupWhenExit" EXITprintStackOfThreads() {local linelocal count=1while IFS=" "read -a line ; dolocal pid=${line[0]}local threadId=${line[1]}local threadId0x="0x`printf %x ${threadId}`"local user=${line[2]}local pcpu=${line[4]}local jstackFile=/tmp/${uuid}_${pid}        [ ! -f "${jstackFile}" ] && {            {if [ "${user}" == "${USER}" ]; then                    jstack ${pid} > ${jstackFile}elseif [ $UID == 0 ]; then                        sudo -u ${user} jstack ${pid} > ${jstackFile}else                        redEcho "[$((count++))] Fail to jstack Busy(${pcpu}%) thread(${threadId}/${threadId0x}) stack of java process(${pid}) under user(${user})."                        redEcho "User of java process($user) is not current user($USER), need sudo to run again:"                        yellowEcho " sudo ${COMMAND_LINE[@]}"echocontinuefifi            } || {                redEcho "[$((count++))] Fail to jstack Busy(${pcpu}%) thread(${threadId}/${threadId0x}) stack of java process(${pid}) under user(${user})."echo                rm ${jstackFile}continue            }        }        blueEcho "[$((count++))] Busy(${pcpu}%) thread(${threadId}/${threadId0x}) stack of java process(${pid}) under user(${user}):"        sed "/nid=${threadId0x} /,/^$/p" -n ${jstackFile}done}ps -Leo pid,lwp,user,comm,pcpu --no-headers | {    [ -z "${pid}" ] &&    awk '$4=="java"{print $0}' ||    awk -v "pid=${pid}"'$1==pid,$4=="java"{print $0}'} | sort -k5 -r -n | head --lines "${count}" | printStackOfThrea
– END –