↓Recommended Follow↓
Network Models:
Common models include the OSI network model, TCP/IP network model, and the five-layer protocol network model:
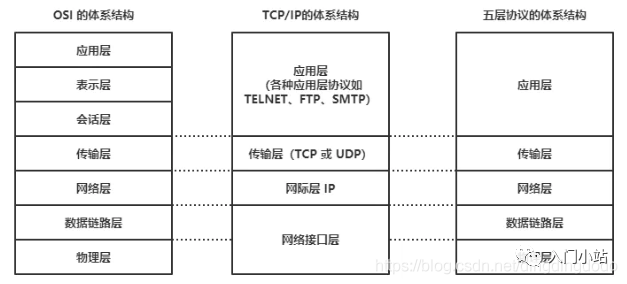
The OSI seven-layer network model splits the application layer of the traditional five-layer TCP model into the application layer, presentation layer, and session layer.
-
Application Layer: Responsible for providing a unified interface for applications. -
Presentation Layer: Responsible for converting data into a format compatible with the receiving system. -
Session Layer: Responsible for maintaining communication connections between computers, i.e., establishing, maintaining, and terminating communication between two nodes in the network. -
Transport Layer: Responsible for adding transport headers to data, forming packets. -
Network Layer: Responsible for routing and forwarding data. -
Data Link Layer: Responsible for MAC addressing, error detection, and correction. -
Physical Layer: Responsible for transmitting data frames over the physical network.
The TCP/IP network model used in Linux is a four-layer network model:
-
Application Layer, responsible for providing a set of applications to users, such as HTTP, FTP, DNS, etc. -
Transport Layer, responsible for end-to-end communication, such as TCP, UDP, etc. -
Network Layer, responsible for encapsulating, addressing, and routing network packets, such as IP, ICMP, etc. -
Network Interface Layer, responsible for transmitting network packets over the physical network, such as MAC addressing, error detection, and transmitting network frames via network cards.
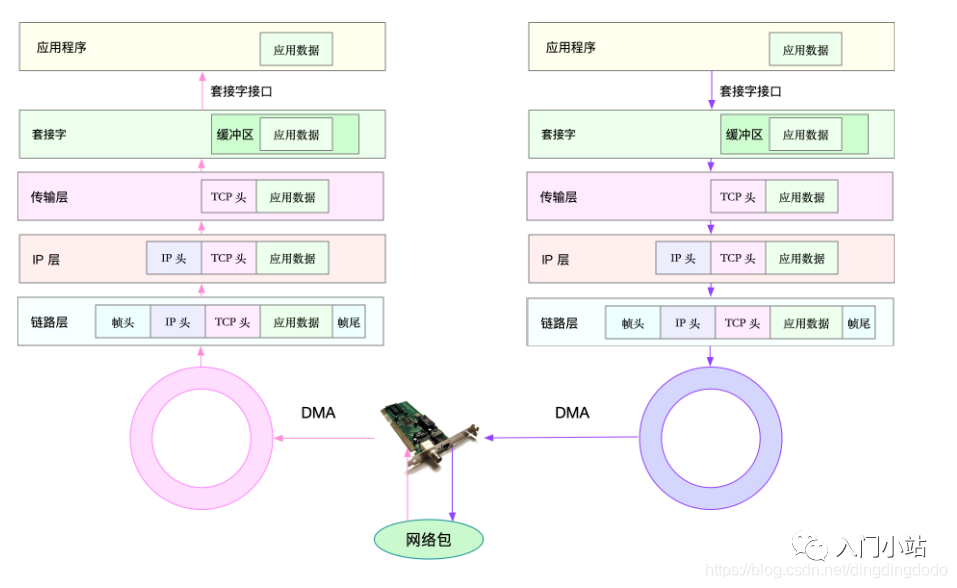
In the TCP/IP model, network data is passed and processed layer by layer:
-
For the sender sending a packet, the packet increases layer by layer from top to bottom: -
Application Layer: The application calls the Socket API to send the network packet, placing the packet into the Socket send buffer. -
The network protocol stack retrieves the packet from the Socket send buffer and processes it layer by layer from top to bottom according to the TCP/IP stack. -
Transport Layer: Adds TCP header. -
Network Layer: Adds IP header and performs routing lookup to confirm the next hop’s IP, fragmenting according to MTU size. -
Data Link Layer: The fragmented network packet is sent to the data link layer for physical address addressing to find the MAC address of the next hop, adding frame headers and trailers, and placing it in the sending queue. -
The driver reads the network frame from the sending queue via DMA and sends it out through the physical network card. -
For the receiver receiving a packet: -
When a network frame arrives at the network card, the network card places this network packet into the receiving queue via DMA, then notifies the interrupt handler that a network packet has been received through a hardware interrupt. -
The network card interrupt handler allocates a kernel data structure (sk_buff) for the network frame and copies it to the sk_buff buffer; then notifies the kernel of the new network frame received via a software interrupt. -
The kernel protocol stack retrieves the network frame from the buffer and processes it layer by layer from bottom to top through the network protocol stack. -
Data Link Layer: Checks the legality of the message at the data link layer, identifies the type of upper-layer protocol, removes the frame header and trailer, and then hands it to the upper-layer network layer. -
Network Layer: The network layer extracts the IPheader, determines the next direction of the network packet, e.g., whether to hand it over to the upper layer for processing or forward it. When the network layer confirms that this packet is to be sent to the local machine, it extracts the type of upper-layer protocol (e.g., TCP or UDP), removes theIPheader, and hands it to the transport layer for processing. -
Transport Layer: The transport layer extracts the TCP or UDP header and, based on the source IP, source port, destination IP, and destination port tuple, identifies the corresponding Socket and copies the data to the Socket’s receive buffer. -
Application Layer: The application can now use the Socket interface to read the newly received data.
Network Performance
Common Network [Performance Indicators]:
-
Bandwidth: Indicates the maximum transmission rate of the link, usually measured in b/s (bits per second). -
Throughput: Indicates the amount of data successfully transmitted in a unit of time, usually measured in b/s (bits per second) or B/s (bytes per second). -
Latency: Indicates the time delay from the moment a network request is sent until the remote response is received. This metric may have different meanings in different scenarios. For example, it can represent the time taken to establish a connection (e.g., TCP handshake latency) or the round-trip time (RTT) for a packet. -
PPS: Packets Per Second, indicating the transmission rate measured in network packets. PPS is often used to evaluate the forwarding capacity of networks based on Linux servers, which can be easily affected by packet size. -
Network Availability: Normal communication on the network. -
Concurrent Connections: How many TCP connections can be established. -
Packet Loss Rate: The proportion of lost packets to total packets. -
Retransmission Rate: The proportion of retransmitted network packets.
Common Network Performance Monitoring Tools:
-
netstat: Used to display statistics related to IP, TCP, UDP, and ICMP protocols, primarily showing socket states. -
ifconfig: Used to display or configure network device (network interface card) information. -
route: Used to display and manipulate the IP routing table; the destination IP address and subnet mask can be used to analyze the outgoing packet path. -
sar -n DEV: Displays network information; using sar to analyze the network is more about detecting traffic and packet volume and discovering anomalies. -
nmap: A tool for network probing and security auditing. -
ss: Queries network connection information. -
ping: Tests network connectivity.
Brief introduction to the usage of various tools: (For more detailed commands, please refer to the man pages.)
netstat
Used to display statistics related to IP, TCP, UDP, and ICMP protocols, primarily showing socket states.
Parameters: -a shows all sockets -n does not resolve DNS names (resolving DNS can be slow) -t filters for TCP-related network sockets -p shows process/program names -s displays some statistics related to the protocol stack.
Tips: ss is commonly used as a faster alternative; -t shows only TCP sockets; -n shows numeric addresses and ports; -p shows process information.
# View TCP and UDP socket information using netstat
[root@jessy /] netstat -antu
Active Internet connections (servers and established)
Proto Recv-Q Send-Q Local Address           Foreign Address         State
tcp        0      0 0.0.0.0:22              0.0.0.0:*               LISTEN
tcp        0      0 172.30.0.39:46522       169.254.0.55:5574       ESTABLISHED
tcp        0     36 172.30.0.39:22          163.177.68.30:3199      ESTABLISHED
udp        0      0 0.0.0.0:68              0.0.0.0:*
ud        0      0 0.0.0.0:68              0.0.0.0:*
ud        0      0 172.30.0.39:123         0.0.0.0:*
ud        0      0 127.0.0.1:123           0.0.0.0:*
ud        0      0 0.0.0.0:50844           0.0.0.0:*
ud6       0      0 fe80::5054:ff:fed2::123 :::*
ud6       0      0 ::1:123                 :::*

# Using ss can achieve the same effect

[root@jessy /] ss -ant
State      Recv-Q Send-Q             Local Address:Port              Peer Address:Port
LISTEN     0      128                      *:22                             *:*
ESTAB      0      0                   172.30.0.39:46522              169.254.0.55:5574
ESTAB      0      36                  172.30.0.39:22                 163.177.68.30:3199
Using netstat to view more detailed protocol stack information is more intuitive and detailed:
[root@jessy /] netstat -s
Ip:
    16250019 total packets received
    0 forwarded
    0 incoming packets discarded
    16249365 incoming packets delivered
    17150794 requests sent out
    1784 dropped because of missing route
Icmp:
    3568568 ICMP messages received
    87 input ICMP message failed.
    ICMP input histogram:
        destination unreachable: 339
        timeout in transit: 107
        echo requests: 3567914
        echo replies: 202
        timestamp request: 2
    3568477 ICMP messages sent
    0 ICMP messages failed
    ICMP output histogram:
        destination unreachable: 109
        echo request: 420
        echo replies: 3567914
        timestamp replies: 2
....
Tcp:
    1462144 active connections openings
    208661 passive connection openings
    1787 failed connection attempts
    2493 connection resets received
    2 connections established
    12207346 segments received
    13063063 segments send out
    105967 segments retransmited
    14 bad segments received.
    148312 resets sent
    InCsumErrors: 14
ifconfig
Used to display or configure network device (network interface card) information (now replaced by IP-related commands, including ip link, ip address, etc.).
# View network card information using ifconfig
[root@jessy /] ifconfig
eth0: flags=4163<UP,BROADCAST,RUNNING,MULTICAST>  mtu 1500
        inet 172.30.0.39  netmask 255.255.240.0  broadcast 172.30.15.255
        inet6 fe80::5054:ff:fed2:e0d8  prefixlen 64  scopeid 0x20<link>
        ether 52:54:00:d2:e0:d8  txqueuelen 1000  (Ethernet)
        RX packets 16381686  bytes 1576456712 (1.4 GiB)
        RX errors 0  dropped 0  overruns 0  frame 0
        TX packets 17176768  bytes 2555718092 (2.3 GiB)
        TX errors 0  dropped 0 overruns 0  carrier 0  collisions 0

lo: flags=73<UP,LOOPBACK,RUNNING>  mtu 65536
        inet 127.0.0.1  netmask 255.0.0.0
        inet6 ::1  prefixlen 128  scopeid 0x10<host>
        loop  txqueuelen 1000  (Local Loopback)
        RX packets 19726  bytes 967210 (944.5 KiB)
        RX errors 0  dropped 0  overruns 0  frame 0
        TX packets 19726  bytes 967210 (944.5 KiB)
        TX errors 0  dropped 0 overruns 0  carrier 0  collisions 0

> You can see the network interface's status flags, MTU size, IP, subnet, MAC address, and statistics for packet reception and transmission.

# The ip command is very powerful and can replace ifconfig, for example, ip addr
[root@jessy /] ip addr
1: lo: <LOOPBACK,UP,LOWER_UP> mtu 65536 qdisc noqueue state UNKNOWN group default qlen 1000
    link/loopback 00:00:00:00:00:00 brd 00:00:00:00:00:00
    inet 127.0.0.1/8 scope host lo
       valid_lft forever preferred_lft forever
    inet6 ::1/128 scope host
       valid_lft forever preferred_lft forever
2: eth0: <BROADCAST,MULTICAST,UP,LOWER_UP> mtu 1500 qdisc mq state UP group default qlen 1000
    link/ether 52:54:00:d2:e0:d8 brd ff:ff:ff:ff:ff:ff
    inet 172.30.0.39/20 brd 172.30.15.255 scope global eth0
       valid_lft forever preferred_lft forever
    inet6 fe80::5054:ff:fed2:e0d8/64 scope link
       valid_lft forever preferred_lft forever

# Tips: The ip command shows LOWER_UP indicating the physical network is connected, while ifconfig shows RUNNING; if it does not show, it may indicate a physical issue.
Some configuration operations for ifconfig:
# Start or stop a specified network card
ifconfig eth0 down
ifconfig eth0 up
# Modify MAC address
ifconfig eth0 down // shut down the network card
ifconfig eth0 hw ether $MACaddress // modify MAC address
ifconfig eth0 up // start the network card
# Configure IP address
ifconfig eth0 $ipaddress netmask 255.255.255.0  // configure IP address for eth0 network card, including subnet mask
# Enable and disable ARP protocol
ifconfig eth0 arp  // enable
ifconfig eth0 -arp  // disable
# Set maximum transmission unit
ifconfig eth0 mtu 1460 // set maximum packet size to 1460 bytes
route
Used to display and manipulate the IP routing table; can analyze outgoing packet paths through the destination IP address and subnet mask (now commonly replaced by ip route) (additionally: ip rule show displays the routing policy table; adjusting the routing policy table can set routing forwarding strategies).
# View routing table using route
[root@jessy /] #route -n
Kernel IP routing table
Destination     Gateway         Genmask         Flags Metric Ref    Use Iface
0.0.0.0         172.30.0.1      0.0.0.0         UG    0      0        0 eth0
172.30.0.0      0.0.0.0         255.255.240.0   U     0      0        0 eth0

# You can also use the ip command to view and manipulate some IP routing information:
[root@jessy /] ip route
default via 172.30.0.1 dev eth0
172.30.0.0/20 dev eth0 proto kernel scope link src 172.30.0.39
[root@jessy /] ip route show
default via 172.30.0.1 dev eth0
172.30.0.0/20 dev eth0 proto kernel scope link src 172.30.0.39
[root@jessy /] ip rule show
0: from all lookup local
32766: from all lookup main
32767: from all lookup default
You can configure the routing table using route:
route add -net 224.0.0.0 netmask 240.0.0.0 reject  # block a route
route del -net 224.0.0.0 netmask 240.0.0.0   # delete route record
route add default gw 192.168.120.240 # add default gateway
sar
sar is an excellent general performance monitoring tool that can output almost all the data of what Linux has accomplished. The sar command is provided in the sysetat rpm. Sar can display performance data for CPU, run queue, disk I/O, paging (swap), memory, CPU interrupts, networks, etc.
Use sar -n DEV to display network information
[root@jessy /] sar -n DEV 1
Linux 3.10.0-1062.18.1.el7.x86_64 (jessy)  08/03/2020  _x86_64_ (4 CPU)

02:57:41 PM     IFACE   rxpck/s   txpck/s    rxkB/s    txkB/s   rxcmp/s   txcmp/s  rxmcst/s
02:57:42 PM      eth0      4.00      2.00      0.21      0.21      0.00      0.00      0.00
02:57:42 PM        lo      0.00      0.00      0.00      0.00      0.00      0.00      0.00

02:57:42 PM     IFACE   rxpck/s   txpck/s    rxkB/s    txkB/s   rxcmp/s   txcmp/s  rxmcst/s
02:57:43 PM      eth0     10.00     10.00      0.80      1.32      0.00      0.00      0.00
02:57:43 PM        lo      0.00      0.00      0.00      0.00      0.00      0.00      0.00

02:57:43 PM     IFACE   rxpck/s   txpck/s    rxkB/s    txkB/s   rxcmp/s   txcmp/s  rxmcst/s
02:57:44 PM      eth0      8.00      8.00      0.61      1.43      0.00      0.00      0.00
02:57:44 PM        lo      0.00      0.00      0.00      0.00      0.00      0.00      0.00
Field introduction for sar -n DEV
| Field | Description |
|---|---|
| IFACE | LAN interface |
| rxpck/s | Data packets received per second |
| txpck/s | Data packets sent per second |
| rxkB/s | Bytes received per second |
| txkB/s | Bytes sent per second |
| rxcmp/s | Compressed data packets received per second |
| txcmp/s | Compressed data packets sent per second |
| rxmcst/s | Multicast data packets received per second |
Using sar is more about detecting traffic and packet volume and discovering anomalies. For more detailed analysis, tcpdump + wireshark is more convenient.
nmap
A tool for network probing and security auditing that needs to be installed (yum install nmap).
Commonly used for:
-
Detecting live hosts in a subnet. -
Quickly probing unreachable hosts during network failures. -
Testing whether security policies are functioning correctly.
[root@jessy /] nmap baidu.com

Starting Nmap 6.40 ( http://nmap.org ) at 2020-08-03 14:59 CST
Nmap scan report for baidu.com (39.156.69.79)
Host is up (0.042s latency).
Other addresses for baidu.com (not scanned): 220.181.38.148
Not shown: 998 filtered ports
PORT    STATE SERVICE
80/tcp  open  http
443/tcp open  https

Nmap done: 1 IP address (1 host up) scanned in 17.84 seconds
nmap <target ip1 address> <target ip2 address> # Quickly scan multiple IP addresses
nmap -p(range) <target IP>    # Specify ports and ranges
ping
The ping program is a common program for testing the reachability of another host, commonly used to test the connectivity and latency of remote hosts. The principle of the ping program is to send an ICMP message to the host and wait for the returned ICMP echo reply.
Some options include -s to set the packet size, -c to set the number of pings, -t to ping continuously until manually stopped, -R to view routing options.
[root@jessy /] ping baidu.com
PING baidu.com (39.156.69.79) 56(84) bytes of data.
64 bytes from 39.156.69.79 (39.156.69.79): icmp_seq=1 ttl=47 time=41.9 ms
64 bytes from 39.156.69.79 (39.156.69.79): icmp_seq=2 ttl=47 time=41.9 ms
...
--- baidu.com ping statistics ---
8 packets transmitted, 8 received, 0% packet loss, time 10491ms
rtt min/avg/max/mdev = 41.915/41.930/41.967/0.271 ms
iperf
iperf is a commonly used network performance testing tool used to test the throughput of TCP and UDP, communicating in a client-server manner to test the average throughput over a period of time.
# Run iperf on the server
# -s indicates to start the server, -i indicates reporting interval, -p indicates listening port
iperf3 -s
# Run iperf on the client
iperf3 -c 192.168.77.131

[root@jessy /] iperf3 -s -i 1 -p 12345
-----------------------------------------------------------
Server listening on 12345
-----------------------------------------------------------
Accepted connection from 172.30.0.39, port 49566
[  5] local 172.30.0.39 port 12345 connected to 172.30.0.39 port 49568
[ ID] Interval           Transfer     Bandwidth
[  5]   0.00-1.00   sec  5.23 GBytes  44.9 Gbits/sec
[  5]   1.00-2.00   sec  5.60 GBytes  48.1 Gbits/sec
[  5]   2.00-3.00   sec  5.10 GBytes  43.8 Gbits/sec
[  5]   3.00-4.00   sec  5.45 GBytes  46.8 Gbits/sec
[  5]   4.00-5.00   sec  4.84 GBytes  41.6 Gbits/sec
[  5]   5.00-6.00   sec  4.84 GBytes  41.6 Gbits/sec
[  5]   6.00-7.00   sec  4.93 GBytes  42.3 Gbits/sec
[  5]   7.00-8.00   sec  5.57 GBytes  47.8 Gbits/sec
[  5]   8.00-9.00   sec  5.85 GBytes  50.2 Gbits/sec
[  5]   9.00-10.00  sec   274 MBytes  59.1 Gbits/sec
- - - - - - - - - - - - - - - - - - - - - - - - -
[ ID] Interval           Transfer     Bandwidth
[  5]   0.00-10.04  sec  0.00 Bytes  0.00 bits/sec                  sender
[  5]   0.00-10.04  sec  53.4 GBytes  45.7 Gbits/sec                  receiver
-----------------------------------------------------------
Server listening on 12345
-----------------------------------------------------------
You can see the machine’s TCP throughput, bandwidth, and other information; the sender can also see window size, throughput, bandwidth, etc.
[SOCKET] Performance Optimization
Mainly focuses on the TCP header options and socket connection options, selecting based on complex network environments can greatly enhance socket performance.
TCP Options
SO_LINGER
SO_LINGER: Specifies how the close function operates for connection-oriented protocols; the kernel’s default close operation returns immediately, attempting to send any remaining data in the socket buffer to the other party.
struct linger {
     int l_onoff; /* 0 = off, nozero = on */
     int l_linger; /* linger time */
};
-
Setting l_onoff to 0 disables linger, close returns immediately, and unsent data will be handled by the kernel. -
Setting l_onoff to a non-zero value and l_linger to 0 enables linger, closing the connection immediately by sending a RST packet (instead of the normal FIN|ACK|FIN|ACK four packets). If there is unsent data in the send buffer, it will be discarded. The actively closing party’s TCP state will skip TIME_WAIT and go directly to CLOSED. -
Setting l_onoff and l_linger to non-zero values sets a timeout for closing the connection. If there is still data in the socket send buffer, the process goes to sleep, and the kernel enters a timed state to try to send this data. Before the timeout, if all data is sent and acknowledged by the other party, the kernel will close the connection normally using FIN|ACK|FIN|ACK four packets, and close() will return successfully. If the timeout occurs and data has still not been sent and acknowledged, the connection will be closed using the method above, and close() will return EWOULDBLOCK.
When a connection is actively closed, the party will enter the TIME_WAIT state. If there are too many TIME_WAIT states, it can lead to high system load (TIME_WAIT itself does not consume resources, but handling TIME_WAIT requires resources), so enabling linger to send RST packets directly avoids generating TIME_WAIT.
(TIPS: If there are too many TIME_WAIT states, the system will recycle and utilize them; during recycling, the longest wait time is taken into account, so if there are too many TIME_WAIT states, a very large data structure needs to be maintained to find the longest waiting time, which consumes some system computational resources.)
For excessive TIME_WAIT, you can also directly set the maximum number of TIME_WAIT states, reducing this number. (This may lead to some unreliable disconnections, but it is still a good way to reduce server pressure, only making client disconnections slower; a client is usually a single machine with few connections, so a longer disconnection is not a big issue.)
SO_REUSEADDR
Normally, after a port is released, it must wait two minutes (TIME_WAIT time) before it can be reused. SO_REUSEADDR allows the port to be reused immediately after release.
SO_REUSEADDR is used for TCP sockets in TIME_WAIT state, allowing them to be bound again. Server programs should always set the SO_REUSEADDR socket option before calling bind(). In TCP connections, the actively closing party enters the TIME_WAIT state, so this function allows the actively closing party to disconnect after receiving the passive party’s FIN and sending the ACK without handling the loss of this ACK.
This socket option conveys the message to the kernel: if this port is occupied but the TCP state is TIME_WAIT, then the port can be reused. If the port is busy and the TCP state is in other states, an error message indicating “address already in use” will still be received when trying to reuse the port. If you want the service program to be able to reuse the port immediately after stopping and using the same port, setting the SO_REUSEADDR option is very necessary. Overall, for servers that need to maintain a large number of TCP connections, this option can be set because many TIME_WAIT states may exist (especially HTTP services typically have the server act as the actively closing party), making this option very necessary; after all, in the worst-case scenario, it mainly affects the client’s disconnection speed, which is not a significant issue (clients usually do not need many TCP connections).
TCP_NODELAY/TCP_CORK
Nagle’s Algorithm
Nagle’s Algorithm is designed for situations where multiple small packets need to be sent consecutively; the effective data compared to the header is too small, leading to low sending efficiency and possibly causing network congestion. Nagle’s Algorithm can reduce the number of small packets in the network, thus lowering network congestion levels. A common example of Nagle’s Algorithm is the Telnet program, where each keystroke sends a data packet containing 41 bytes, of which only one byte is the payload, while the remaining 40 bytes are headers. If a packet is sent for each keystroke, significant overhead will occur. To reduce this overhead, Nagle’s Algorithm specifies that when TCP sends a small segment (smaller than MSS), it must wait for the acknowledgment from the other party before continuing to send another small segment. Therefore, the sender will send the first small packet and cache any subsequent small character data instead of sending immediately until it receives the ACK for the previous packet or the current character is urgent, or the cached character data reaches a certain length. Nagle’s Algorithm is not a panacea; it increases the delay in sending TCP data. In some applications requiring low latency (such as instant messaging applications), the provisions of Nagle’s Algorithm are often unacceptable, requiring TCP_NODELAY or TCP_CORK to be set to disable Nagle’s Algorithm.
TIPS: TCP’s delayed ACK and Nagle’s Algorithm have similar principles; delayed ACK: when TCP receives data, it does not immediately send an ACK to the other party. Instead, it waits for the application layer to generate data, then sends both the ACK and data together, with the sent ACK sequence number possibly being a larger ACK sequence number (up to 40 milliseconds in Linux). (The ACK sequence number indicates that messages with lower sequence numbers have been received, so during the waiting period, some messages may have been received, and ultimately only the largest ACK sequence number needs to be sent to indicate that all previous messages have been received.)
TCP_NODELAY/TCP_CORK
TCP_NODELAY and TCP_CORK both disable Nagle’s Algorithm, but their behaviors differ:
-
TCP_NODELAY does not use Nagle’s Algorithm and does not combine small packets into larger packets for sending, but sends small packets directly. -
TCP_CORK is suitable for sending large amounts of data, which can improve TCP’s issuing efficiency. After setting TCP_CORK, it will attempt to send the maximum amount of data each time; of course, there is a blocking time, and when the blocking time expires, the data will be sent automatically.
TCP_DEFER_ACCEPT
Delays acceptance; after setting this option, the server will only establish a connection after receiving the first piece of data. (This can be used to prevent SYN flood attacks.)
When this option is set, after the server receives the connect request, it completes the three-way handshake but remains in the SYN_RECV state instead of transitioning to ESTABLISHED. The operating system will not receive data until it receives a piece of data, at which point it will transition to the ESTABLISHED state. Therefore, if the client does not send data, the server will retransmit the SYN/ACK packet, with limits on the number of retransmissions and timeout values.
SO_KEEPALIVE
SO_KEEPALIVE is used to check whether the other host has crashed, preventing the (server) from being indefinitely blocked on TCP connection input.
When this option is set, if no data has been exchanged in either direction on this socket for 2 hours, TCP will automatically send a keepalive probe segment to the other party. This is a TCP segment that the other party must respond to. It can lead to the following three scenarios:
-
The other party receives everything normally: an expected ACK response; after 2 hours, TCP will send another probe. -
The other party has crashed and restarted: responds with RST. The pending error for the socket is set to ECONNRESET, and the socket itself is closed. -
The other party does not respond: TCP sends another 8 probe segments, one every 75 seconds, in an attempt to get a response. If no response is received after sending the first probe for 11 minutes and 15 seconds, it gives up. The pending error for the socket is set to ETIMEOUT, and the socket itself is closed. If the ICMP error is “host unreachable,” it indicates that the other party is not crashed but unreachable, setting the pending error to EHOSTUNREACH.
The three parameters related to SO_KEEPALIVE are explained in detail as follows:
-
tcp_keepalive_intvl: The frequency of sending keepalive probe messages. Default value is 75s. -
tcp_keepalive_probes: The number of times TCP sends keepalive probe messages to determine whether the connection has been disconnected. Default value is 9. -
tcp_keepalive_time: The time from the last data exchange to the first keepalive probe message sent by TCP when keepalive is enabled, indicating the allowed duration of inactivity. Default value is 7200s (2h).
SO_SNDTIMEO & SO_RCVTIMEO
SO_RCVTIMEO and SO_SNDTIMEO are used to set the timeout for receiving and sending data over the socket, respectively.
Thus, these two options only affect system calls related to data transmission. The receive timeout affects the states of read, readv, recv, recvfrom, and recvmsg, while the send timeout affects the states of write, writev, send, sendto, and sendmsg.
Buffer Sizes
SO_RCVBUF and SO_SNDBUF: set the size of the socket buffer, which affects the performance of the socket.
-
SO_SNDBUF: The maximum capacity of the TCP send buffer; -
SO_RCVBUF: The maximum capacity of the TCP receive buffer; -
The receiving buffer caches the data sent from the remote side. If the buffer is full, no new data can be received. -
The write buffer caches the data to be sent. If the write buffer is full, the application’s write operation will be blocked.
The path for socket buffer parameters in the proc directory is:
/proc/sys/net/core/rmem_default
/proc/sys/net/core/rmem_max
/proc/sys/net/core/wmem_default
/proc/sys/net/core/wmem_max
Theoretically, increasing the buffer size will enhance the socket transmission rate; however, this is not always the case. Buffers only affect performance when there is a significant difference in performance between the sender and receiver. Additionally, for TCP connections, the actual transmission process depends on the window sizes of both the sender and receiver, so merely increasing the sender’s buffer will not significantly affect the overall performance.
In high-latency networks, bandwidth utilization is low, primarily because as latency increases, the data sent by the sender cannot reach the receiver in a timely manner. This leads to the sender’s buffer filling up, preventing continuous data transmission. The receiver’s TCP advertised window is also influenced by the remaining size of the receiver’s buffer. If the receiving buffer is small, it will inform the sender to reduce the sending window. Thus, the tuning strategy here should be to increase tcp_wmem on the sender’s side and tcp_rmem on the receiver’s side.
If the network environment is poor, with a high packet loss rate, you may find that even increasing the buffer sizes on both the sender and receiver will not enhance the overall transmission rate. This is mainly due to high packet loss, leading to network congestion and frequently triggering slow start, causing the actual window bottleneck not to be the buffer size, and even failing to reach larger values. In this case, you might consider adopting different congestion control algorithms; the BBR algorithm is insensitive to packet loss, so using BBR congestion control in such situations will improve overall network performance. If the network has low packet loss but high latency, adjusting the congestion control algorithm will not yield significant improvements; the main bottleneck will be the buffers.
To enhance network throughput, it is generally necessary to adjust the sizes of these buffers:
-
Increase the buffer size for each socket net.core.optmem_max; -
Increase the size of the socket receive buffer net.core.rmem_max and the send buffer size net.core.wmem_max; -
Increase the TCP receive buffer size net.ipv4.tcp_rmem and send buffer size net.ipv4.tcp_wmem.
backlog
The four steps of TCP socket service are socket->bind->listen->accept.
When calling the listen function, there is a backlog parameter. In Linux, backlog indicates the size of the queue that has completed (ESTABLISHED) but has not been accepted.
int listen(int sockfd, int backlog);
The TCP connection establishment process: the server receives the client’s SYN packet, sends a SYN+ACK packet, and creates a connection with the state SYN_RCVD in memory, placing it in the incomplete queue. The size of this queue can be set through /proc/sys/net/ipv4/tcp_max_syn_backlog. After the server receives the client’s ACK packet, the connection’s state changes from SYN_RCVD to ESTABLISHED and moves to the completed queue.
When the server program calls accept, the connection is removed from the completed queue and managed by the kernel.
(After the second handshake is completed, the server has already placed the connection in the half-connected queue, and when the third handshake is successful, it is placed in the full-connected queue. When the accept process is called, the connection is managed by the kernel.)
The backlog specifies the size of the full connection queue. If the full connection queue is full and tcp_abort_on_overflow is set to 0, the server will resend the SYN+ACK to the client after a while. If the client has a short timeout, it may easily lead to exceptions. (tcp_abort_on_overflow set to 0 means that if the full connection queue is full during the third step of the three-way handshake, the server discards the ACK sent by the client), hence if the backlog is too small, it may lead to the full connection queue being easily filled, resulting in TCP connection establishment failures.
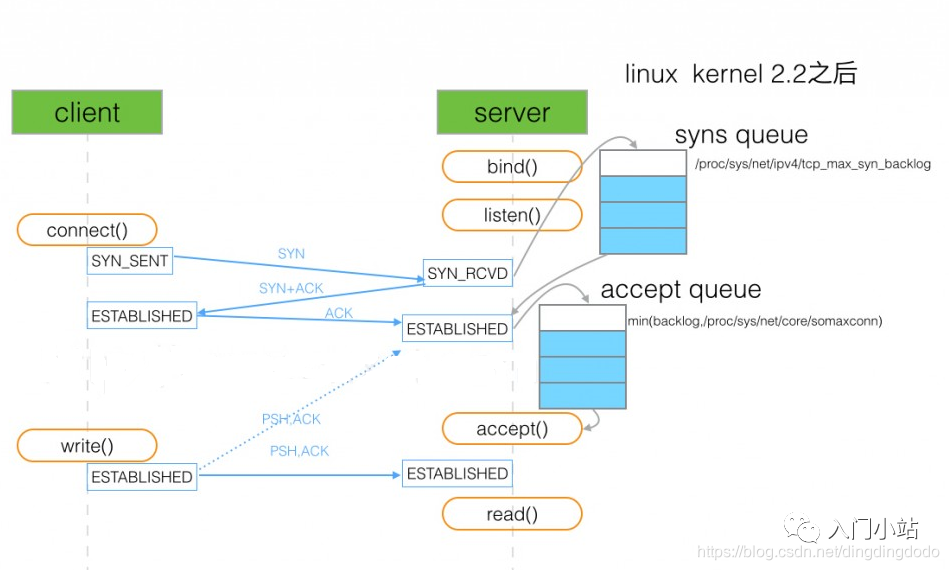
After setting the backlog, the system compares it with /proc/sys/net/core/somaxconn, taking the smaller value as the actual backlog.
When the connected queue is full, if tcp_abort_on_overflow is set to 0, it means that if the full connection queue is full during the third step of the three-way handshake, the server will discard the ACK sent by the client.
When the half-connected queue is full, if syncookies are enabled (net.ipv4.tcp_syncookies = 1), new connections will not enter the incomplete queue and will not be affected. Otherwise, the server will stop accepting new connections.
SYN Flood Attack
By sending SYN packets with forged IP addresses to the server, it fills the server’s incomplete queue, causing the server to send SYN+ACK packets without receiving replies, repeatedly sending SYN+ACK packets, making the server unavailable. Enabling syncookies is a simple and effective countermeasure. It only takes effect when the incomplete queue is full.
SYN flood attacks cause the attacked server to maintain a large number of SYN_RECV states in the “half connections” and will retry the second handshake packet by default 5 times, filling the TCP waiting connection queue, exhausting resources (CPU overload or insufficient memory), preventing normal business requests from connecting.
Performance Optimization Strategies
From the perspective of network I/O, the following strategies can be considered:
-
I/O multiplexing technology epoll, primarily used to replace select and poll. -
Asynchronous I/O technology. Asynchronous I/O allows applications to initiate many I/O operations simultaneously without waiting for these operations to complete; once I/O is complete, the system will notify the application of the results through event notifications.
From the perspective of the process working model, the following strategies can be considered:
-
Main process + multiple worker subprocesses. The main process manages network connections, while the subprocesses handle actual business processing. -
Multi-process model listening on the same port, i.e., load balancing strategy. All processes listen on the same interface and enable the SO_REUSEPORT option, with the kernel responsible for load balancing requests to these listening processes.
Application layer network protocol optimization strategies:
-
When the request rate is high and connections are usually continuous, using long connections instead of short connections can significantly reduce the cost of establishing TCP connections. -
Using memory or other methods to cache infrequently changing data can reduce network I/O frequency and speed up application response times. -
Using serialization methods like Protocol Buffer to compress the volume of network I/O data can improve application throughput. -
Using DNS caching, prefetching, HTTPDNS, etc., to reduce DNS resolution delays can also enhance overall network I/O speed.
Source: Beginner’s Station
– EOF –

Add the WeChat of the homepage owner, not only Linux skills +1

The homepage owner regularly shares Linux-relatedtools,resources and selectedtechnical articles on personal WeChat, and occasionally shares some interesting activities, job recommendations, and how to use technology for side projects.

Add WeChat to open a window
1. Classic Shell Thirteen Questions
2. Crash Tool Practical – Structure Analysis
3. Good article: Linux Kernel Concepts and Learning Path
Did you gain something after reading this article? Please share it with more people.
Recommended to follow ‘Linux Enthusiasts’ to enhance Linux skills.
Likes and views are the biggest support ❤️