In the previous article, I introduced some useful debugging communication interface tools. Interested readers can check it out: [Embedded Auxiliary Tools]: Communication Interface Edition. This time, I will introduce the affordable and effective OpenOCD toolchain.Before introducing OpenOCD, let me first explain two concepts: ICD and OCD.ICD and OCDStrictly speaking, ICD (In-Circuit Debugger) and OCD (On-Chip Debugger) are two related yet distinct concepts in the field of embedded debugging. The former does not integrate debugging functions into the chip, like microcontroller debuggers from decades ago, while the latter integrates debugging functions into the chip itself (modern methods, such as ARM’s CoreSight, etc.). With the advancement of chip technology, modern ICDs have gradually merged with OCDs. Nowadays, it is rare for anyone to strictly differentiate between ICD and OCD.Reflecting on over twenty years ago, when I first entered the embedded industry, the first ICD I encountered was the industry benchmark: Lauterbach TRACE32. This is a very expensive debugging tool, costing tens of thousands of dollars, powerful but also quite difficult to master. At that time, being proficient in setting up and using TRACE32 was an essential skill for senior engineers in my industry.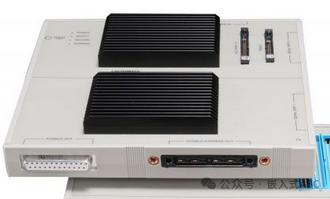 Of course, general embedded products are unlikely to require a TRACE32 that costs tens of thousands of dollars.What is OpenOCD?OpenOCD, short for Open On-Chip Debugger, is an open-source OCD. However, it is important to note that it differs somewhat from the aforementioned OCD. It is purely software and cannot independently function to debug programs. To understand its role, we must mention another concept: “embedded debugging toolchain.”Embedded Debugging Toolchain
Decades ago, hardware and software were highly coupled, and debugging relied on vendor-specific closed interfaces, resulting in poor compatibility and efficiency between products from different vendors. Later, with the development of embedded technology, debugging interfaces became open and standardized, which led to the development of embedded debugging toolchains, allowing many non-chip companies and open-source communities to participate in various aspects of the debugging toolchain. This has resulted in a flourishing variety of debugging tools today.
To prevent the content of this article from becoming too scattered, we will use ARM as an example to introduce the embedded debugging toolchain (Debug toolchain).
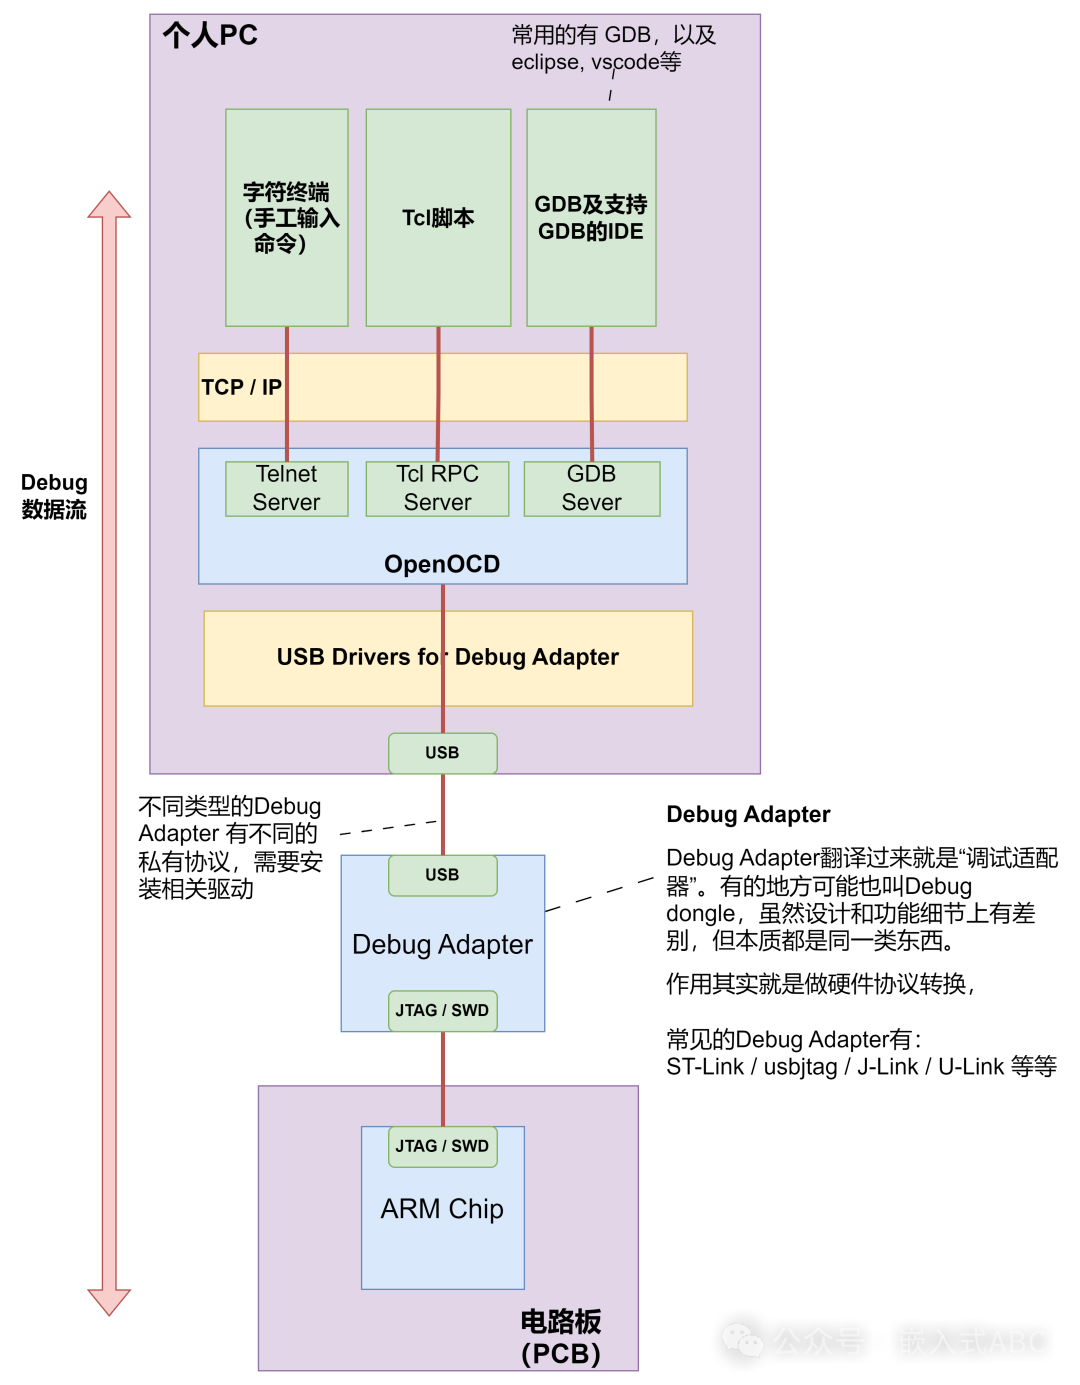 How to Use OpenOCDAs you can see from the above image, OpenOCD is simply a PC software. Its role is essentially an enhanced version of a GDB Server that can support many different vendors’ Debug Adapters (of course, in addition to the GDB Server, it also includes Telnet and Tcl RPC Server).To use OpenOCD:Step 1: Choose a Debug Adapter supported by OpenOCD, such as ST-Link, and install the relevant PC drivers. If the requirements are not high, use whatever is cheap.Step 2: Choose a GDB-supported IDE according to your preference, such as Eclipse or VSCode. You can also choose Telnet and write your own Tcl scripts; there are many ways to do this.How to Obtain OpenOCD?
Please visit: https://www.openocd.org/