Last week, I updated mycomputersystem and reset mycomputer, reinstalling the Conda environment. Today, while running some previously written code, I couldn’t get the plotting to work correctly. After trying various methods, I finally discovered that the issue was due to updatingGeoPandas to the latest version 1.1.1. Although it was a minor issue, it caused quite a bit of “trouble,” so I am documenting andsharing this.The core part of the code is quite simple, which is to plot global ecoregions under theRobinson projection:
import geopandas as gpd
import cartopy.crs as ccrs
import matplotlib.pyplot as plt
gdf = gpd.read_file('/data/users/Ecoregions2017.shp')
fig, ax = plt.subplots(figsize=(10, 6), subplot_kw={'projection': ccrs.Robinson()})
gdf.plot(ax=ax, transform=ccrs.PlateCarree(), column="ECO_NAME", edgecolor="black")
plt.show()
Identifying the problem: The plotted result is as follows. There seems to be an issue in the process of converting from latitude and longitude coordinates toRobinson projection coordinates, which caused the entire area to be rendered incorrectly.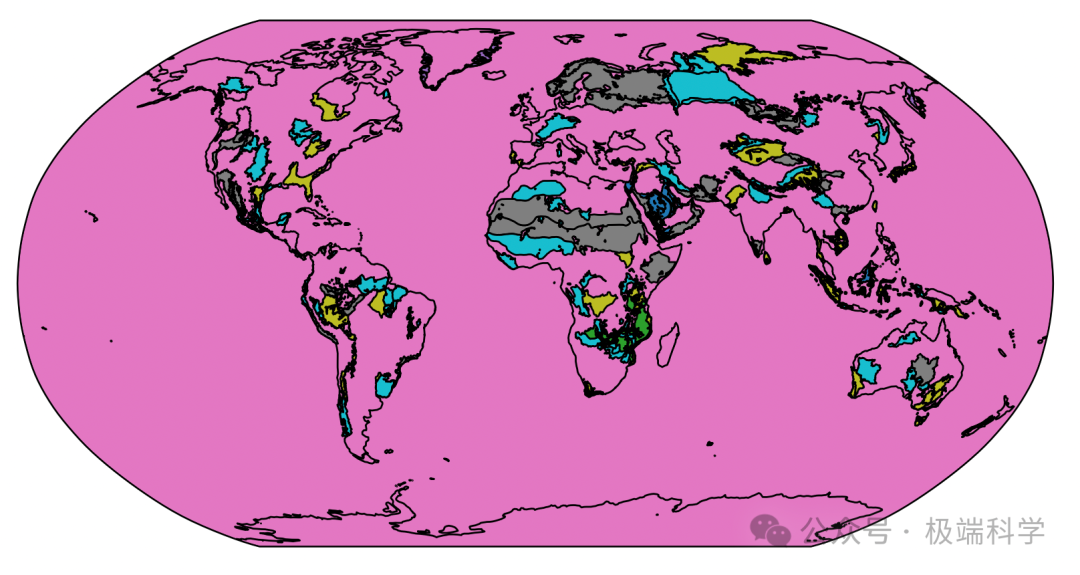 Solution: Reconfiguring the Conda environment and downgrading the Python version did not work. After importing dozens of packages, I finally found that the core issue should be withGeoPandas. I checked the update records ofGeoPandas (“Read the original text”), and based on the update time, I found that the version installed at that time should be1.0.1. After reconfiguring the environment to that version, the problem was resolved.
conda create --name mypy ipykernel scipy seaborn xarray dask netCDF4 bottleneck cartopy rasterio python geopandas=1.0.1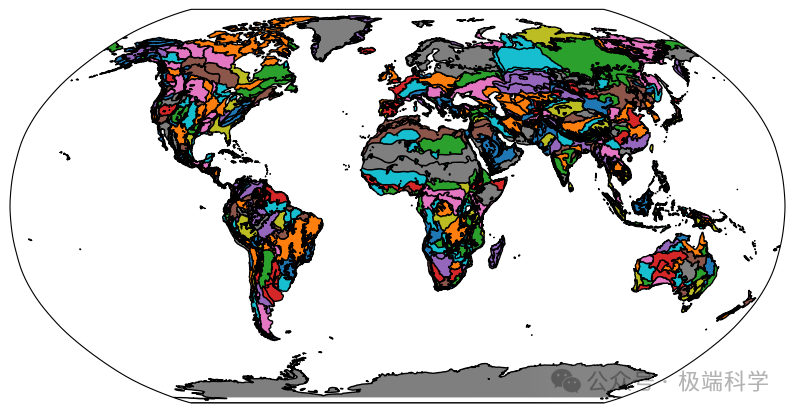
——End——
We welcome you to follow and share the “Extreme Science” public account, and we look forward to exploring the extreme pulses of the Earth with you!
#Python #Conda #GeoPandas #Plotting