Follow and star to learn new Python skills every day
Due to changes in the public account’s push rules, please click “View” and add “Star” to get exciting technical shares at the first time
Source: Internet
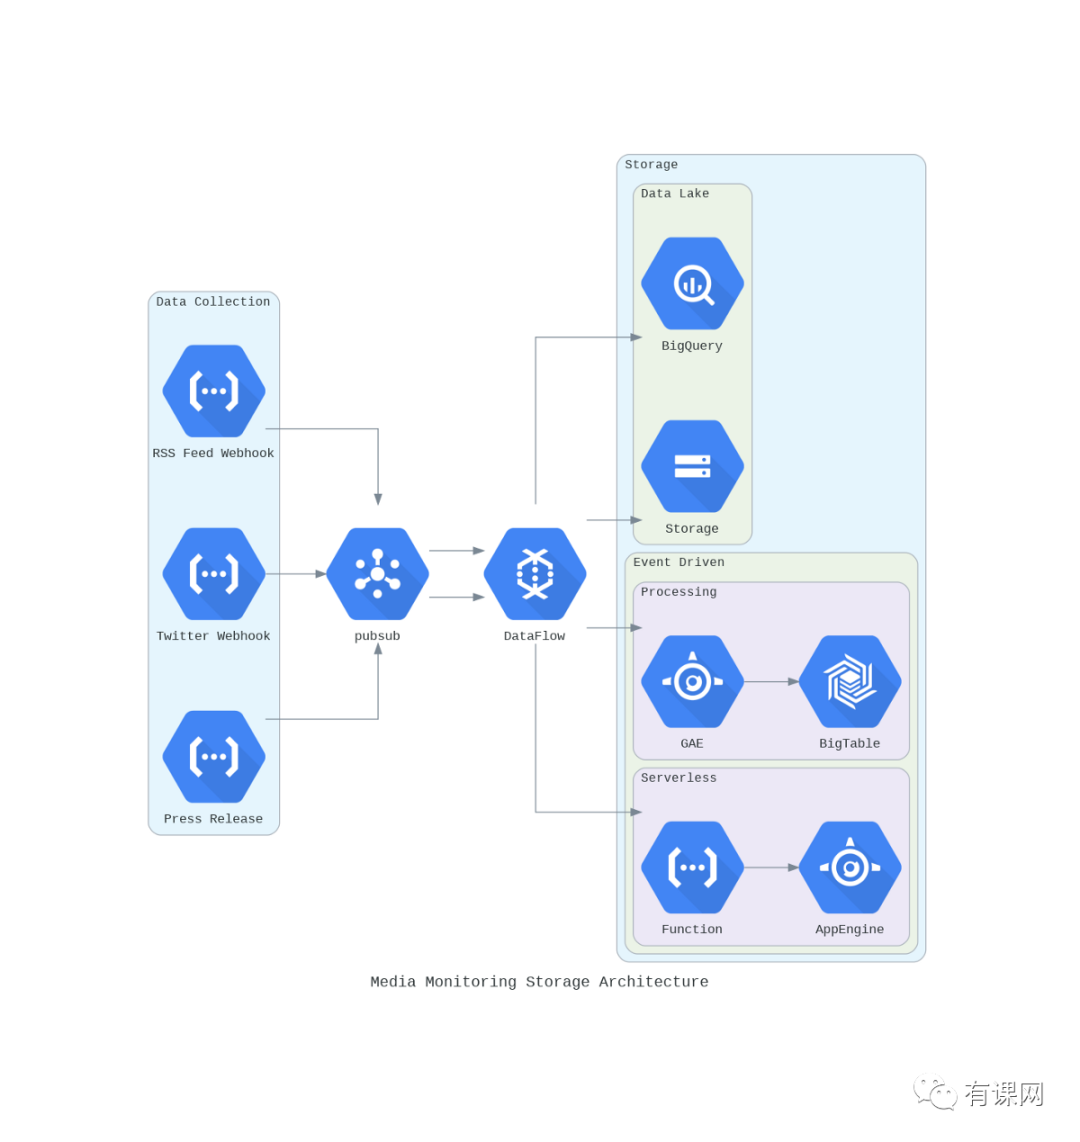 > Build with the code from the gist linked here.
Some Background Story
Earlier, I stumbled upon a striking and interesting Python library: diagrams, which creates diagrams with the same name. The generated diagrams are usually awkward images pasted into draw.io or Google Diagrams.Then, I wasted a lot of time aligning everything correctly. Besides this annoying process, when I needed to update these diagrams later, I had to lift and move more than half of the components just to make a few changes to the architecture. After further investigation into the library, I could see it could alleviate my pain.
Getting Started with Your Own Diagrams
The first requirement to start building some of these diagrams is to install Python 3.6 or higher. In this case, you will need to install GraphViz, as that is how the diagrams are drawn. The GitHub repository actually has a pretty good “Getting Started” section, so feel free to refer to it here if you need help installing anything. Once you have installed the “diagrams” library using your favorite Python package manager, you can start creating.For me, since I met the initial requirements, it was as easy as the following command.
Component Types
The diagram library provides components for many different providers. Among the 14 available cases, the following may be most relevant to most use cases.
-
AWS / GCP / Azure– These providers expose the official cloud service assets you will use in any diagram leveraging any major cloud provider. My team primarily works in GCP, and before going through this library, I would spend hours manually building these diagrams, so I was very excited when I found these node assets readily available.
-
Generic and On-Premises— If you want to illustrate the underlying technology in a cloud-agnostic way, these nodes can be used together. For example, providing Beam components for architecture displayed on Google DataFlow.
-
Frameworks – If you want to illustrate nodes with programming languages, these components will be very useful.
-
SaaS — There is even a set of SaaS nodes available when you want to demonstrate that notifications in the architecture have landed in something like Slack.
Concepts of Diagrams
Diagram— A diagram is the main object representing the diagram.Node – An abstract concept representing a single system component.Cluster – Allows you to organize nodes into groups (or clusters) rather than isolated components.Edge — Represents the links between nodes.
Creating Your First Diagram
Now that you know the basic concepts, you can follow the order in which we learned these concepts to build an extremely simple diagram using code. The example diagram we will build will be a simple load-balanced website on AWS using a PostgreSQL database and Redis cache, so we can use multiple component providers.
Step 1: Create Diagram Workspace
from diagrams import Diagram
with Diagram("Simple Website Diagram") as diag: pass # This will illustrate the diagram if you are using a Google Colab or Jupyter notebook.
This will only display a blank diagram with the specified label, as shown below. > Build with the code from the gist linked here.
Step 2: Add Nodes
Now that we have a workspace, it’s time to add the nodes required for the website. The nodes we will add come from two different providers: AWS and On-Prem. If you were actually doing this, you would likely stick with AWS as they might use products like RDS and ElastiCache with that cloud provider.
from diagrams import Diagram, Cluster
from diagrams.aws.compute import EC2
from diagrams.aws.network import ELB
from diagrams.aws.network import Route53
from diagrams.onprem.database import PostgreSQL # Would typically use RDS from aws.database
from diagrams.onprem.inmemory import Redis # Would typically use ElastiCache from aws.database

with Diagram("Simple Website Diagram") as diag:
    dns = Route53("dns")
    load_balancer = ELB("Load Balancer")
    database = PostgreSQL("User Database")
    cache = Redis("Cache")
    svc_group = [EC2("Webserver 1"),
                 EC2("Webserver 2"),
                 EC2("Webserver 3")]
diag # This will illustrate the diagram if you are using a Google Colab or Jupyter notebook.
As you can see, we no longer have a blank diagram. Each of our nodes is depicted, and these are the “elements” of the architecture we are building.The next step will be to organize some of our nodes into logical groups and then link each node with edges.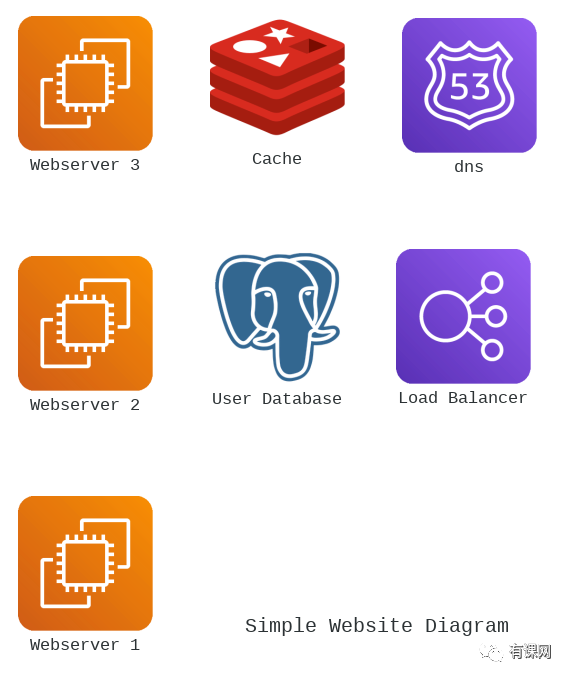 > Build with the code from the gist linked here.
Step 3: Group Nodes (Optional)
In this example, we will group the load-balanced web servers. This is not always necessary in many diagrams created in the past, but as your architecture grows, grouping these nodes into clusters can often improve readability.Below you can see that to do this, we just need to move the instances of the nodes into the cluster scope we are creating.
from diagrams import Diagram, Cluster
from diagrams.aws.compute import EC2
from diagrams.aws.network import ELB
from diagrams.aws.network import Route53
from diagrams.onprem.database import PostgreSQL # Would typically use RDS from aws.database
from diagrams.onprem.inmemory import Redis # Would typically use ElastiCache from aws.database

with Diagram("Simple Website Diagram") as diag:
    dns = Route53("dns")
    load_balancer = ELB("Load Balancer")
    database = PostgreSQL("User Database")
    cache = Redis("Cache")
    with Cluster("Webserver Cluster"):
        svc_group = [EC2("Webserver 1"),
                    EC2("Webserver 2"),
                    EC2("Webserver 3")]
diag
As you can see, the diagram is still just a list of nodes, but now we have logically grouped the appropriate nodes.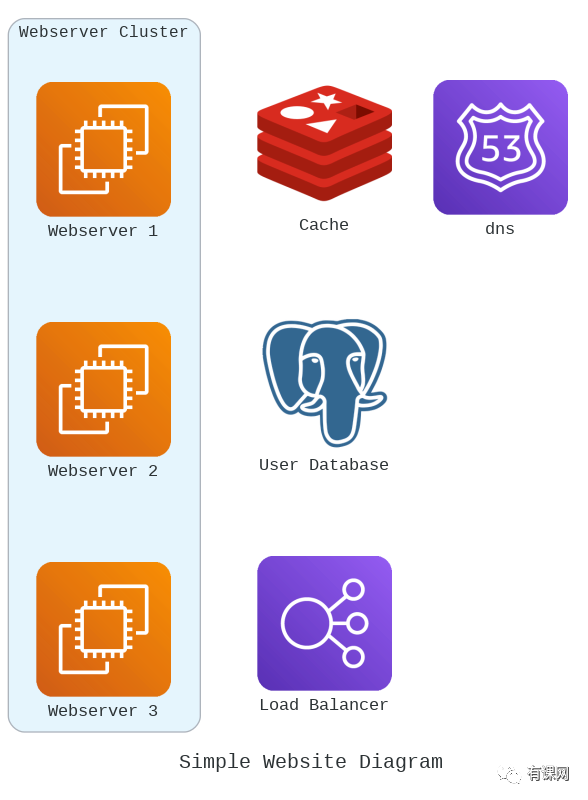 > Build with the code from the gist linked here.
Step 4: Connect Everything Together
In the final step, we will link the nodes we just arranged to be used in the architecture. This task takes me the longest time when I need to update or adjust the architecture. If you look below, you just need to define the flow to each node with double arrows!In this example, we will only link the nodes without labels, but if you look at the documentation for applying labels to links, it’s a very simple task.
from diagrams import Diagram, Cluster
from diagrams.aws.compute import EC2
from diagrams.aws.network import ELB
from diagrams.aws.network import Route53
from diagrams.onprem.database import PostgreSQL # Would typically use RDS from aws.database
from diagrams.onprem.inmemory import Redis # Would typically use ElastiCache from aws.database

with Diagram("Simple Website Diagram", direction='LR') as diag: # It's LR by default, but you have a few options with the orientation
    dns = Route53("dns")
    load_balancer = ELB("Load Balancer")
    database = PostgreSQL("User Database")
    cache = Redis("Cache")
    with Cluster("Webserver Cluster"):
        svc_group = [EC2("Webserver 1"),
                    EC2("Webserver 2"),
                    EC2("Webserver 3")]
    dns >> load_balancer >> svc_group
    svc_group >> cache
    svc_group >> database
diag
The generated image can be seen below, and now you can see the logical flow between each node in the diagram. You can reverse this flow by changing the order in which you define the nodes. Besides adjusting the flow, you can change many things since the edge objects contain three properties: label, color, and style.We will not cover how to customize these here. If you are interested in learning more, please refer to the documentation links at the end of this article, and these properties reflect the corresponding graphviz edge properties, which can simplify things if you have used that tool in the past.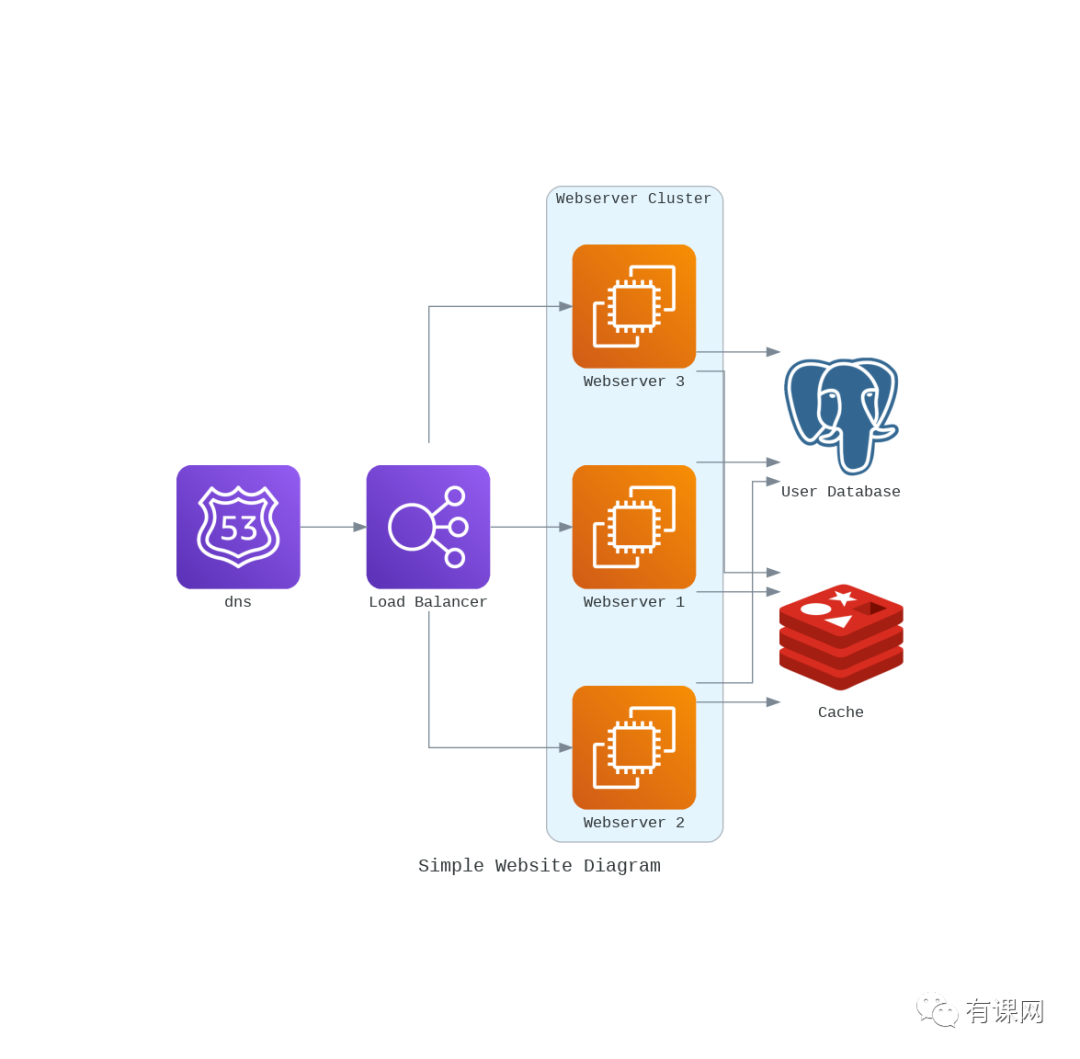 > Build with the code from the gist linked here.
Conclusion
Now, you are determined to build beautiful diagrams with code, and there is great potential in leveraging this workflow in terms of automation possibilities and saving time with regular maintenance of architecture diagrams.The time saved by using this tool alone will make me use this approach in the future. I certainly won’t miss the work involved in manually adjusting diagrams, carefully aligning components and arrows, and every iteration of my architecture.I hope my experience is of interest to those looking to build diagrams with code and is useful for future diagram work. Thank you for reading!
Long press or scan the QR code below to get free Python public courses and hundreds of gigabytes of learning materials organized by experts, including but not limited to Python e-books, tutorials, project orders, source code, etc.

▲ Scan the QR code - Get it for free
Recommended Reading
Python queues should no longer be written by yourself! This is the officially recommended efficient solution.
Python has had asynchronous capabilities for 10 years - why hasn't it become more popular?
Use these little-known (and mostly overlooked by developers) techniques to speed up your Python code by 10 times.
15 top Python libraries you must try!
Click Read the original to learn more