Is your debugging program always encountering bugs? Are you confused by packet analysis? Don’t worry, today we will clarify the practical tips for the two most commonly used debugging tools in embedded development — KEIL and Wireshark! The content is dense, so it’s recommended to bookmark it ⭐ and refer back when needed!
🛠 KEIL: Essential for Microcontroller Debugging
Official Download: https://www.keil.com/
KEIL is not only a compilation tool, but its debugging capabilities are also quite powerful. Whether for software simulation or hardware testing, it can help you locate issues.
1. Debug Mode Settings
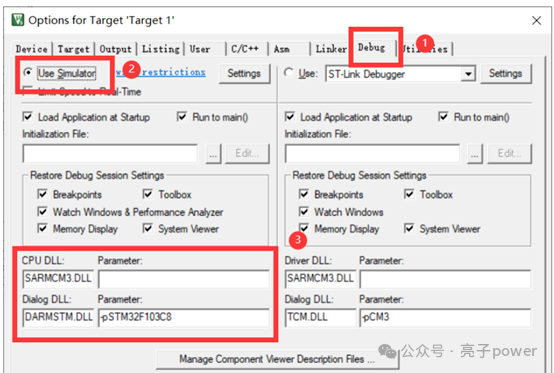
Click <span>Option for Target</span> → <span>Debug</span>, and select the debugging method: 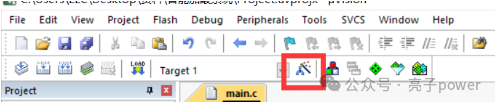

- Software Simulation: Can run without hardware, convenient for early validation
- Hardware Debugging: Connect to ST-LINK/DAP and other emulators for debugging in a real hardware environment
2. Basic Debugging Operations
Click the <span>Debug</span> button on the toolbar to enter the debugging interface; you must be familiar with these buttons:
| Button | Description | Usage Scenario |
|---|---|---|
| RST | Program Reset | When you want to rerun the program |
| RUN | Run at Full Speed | Let the program run for a while |
| STOP | Stop Running | Stop immediately when a problem is found |
| Step | Step Into | Jump into the function to see details |
| Step Over | Step Over | Execute without entering the function, directly finish |
| Step Out | Step Out of Function | Quickly exit the current function |
RST: Resets the program, preparing for re-execution. 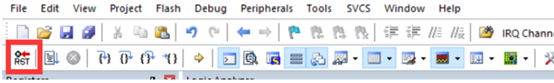 RUN: Run at full speed.
 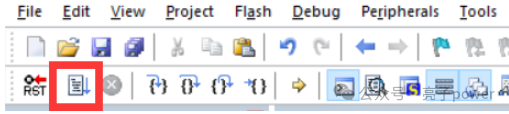 STOP: Stop running at full speed.
 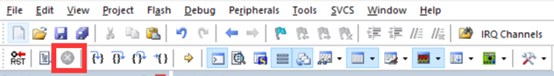 Step: Step execution, jumping into the sub-function when encountering a function.
 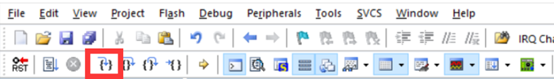 Step Over: Execute line by line, each click runs one line, it will not enter the sub-function, directly skip the function.
 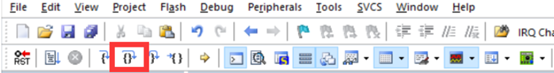 Step Out: Step out of the currently entered function, this button is only activated when entering a sub-function.
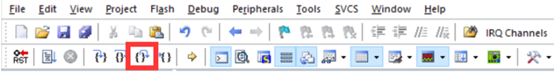
3. Variable Observation
Right-click on the variable → <span>Add to Watch</span>, to view the variable value changes in real-time, debugging relies heavily on this!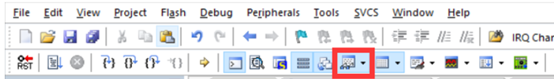
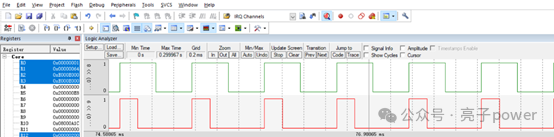
4. Pin Waveform Viewing
Use a logic analyzer to capture pin signals: 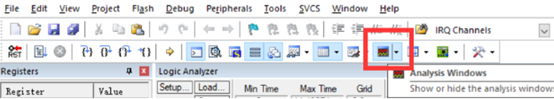
- Click
<span>Logic Analyzer</span>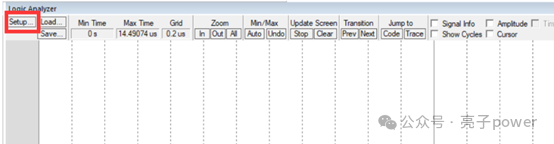
- Click
<span>Setup</span>to add pins, such as<span>PORTB.8</span>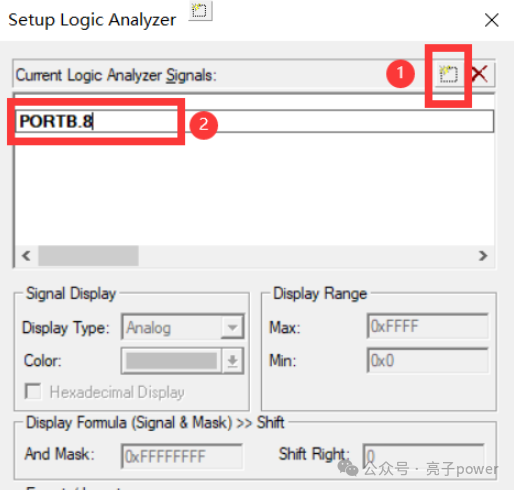
- Set the display type to
<span>Bit</span> - Run the program to view the waveform in real-time!
🌐 Wireshark: The Packet Sniffer Tool
Official Download: https://www.wireshark.org/download.html Debugging embedded networked devices cannot do without packet capturing, and Wireshark is specialized for this.
Capture Filter vs Display Filter
- Capture Filter: Filters during capture, not capturing irrelevant packets
- Display Filter: Captures all packets, but selectively displays (more commonly used)
Display Filter Syntax (Key Point!)
Remember these 5 types of elements, they can be combined flexibly:
| Type | Example | Description |
|---|---|---|
| IP | <span>ip.addr == 192.168.1.1</span> |
Filter by IP |
| Port | <span>tcp.port == 80</span> |
Filter by port |
| Protocol | <span>tcp</span> / <span>http</span> |
Note to use lowercase |
| Comparison | <span>==</span> / <span>></span> / <span><=</span> |
Regular comparison |
| Logic | <span>and</span> / <span>or</span> / <span>not</span> |
Combine conditions |
Common Filter Examples
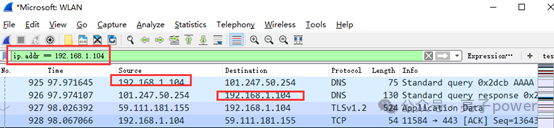
ip.addr == 192.168.32.121 # Only view packets from this IP
tcp.port == 80 # Only view port 80 packets
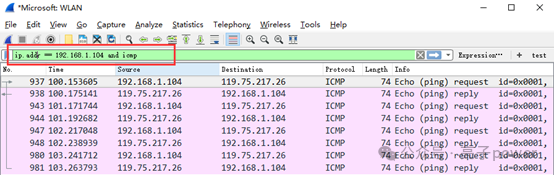
ip.addr == 192.168.1.104 and icmp # Only view ICMP packets from this IP