Friendly Reminder: This article is lengthy, the reading time is about 10 minutes.
CodeViser is a JTAG emulator developed by J&D Tech, supporting CPUs like ARM and RISC-V. The accompanying CVD debugging software provides an efficient and stable debugging environment, supporting source-level debugging and powerful script commands. This article discusses the process of using CodeViser to debug the RK3399 multi-core chip from Rockchip, using the Huaqing FS3399 development board.
The CPU of the RK3399 adopts the big.LITTLE architecture, featuring dual Cortex-A72 big cores and four Cortex-A53 small cores, which significantly optimizes integer, floating-point, and memory operations, achieving revolutionary improvements in overall performance, power consumption, and core area.
01
Serial Port Settings
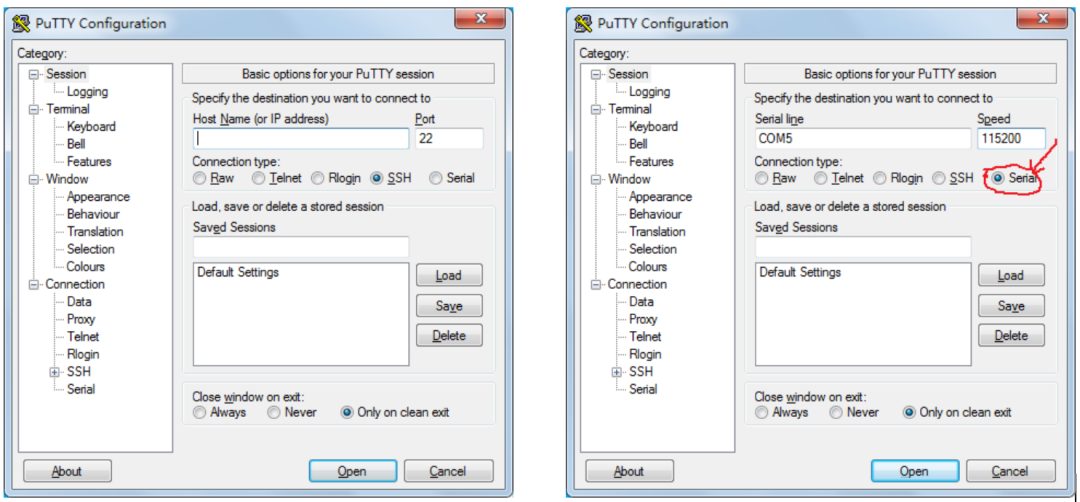
1. Open the Putty serial tool, select Serial under Connection Type on the right, and enter COM5 in the Serial Line box (COM5 is for my machine; check your own PC’s device manager for your serial port). Enter the baud rate of 115200 in the Speed box next to it.
2. Select Serial at the bottom of the left Category, and change Flow Control on the right to None.
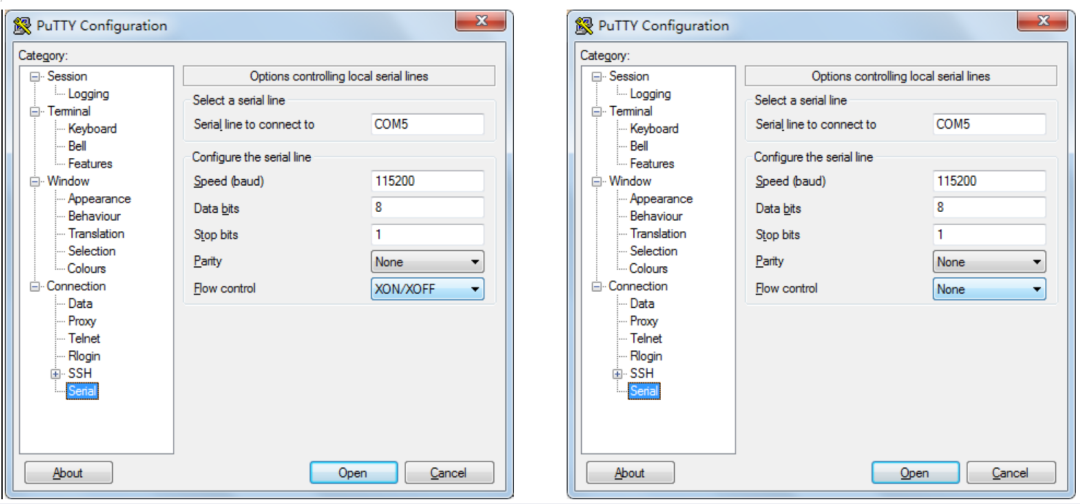
3. Click the Open button below to open the serial port.
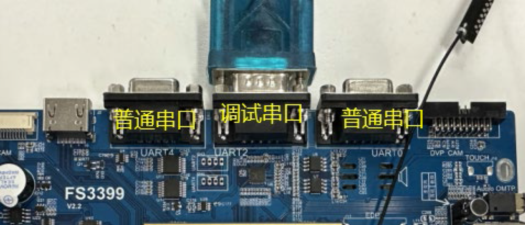
Note: The serial cable must be connected to the UART2 on the RK3399 board.
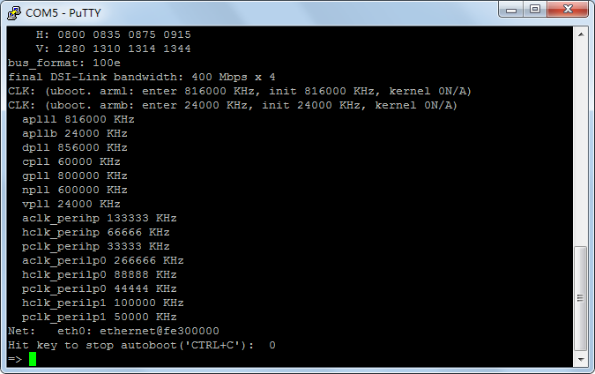
4. Power on the board, then press Ctrl-C in the serial port to stop the program in the boot loop. As shown below:
02
CVD64 Settings and Debugging
1. Connect the CVD64 emulator USB cable to the PC, and connect the CVD64 JTAG/SWD adapter board to the JTAG port on the RK3399 board.
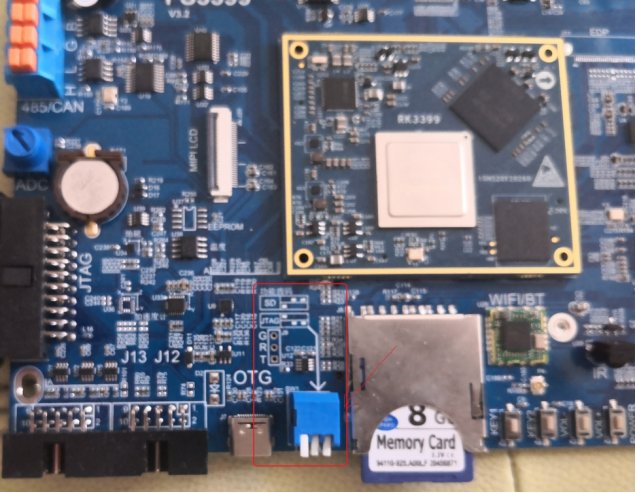
2. According to the prompts on the board, set the DIP switches next to the board’s slot to select JTAG (1 on, 2 off, 3 off) or SWD (1 off, 2 on, 3 on) debugging mode.
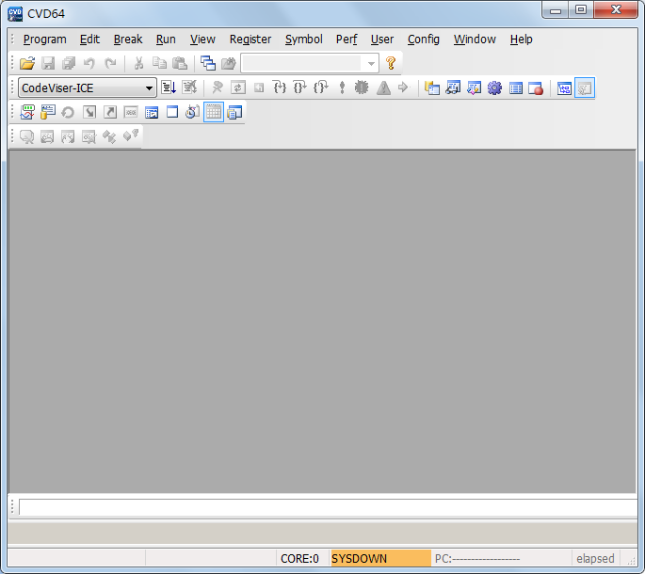
3. Open the CVD64 software,
4. Set the CodeBase address and CTI Base address for debugging in Coresight,
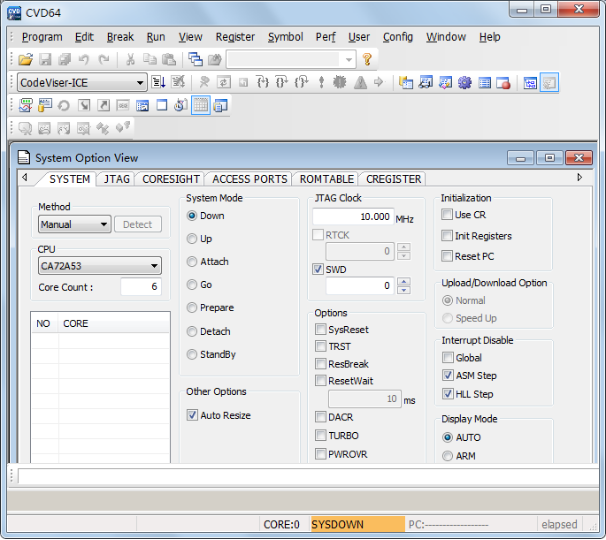
Select Config->Interface from the menu, then set Method to manual, CPU to A72A53, and core to 6; I first selected the SWD debugging method.
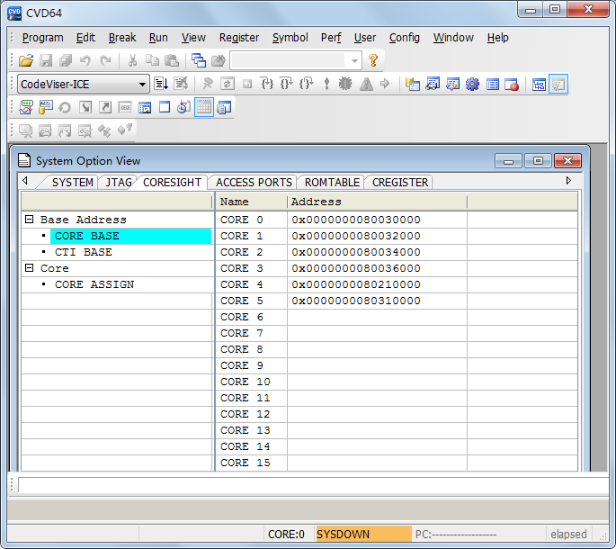
Then, select the Coresight tab and set Base Address->Code Base
The addresses for A53 Core0, Core1, Core2, and Core3 are 0x0000000080030000, 0x0000000080032000, 0x0000000080034000, and 0x0000000080036000.
The addresses for A72 Core4 and Core5 are 0x0000000080210000 and 0x0000000080310000
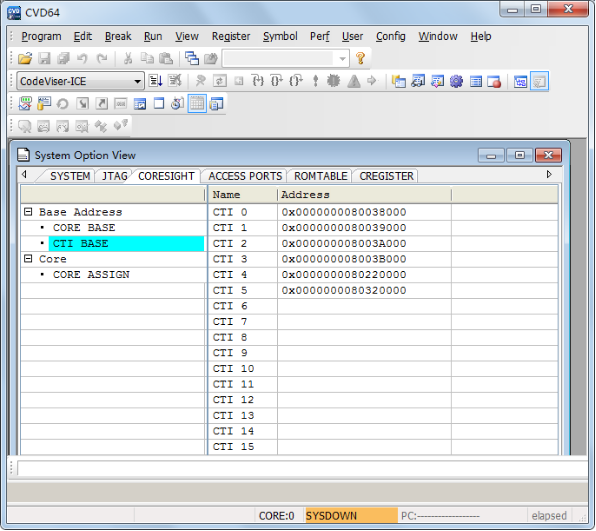
Next, select the Coresight tab and set Base Address->Cti Base
The addresses for A53 Core0, Core1, Core2, and Core3 are 0x0000000080038000, 0x0000000080039000, 0x000000008003A000, and 0x000000008003B000.
The addresses for A72 Core4 and Core5 are 0x0000000080220000 and 0x0000000080320000
03
SWD Debugging
1. Press System->System Mode-> Up, the system enters Debug mode, and basic debugging can be performed.
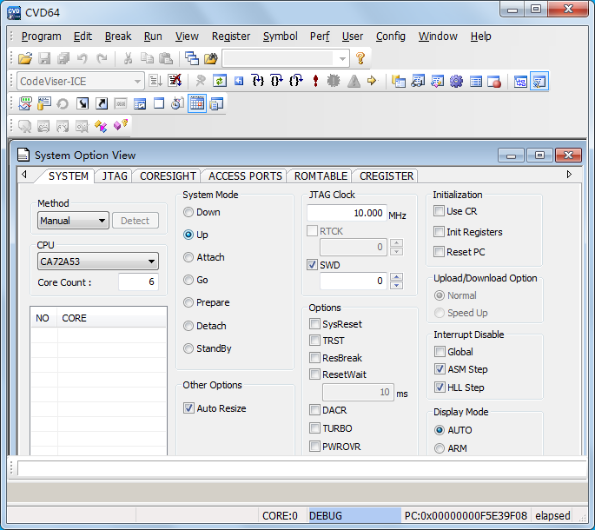
2. Click the yellow arrow icon on the toolbar to display the debugging window,
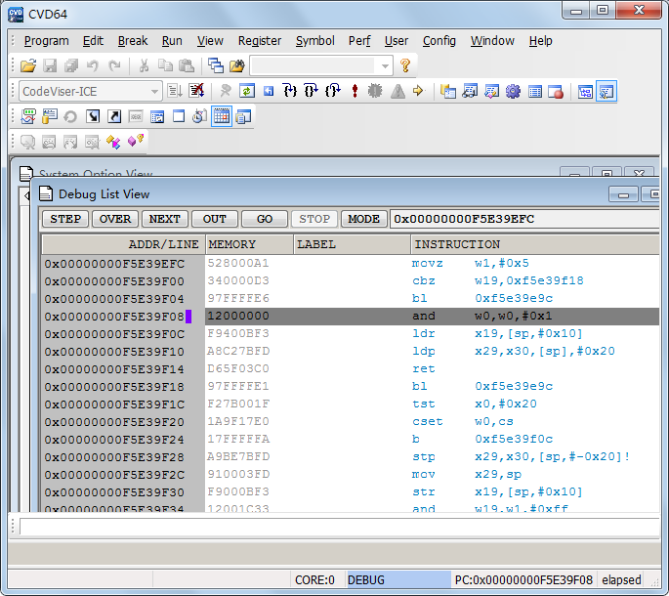
Then click the STEP or OVER button in the Debug List View or the Step in or Step Over button on the toolbar to perform single-step debugging,
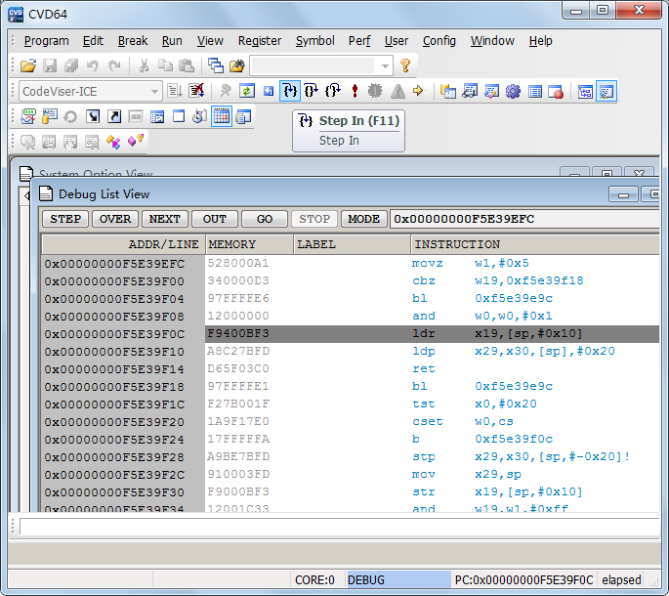
Open the register window, and you can see the registers that change during debugging are highlighted,
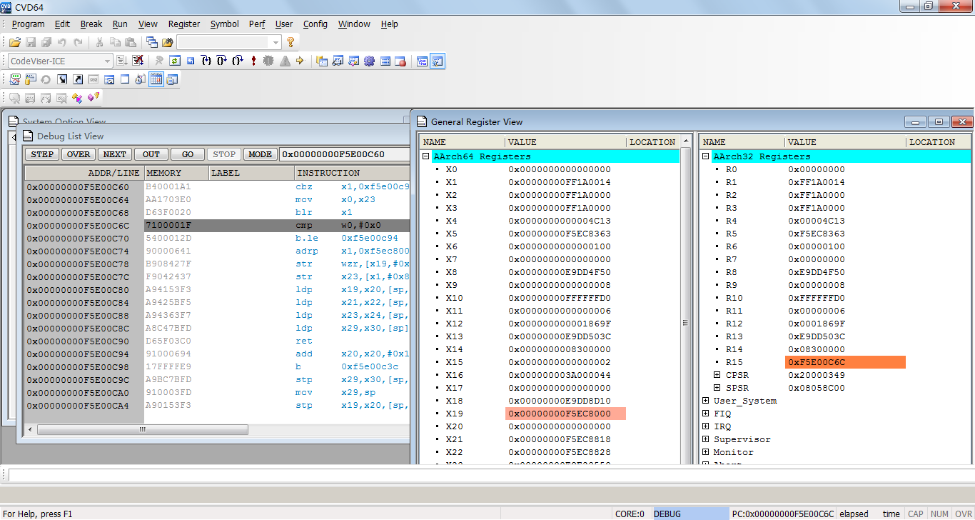
Note: I tried setting the DIP switch to JTAG mode, but debugging could not be performed.
To Be Continued!
Part Two: Linux Kernel Debugging and Multi-Core Debugging Content
Will be released next Tuesday, stay tuned!
Feel free to follow our WeChat public account 【Miketech】, reply “Join Group” to join the technical discussion group.
Product Consultation:
Beijing: 010-62975900
Shanghai: 021-62127690
Shenzhen: 0755-82977971

Share, view, and like, at least I want to have one!