Hello everyone, I am Pi Zi Heng, a serious technical guy. Today, I will introduce the debugging principles of the NXP i.MX RTyyyy series EVK with serial NOR Flash.
This article is the sequel to the second part of the i.MXRT hardware series. In the first episode of the second part, I introduced the usage of the onboard debugger on the EVK board in detail. With the debugger in hand, debugging is no longer a worry. Generally, debugging can be divided into SRAM debugging and Flash debugging based on the type of target memory where the debugging code resides. SRAM debugging is relatively simple, as the program can be directly loaded into RAM via the JTAG/SWD interface; however, Flash debugging is a bit more complex, as it requires a Flash download algorithm to be able to debug after a successful download. Typically, Cortex-M core MCUs are embedded with parallel NOR Flash, which is directly connected to the high-performance AHB bus of the Cortex-M core. If a well-known IDE supports this MCU, it usually integrates the corresponding Flash download algorithm, allowing users to download code into Flash and perform XIP debugging directly in the IDE. However, the i.MXRT does not have built-in Flash; users need to connect an external Flash. So what should we do? Can we still perform online XIP debugging? Don’t worry, the i.MXRT supports external parallel NOR and serial NOR for XIP. From the perspective of saving pin count, the most common practice is to connect the serial NOR Flash to the i.MXRT FlexSPI bus. FlexSPI supports XIP features, so online debugging can be achieved in principle. Today, I will introduce the principles of debugging external serial Flash on the i.MXRT:
1. ARM CoreSight Debug Architecture
To achieve debugging in serial Flash, we must first be able to debug the core. The i.MXRT chip is based on the Cortex-M core, and debugging and tracing of the Cortex core cannot be separated from CoreSight, a new debugging architecture launched by ARM in 2004, which is also part of the core licensing. CoreSight is very powerful, containing many debugging components (various protocols). The following figure is taken from the CoreSight technology overview manual, showing the relationships between various debugging components under the CoreSight architecture. With so many components, it can be a bit overwhelming at first glance. If we group these components by function, they can be divided into three categories:
Source Components:These are the sources of trace data on the chip, generating trace data sent to the ATB (AMBA Trace Bus). For example, STM and ETM belong to the Source category.
Control Access Components (Sink):These configure and control the generation of data flow but do not generate data flow themselves; these modules can retain data coming from the Source. For example, DAP and ECT (including CTI and CTM) belong to the Sink category.
Link Components:These are the endpoints of trace data on the chip, serving as channels guiding the process from Source to Sink. For example, TPIU, ETB, and SWO belong to the Link category.
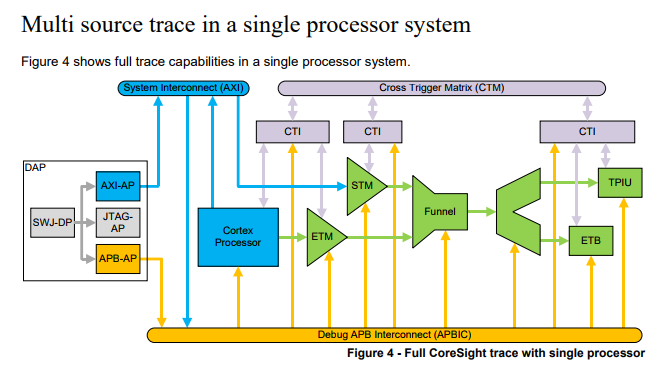
This article mainly provides an overview of the principles of external serial Flash debugging on the i.MXRT and does not intend to delve deeply into CoreSight. Therefore, we only need to know that it performs the main debugging tasks, and CoreSight’s only dependency is to ensure real-time access to system memory and peripheral registers (including code in the external serial Flash) through the DAP component from the AMBA bus.
2. i.MXRT FlexSPI Peripheral Features
To achieve debugging in serial Flash, the code must be able to execute in place (XIP) from the serial Flash, meaning the CPU must be able to fetch instructions and data from any position in the serial Flash in real-time. The serial Flash referred to in this article generally refers to SPI interface NOR Flash, which can operate in Single/Dual/Quad/Octal SPI modes. Regardless of the SPI mode, this type of Flash interface is essentially serial Flash, where the address and data lines are shared and serial. According to common understanding, to achieve XIP, the Flash should be connected via a parallel bus interface to the AMBA, which should have independent address and data lines, with the width of the address lines corresponding to the size of the Flash. So how can serial Flash achieve XIP on the i.MXRT? The answer lies in the FlexSPI peripheral. Let’s open the RT1050 reference manual and find the chapter on the FlexSPI peripheral, where we can see the following FlexSPI module block diagram. The right side of the diagram shows the signal connections between FlexSPI and the external serial Flash, while the left side shows the connection between FlexSPI and the internal bus of the i.MXRT system. The bus connection is divided into two types: 32-bit IPS BUS (manually operating FlexSPI registers to send Flash read/write commands) and 64-bit AHB BUS (FlexSPI translates AHB access addresses and automatically sends the corresponding Flash read/write commands). The secret to the serial Flash being able to XIP lies in the AHB BUS connection of the FlexSPI peripheral.
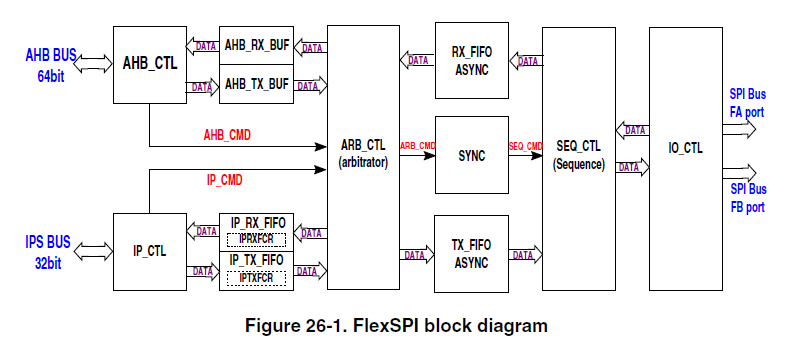
Regarding this 64-bit AHB BUS connection, we can find more details in the FlexSPI features under the Memory mapped read/write access by AHB Bus section. The i.MXRT allocates AHB access address mapping for the FlexSPI peripheral in system memory (mainly for read access in XIP debugging). When the CPU fetches instructions from the FlexSPI AHB address mapping space, the FlexSPI peripheral automatically completes the task of reading instruction data from the external serial Flash and stores the instruction data in the AHB RX buffer (a total of 8). The CPU directly retrieves instructions from the AHB RX buffer for execution, effectively reducing read latency.
AHB RX Buffer implemented to reduce read latency. Total AHB RX Buffer size: 128 x 64 Bits
16 AHB masters supported with priority for read access
8 flexible and configurable buffers in AHB RX Buffer
AHB TX Buffer implemented to buffer all write data from one AHB burst. AHB TX Buffer size: 8 x 64 Bits
All AHB masters share this AHB TX Buffer. No AHB master number limitation for Write Access.
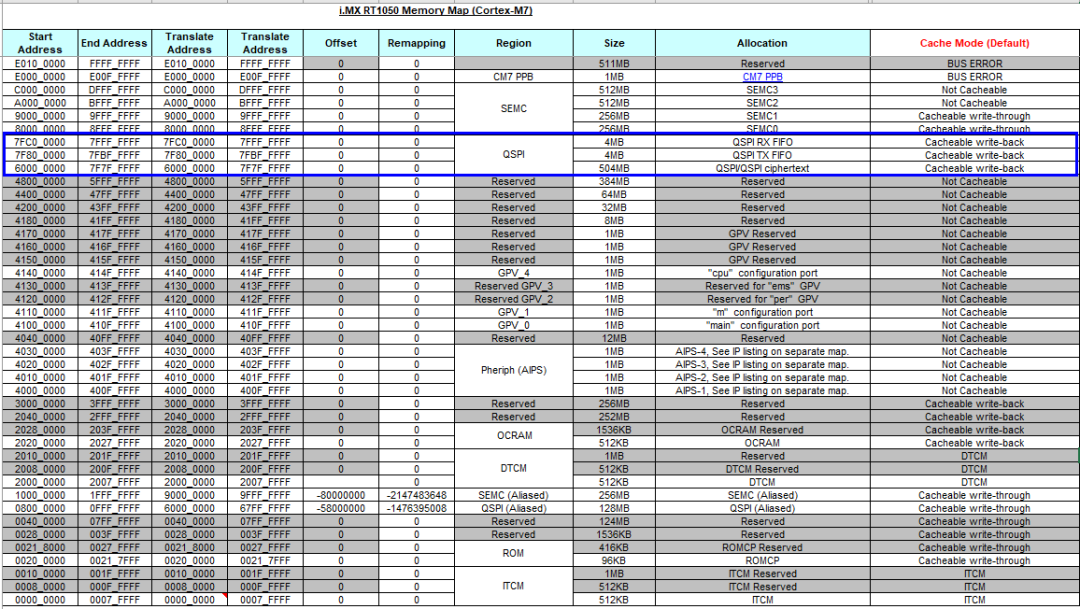
Regarding the FlexSPI AHB address mapping, see the RT1050 memory map table below. The starting address for AHB mapping is 0x60000000, supporting a maximum space of 504MB (applicable to RT1010/RT1020/RT1050/RT1060). If it’s RT1064, the starting address for AHB mapping changes to 0x70000000; if it’s RT1170, in addition to the 0x60000000 mapping address, a new mapping address of 0x30000000 is added. The read access characteristics of the FlexSPI AHB mapping address include:
Cachable and Non-Cachable access
Prefetch Enable/Disable
Burst size: 8/16/32/64 bits
All burst type: SINGLE/INCR/WRAP4/INCR4/WRAP8/INCR8/WRAP16/INCR16
3. Serial NOR Flash Download Algorithm
To achieve debugging in serial Flash, we must ensure that the code is successfully downloaded to the serial Flash. The read/write operations for serial Flash are not as simple as accessing RAM; they require a dedicated FlexSPI NOR Flash driver, known as a Flash download algorithm. There are many types of serial Flash, and while most conform to the JESD216 standard, there are still subtle differences depending on the manufacturer. Some Flash download algorithms strive to support as many Flash types as possible, while others are tailored to specific series of Flash. Regardless of the Flash download algorithm, for chips like the i.MXRT that do not have internal Flash, the Flash download algorithm must be associated with the specific i.MXRT development board, as the development board determines the pinmux of the Flash connection, and the FlexSPI pin initialization in the Flash download algorithm must match the development board. Each IDE’s Flash download algorithm is designed differently; this article will not delve into specific Flash download algorithms, but future articles will provide detailed explanations of the Flash download algorithm designs for common IDEs.
4. Serial Flash Debugging Process
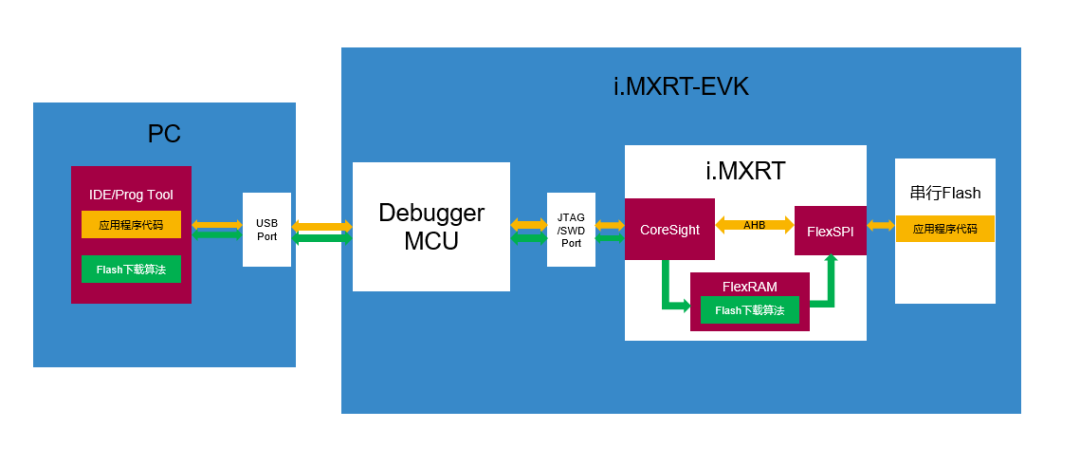
Having introduced the CoreSight architecture, FlexSPI features, and NOR Flash download algorithm, we now have all the necessary conditions for serial Flash debugging. Now, let me give you a comprehensive introduction to the debugging process. Below is a simple diagram I specifically drew; actually, the debugging process is not complicated. When you start debugging in the IDE, the Flash download algorithm (executable file) pre-stored in the IDE will first be downloaded to the internal FlexRAM of the i.MXRT via the debugger, completing the initialization of the FlexSPI peripheral and downloading the application program (the executable file) into the serial Flash. After the application program is downloaded, CoreSight takes over the debugging task, and the CPU can access the code in the serial Flash connected to the FlexSPI peripheral via the AHB bus. Thus, CoreSight can perform real-time code execution control and tracing, allowing you to perform step-by-step debugging in the IDE.
Thus, I have completed the introduction to the debugging principles of the NXP i.MX RTyyyy series EVK with serial NOR Flash. Where are the applause~~~