Linux | Red Hat Certified | IT Technology | Operations Engineer
👇 Join the technical exchange QQ group with 1000 members, remark 【Official Account】 for faster approval

Common Usage
Start: gdb File
Exit: ctrl + d or quit debugging command
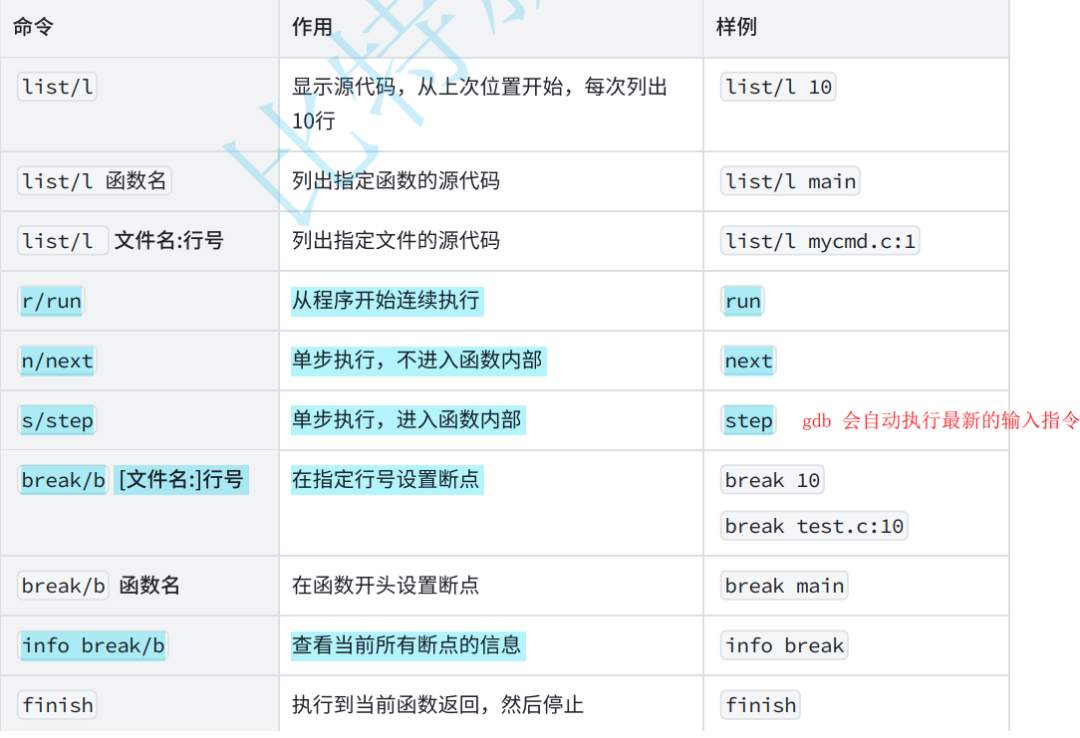
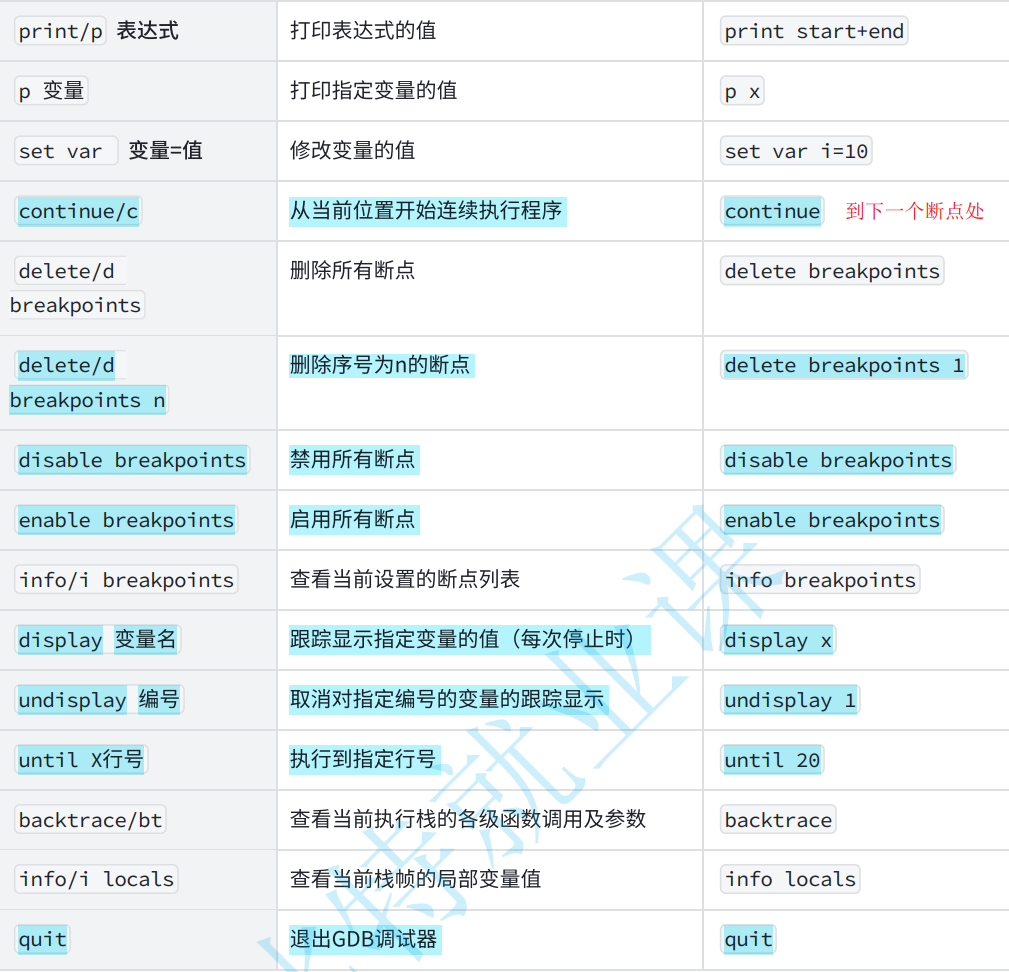
These are the two files you need to use. Execute to generate the myexe file, then use gdb to debug.
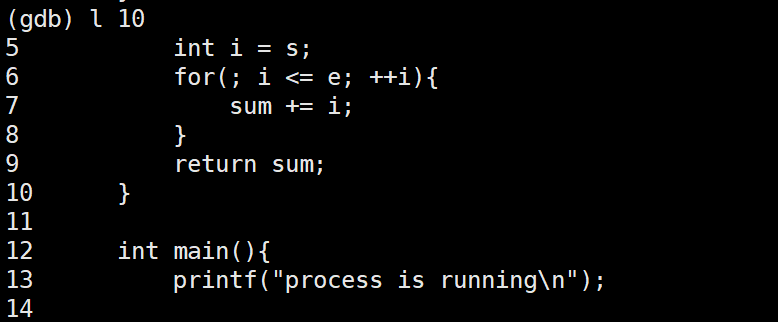
[wzy@VM-20-5-centos lesson11]$ cat code.c#include <stdio.h>int Sum(int s, int e){ int sum = 0; int i = s; for(; i <= e; ++i){ sum += i; } return sum;}int main(){ printf("process is running\n"); int start = 1; int end = 100; int result = Sum(start, end); printf("process has done, result: %d\n", result);}[wzy@VM-20-5-centos lesson11]$ cat Makefilemyexe:code.cgcc -o $@ $^ -g.PHONY:cleanclean:rm -f myexe[wzy@VM-20-5-centos lesson11]$ ll total 20-rw-rw-r-- 1 wzy wzy 324 Jan 17 15:54 code.c-rw-rw-r-- 1 wzy wzy 64 Jan 17 16:02 Makefile-rwxrwxr-x 1 wzy wzy 9688 Jan 17 16:02 myexel + number: View the 10 lines above and below the line you want to find in the current file.
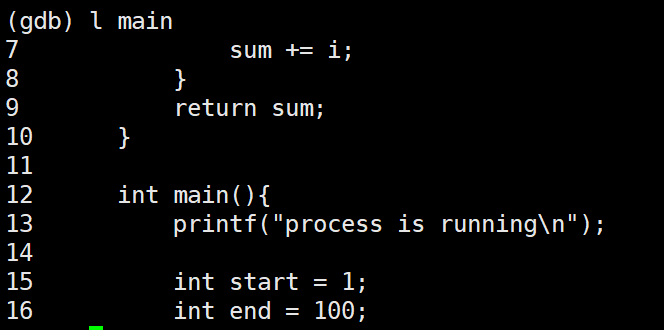
l + character: Same effect as above.
Enter: gdb will record the most recent command, pressing enter will continue execution.
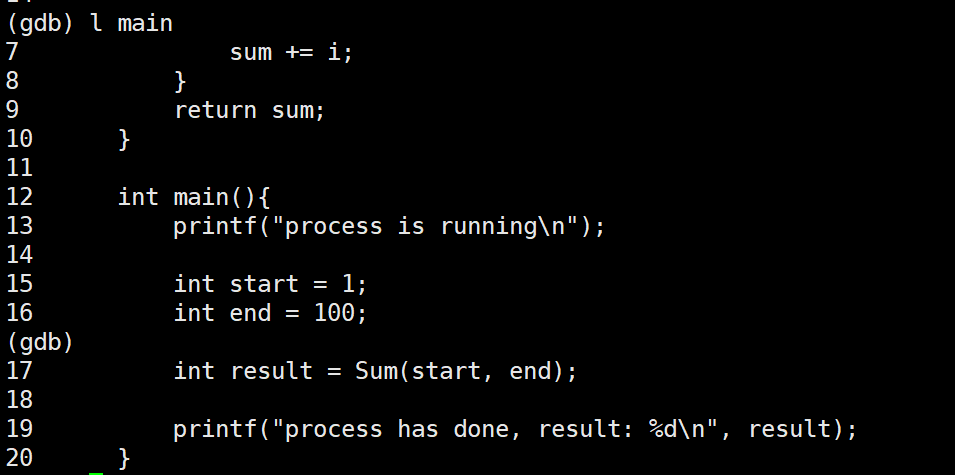
b + number: Add a breakpoint at the specified line; if the current line has no data, it will prompt.
info b: Show what breakpoints are currently set.
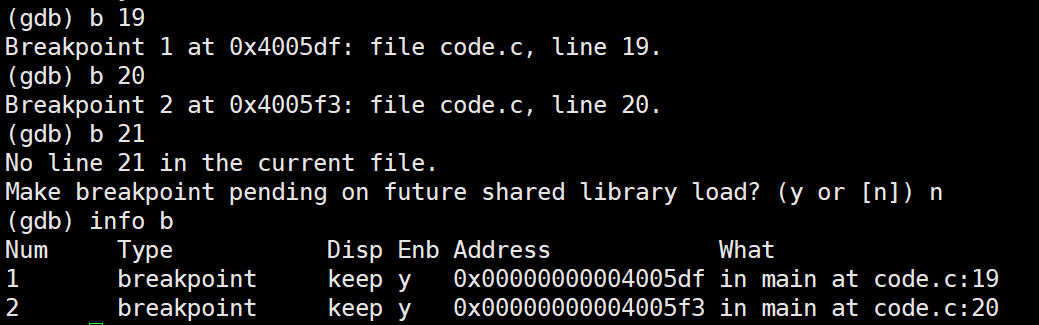
d + number: Delete the specified breakpoint number.

Common Tricks – cgdb
First, you need to install cgdb – sudo tum install -y cgdb.
The usage of cgdb is similar to gdb, but it has a visual interface that allows you to observe the code while debugging.
cgdb myexe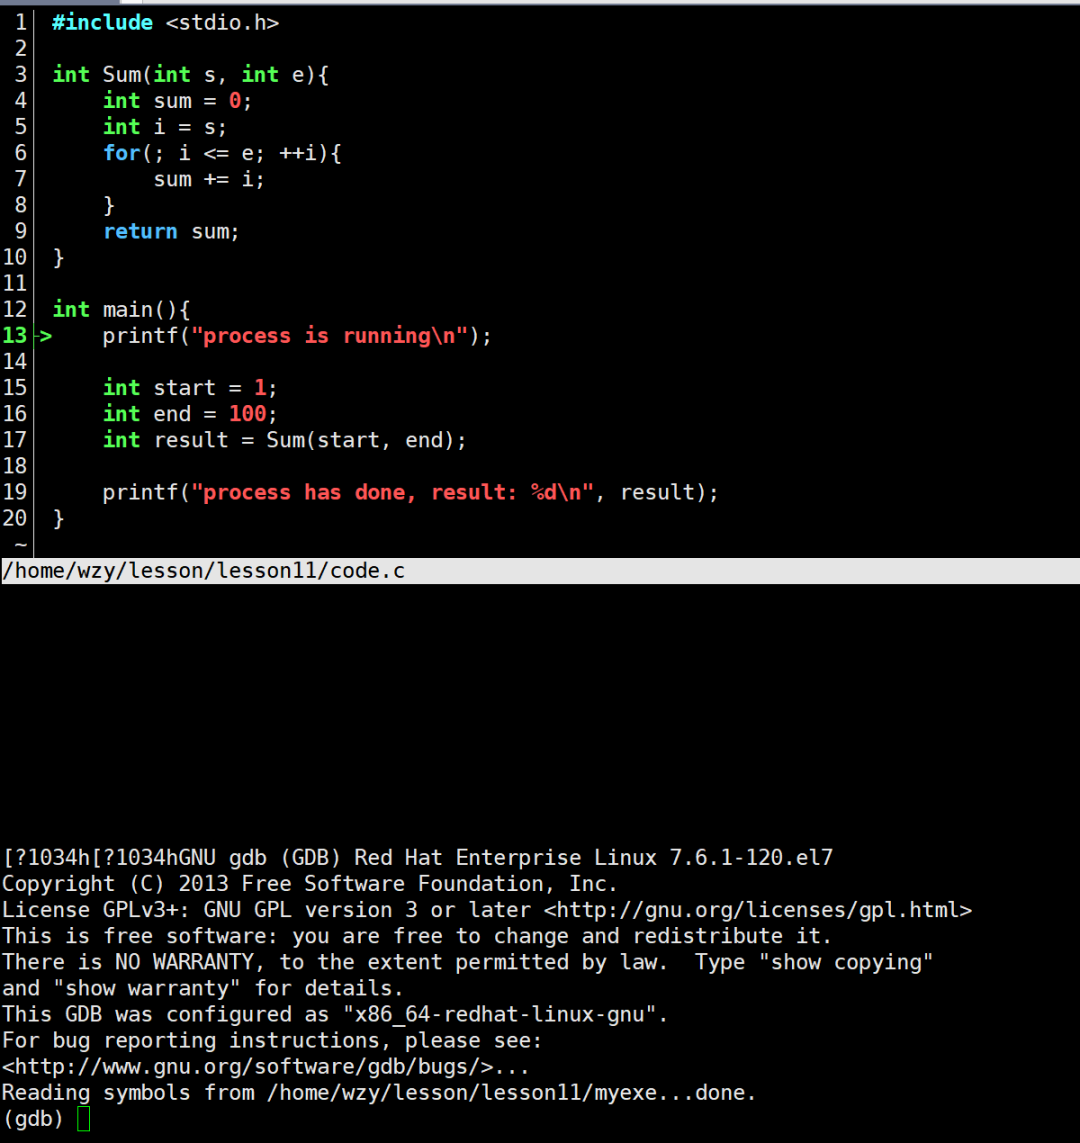
For course inquiries, add: HCIE666CCIE
↓ Or scan the QR code below ↓

What technical points and content do you want to see?
You can leave a message below to let us know!