From WeChat Official Account: IOT Internet of Things Town
Author: Dao Ge, a veteran with over 10 years of embedded development experience, focusing on: C/C++, Embedded, Linux.
Table of Contents
-
Example Code with Bug
-
GDB Debugging Operations
-
CGDB Debugging Operations
Others’ experiences, our ladder!
CGDB is a <span>frontend</span> for <span>GDB</span>, designed to debug code in a graphical form within the terminal window (based on <span>ncurse</span>), making it very convenient. Compared to <span>GDB</span>, it can greatly improve efficiency.
This article will share the most basic usage of <span>CGDB</span>. If this is your first time hearing about it, I highly recommend you to give it a try; you will definitely love it!
Example Code with Bug
#include <unistd.h>
#include <stdlib.h>
#include <stdio.h>
#include <string.h>
#include <assert.h>

typedef struct USER_DATA{
	char data[32];
	unsigned short data_len;
	unsigned int flag;
}__attribute((packed));

const unsigned char *	g_data =  "hello";

/*
Function: Load a piece of data
Parameter 1:  data[OUT]: Buffer where data is loaded
Parameter 2:  len [OUT]: Actual length of loaded data
Return value: 0-success, else-failure
*/
static int get_data(unsigned char *data, unsigned int *len)
{
	assert(data && len);
	memcpy((void *)data, (void *)g_data, strlen(g_data));
	*len = strlen(g_data);
	return 0;
}

int main(int argc, char *argv[])
{
    // Create structure variable
	struct USER_DATA user_data;
	user_data.flag = 0xA5;

	// Load data into structure variable
	if (0 == get_data(user_data.data, &user_data.data_len))
	{
		printf("get_data ok! \n");
		printf("data_len = %d, data = %s \n", user_data.data_len, user_data.data);
		printf("user_data.flag = 0x%x \n", user_data.flag);  // Expected value: 0xA5
	}
	else
	{
		printf("get_data failed! \n");
	}
	return 0;
}
Before compiling, take a look at the code. Can you spot the <span>bug</span> in it?
Of course, during compilation, the compiler gives a warning about the risk. Since the example code is simple, it’s easy to spot.
However, in a project, if you don’t like to eliminate compilation <span>Warning</span> messages, this <span>bug</span> can be quite hidden.
Compile the test code:<span>gcc -g test.c -o test</span>
Since you need to use <span>GDB</span> for debugging, don’t forget to add the <span>-g</span> option.
GDB Debugging Operations
$ gdb ./test
(gdb) r   // Execute once at full speed
(gdb) r
Starting program: /home/captain/demos_2022/cgdb/test
test start...
get_data ok!
data_len = 5, data = hello
user_data.flag = 0x0
[Inferior 1 (process 9933) exited normally]
Noticed that the value of <span>user_data.flag</span> is incorrect, so I decided to set a breakpoint on the line before calling <span>get_data</span> and execute from the start:
Check the line number in the code:
(gdb) l main
18		*len = strlen(g_data);
19		return 0;
20	}
21
22	int main(int argc, char *argv[])
23	{
24		struct USER_DATA user_data;
25		user_data.flag = 0xA5;
26		if (0 == get_data(user_data.data, &user_data.data_len))
27		{
Set a breakpoint at 25:
(gdb) b 25
Breakpoint 1 at 0x400771: file test.c, line 25.
Start running:
(gdb) r
Starting program: /home/captain/demos_2022/cgdb/test

Breakpoint 1, main (argc=1, argv=0x7fffffffdc58) at test.c:25
25		user_data.flag = 0xA5;
At the breakpoint, the assignment statement has not been executed yet, so I step through once:
(gdb) step
26		if (0 == get_data(user_data.data, &user_data.data_len))
Now, print the value and address of the variable <span>user_data.flag</span>:
Since we will enter the called function later, this variable will become invisible, so we need to print it by address.
(gdb) print &user_data.flag
$1 = (unsigned int *) 0x7fffffffdb62
(gdb) print/x user_data.flag
$2 = 0xa5
At this point, the assignment is correct. Continue executing and enter the called function <span>get_data()</span>:
(gdb) step
get_data (data=0x7fffffffdb40 "n\333\377\377\377\177", len=0x7fffffffdb60) at test.c:16
16		assert(data && len);
This function has a total of <span>4</span> lines of code. We will step through each line and print the <span>user_data.flag</span> variable’s content.
Step through to the line with <span>memcpy</span> and check if the content at <span>user_data.flag</span> address is still:<span>0xa5</span>:
(gdb) step
17		memcpy((void *)data, (void *)g_data, strlen(g_data));
(gdb) print/x *0x7fffffffdb62
$3 = 0xa5
Continue stepping (since we don’t need to follow the internals of <span>memcpy</span> and <span>strlen</span>, use the <span>next</span> command) and print:
(gdb) next
18		*len = strlen(g_data);     // This line is about to be executed
(gdb) print/x *0x7fffffffdb62
$4 = 0xa5
(gdb) next
19		return 0;
(gdb) print/x *0x7fffffffdb62
$5 = 0x0
Found the problem: after executing *len = strlen(g_data), the content of the variable user_data.flag at the address has changed.
Check the code carefully, and you can diagnose that the data type used was incorrect.
Solution to the bug: The last parameter of the <span>get_data()</span> function should be a pointer of type <span>unsigned short</span> instead.
The problem is solved, but looking back at the debugging process with <span>gdb</span>, it is still quite cumbersome: debugging commands and code displays mixed together, requiring many commands to be typed.
CGDB Debugging Operations
After starting <span>CGDB</span>, the terminal window is divided into two parts: the upper part is the code window, and the lower part is the debugging window.
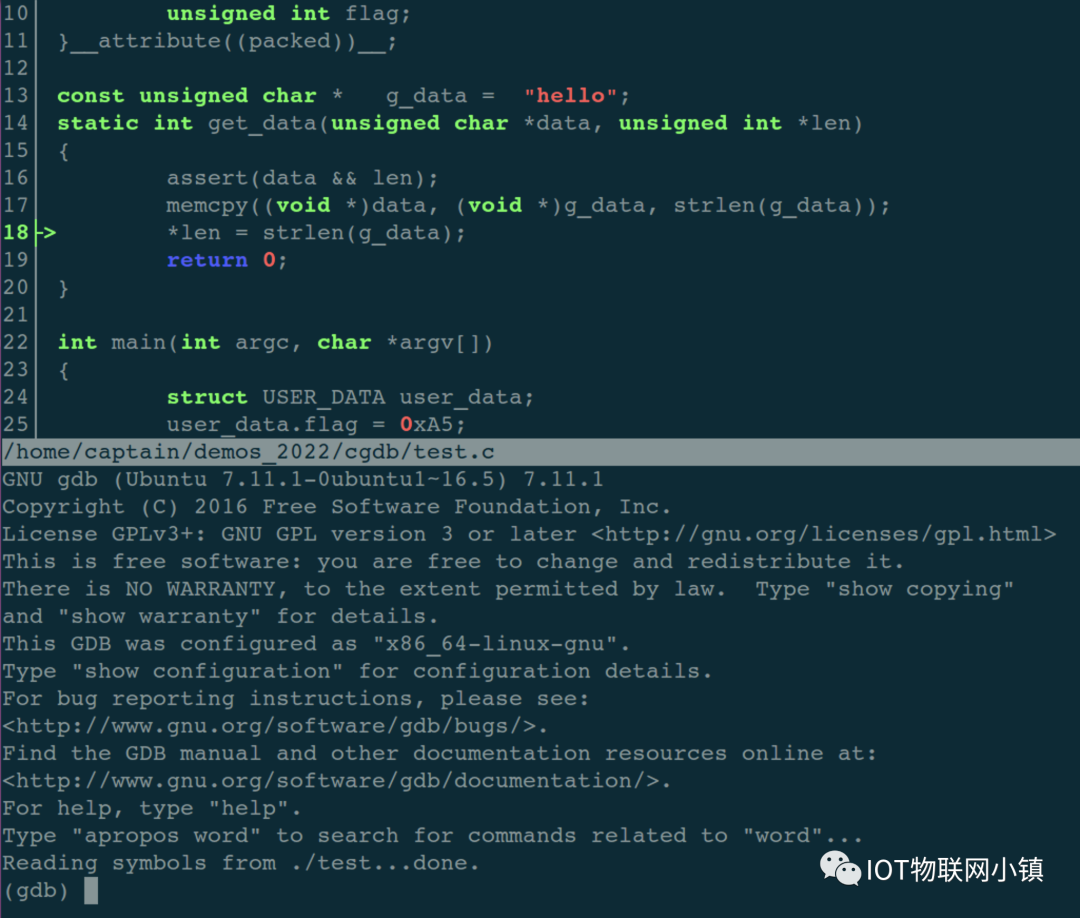
Press the <span>ESC</span> key to enter the code window, where you can browse the code up and down and perform a series of operations:
Space key: Set or remove a breakpoint;
o: View the file where the code is located;
/ or ?: Search for strings in the code;
…
There are also many convenient shortcut keys:
-: Shrink the code window;
+: Expand the code window;
gg: Move the cursor to the beginning of the file;
GG: Move the cursor to the end of the file;
ctrl + b: Scroll the code up one page;
ctrl + u: Scroll the code up half a page;
ctrl + f: Scroll the code down one page;
ctrl + d: Scroll the code down half a page;
Press the <span>i</span> key to return to the debugging window and enter debugging mode, where the debugging commands are almost the same as <span>GDB</span>!
That is to say: you can perform debugging operations while viewing the code in real time, greatly improving efficiency.
Let’s go through the debugging process of <span>GDB</span> again:
Press the <span>ESC</span> key to enter the code window. If the line numbers in front of the code are white, it indicates the current line.
Press the <span>j</span> key to move the highlighted current line down. When moving to line <span>25</span>, as shown below:
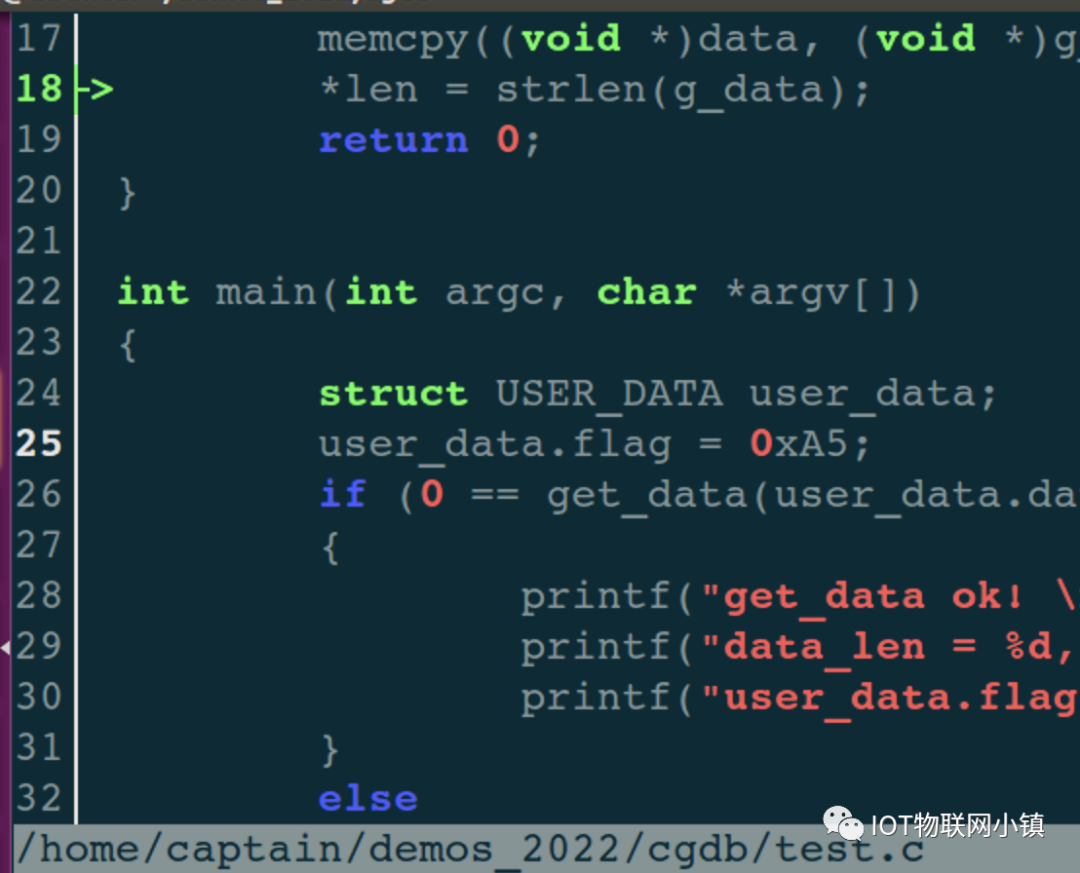
Press the space key to set a breakpoint on this line, at which point the line number turns red:
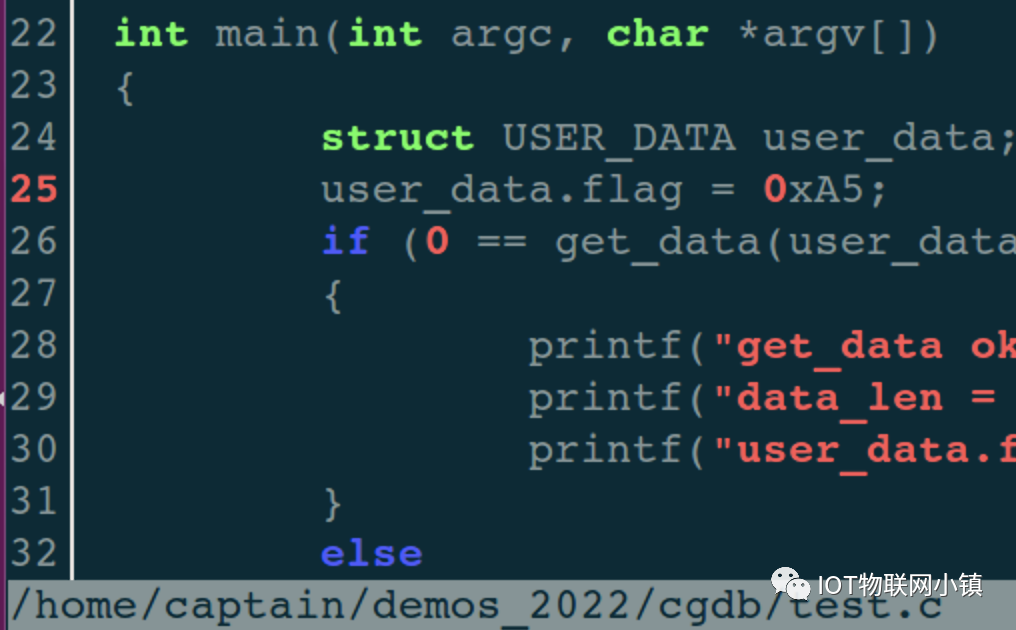
And the debugging window prints a line of information:
(gdb)
Breakpoint 1 at 0x400771: file test.c, line 25.
Press the <span>i</span> key to return to the debugging operation window, then enter the run command <span>r</span>, and it will stop at line <span>25</span>, as indicated by the green arrow below:
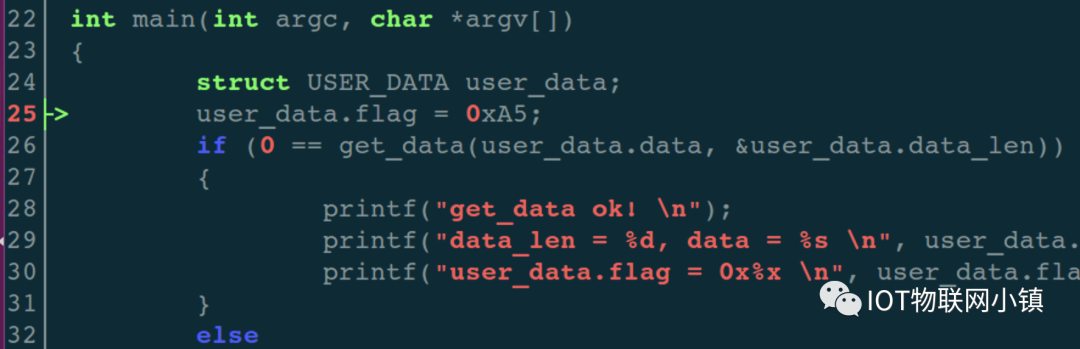
Of course, the debugging window will also print relevant information:
(gdb) r
Starting program: /home/captain/demos_2022/cgdb/test

Breakpoint 1, main (argc=1, argv=0x7fffffffdc58) at test.c:25
Step through this assignment statement, then print the value and address of <span>user_data.flag</span>:
(gdb) print/x user_data.flag
1: /x user_data.flag = 0xa5
(gdb) print &user_data.flag
2: &user_data.flag = (unsigned int *) 0x7fffffffdb62
At this point, the assignment statement executed correctly, and the printed value is also as expected.
Then execute the step command to enter the function <span>get_data()</span>:
(gdb) step
get_data (data=0x7fffffffdb40 "n\333\377\377\377\177", len=0x7fffffffdb60) at test.c:16
At this point, the code window above automatically enters the relevant code of <span>get_data()</span>, as shown below:
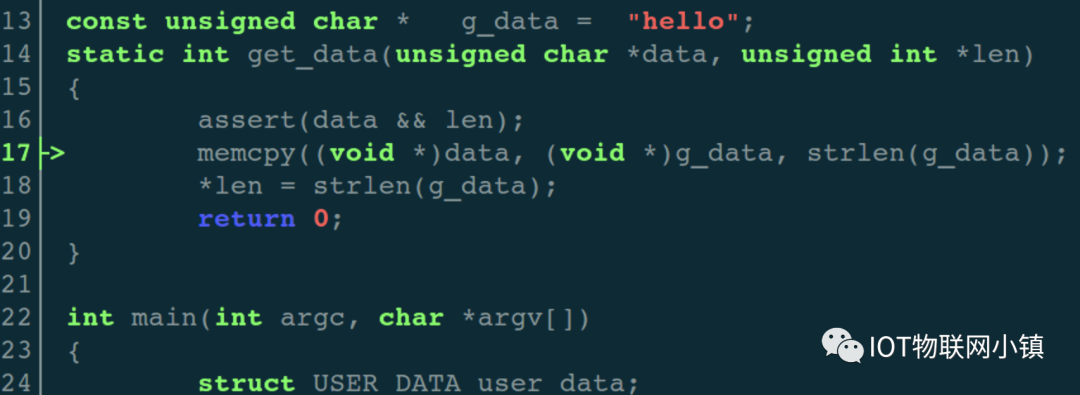
Continue stepping, before executing the assignment statement <span>*len = strlen(g_data);</span>, print the content of the variable <span>user_data.flag</span> at the address:
(gdb) print/x *0x7fffffffdb62
$2 = 0xa5
Correct! Then after executing the assignment statement, print again:
(gdb) next
(gdb) print/x *0x7fffffffdb62
$3 = 0x0
Found the problem: after executing *len = strlen(g_data), the content of the variable user_data.flag at the address has changed.
Summary:
<span>CGDB</span> operation process, although I wrote it quite verbose, but in actual use, it is really very smooth, just like chocolate!
Recommended↓↓↓