Introduction: DAC is at the most significant bifurcation since its inception.
Over the past decade, DAC (Direct Air Capture) has been given excessive expectations: from the IPCC scenario models to the “negative emissions foundation” in carbon neutrality strategies, and to the massive subsidies from various governments, DAC is seen as a “million-ton infrastructure industry” capable of global expansion.
However, the real situation in 2024–2025 reveals a harsh reality:
The cost of DAC is declining at a pace that cannot keep up with capital and policy expectations, while the large-scale model is hitting systemic bottlenecks.
Meanwhile, electrochemical CO₂ conversion technologies (CO₂RR, PEEC, solid oxide CO₂ electrolysis, methanol electro-synthesis, etc.) are advancing rapidly. The intersection of these two technological curves is forming a new industrial vacuum zone:
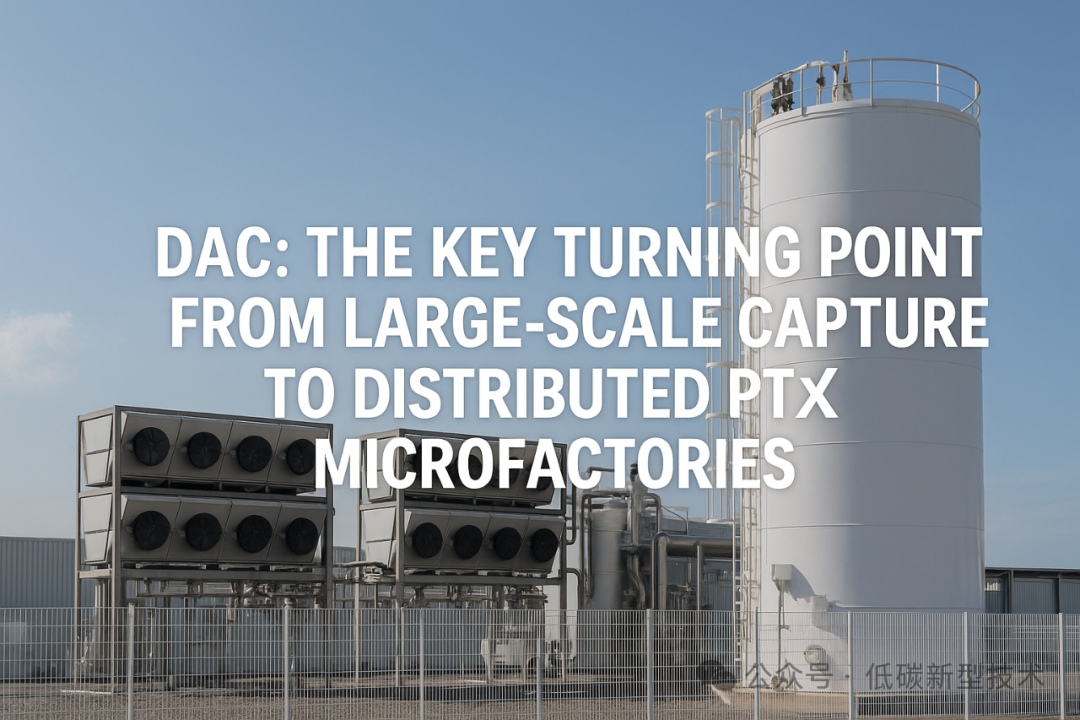
DAC is no longer environmental engineering but is becoming the entry module for distributed PtX (Power-to-X) microfactories.
This change is not a simple phenomenon of “scaling down” but a reversal of the underlying logic of the entire industry: from “removing CO₂ from the air to be processed at large plants” to “integrating capture units into the energy system itself.”
The role of DAC is beginning to shift from:
-
Capturing carbon →
-
Providing carbon sources →
-
Embedding into energy systems →
-
Serving distributed fuel production
-
Ultimately becoming the carbon source interface for microgrids and PtX
This is the energy engineering turning point to watch from 2025 to 2030, and it is also the most easily overlooked.
Part One: The “Large-Scale Logic” of DAC is Coming to an End
1. DAC in the Past Decade: A Typical “Big Engineering Mindset”
The initial logic of DAC comes from the economies of scale in the traditional chemical industry: as long as the adsorbent materials are mass-produced and the wind walls/fans are made larger, facilities capable of processing 10,000 tons/year or 100,000 tons/year can dilute costs.
This line of thought corresponds to three premises:
-
The performance of adsorbent materials remains unchanged or improves with scale
-
Energy consumption decreases with scale
-
CO₂ transportation and utilization are sufficiently convenient
But the reality is:
-
Materials do not improve with scale
-
Thermodynamic energy consumption cannot be reduced by scale
-
CO₂ utilization usually occurs elsewhere and requires transportation
-
The larger the facility, the higher the redundancy of equipment and the greater the system complexity
Conclusion:
DAC is not like oil refining, ammonia plants, or carbon capture units. It lacks the physical basis for economies of scale.
2. Material Bottlenecks: Adsorption Energy Consumption and Regeneration Trajectories are Not Affected by Scale
Whether it is the solid-phase route (PEI, AMP, metal-organic frameworks MOF) or the liquid-phase route (KOH—CaCO₃ cycle, amine liquid absorbents), its energy consumption is mainly determined by two levels:
(1) Fixed Adsorption Enthalpy: Determined by Material, Not Scale
The nucleophilicity, amino density, and pore structure of the material determine:
-
Adsorption equilibrium
-
Reaction pathways
-
Desorption energy requirements
These physical properties do not improve by “scaling up the factory”.
(2) Desorption Energy Barrier Cannot Disappear with Scale
The maximum energy consumption of DAC occurs during the transition from “air → adsorbed CO₂ → desorbed CO₂”, especially in temperature-swing adsorption (TSA) systems:
-
Desorption energy consumption at 85–120℃ is fixed at 2–4 GJ/t
-
Condensation/drying energy consumption cannot be smoothed out by scale
Therefore:
DAC does not have thermodynamic scale effects. It is not a system that “saves more as it gets bigger” but rather a “fixed energy consumption, rigid cost” system.
3. Real Engineering Counterexamples: Larger Facilities are More Fragile
For example, several large DAC facilities in Northern Europe and North America show:
-
Humidity changes affect the aging rate of solid-phase adsorbents
-
Temperature differences lead to repeated expansion/contraction, causing mechanical fatigue
-
Rain and snow environments lead to increased moisture content in adsorbents
-
Equipment redundancy (fans, compressors) actually increases OPEX
In other words:
The system boundaries of DAC are more like air treatment equipment than traditional process industries. Its key bottleneck lies in the “mismatch of large engineering essence”.
Part Two: Electrochemical CO₂ Conversion is Rewriting the Scale Logic of DAC
From 2020 to 2025, one of the most underestimated developments in DAC is:
Electrochemical CO₂ conversion technology is comprehensively reshaping the upstream and downstream structure of DAC.
CO₂ electrolyzers are rapidly breaking through:
-
CO₂ → CO (60–80% conversion)
-
CO₂ → Formic acid (40–60% Faradaic efficiency)
-
CO₂ → Syngas (adjust H₂/CO ratio)
-
CO₂ → Methanol (CO₂/H₂ co-electrolysis)
-
CO₂ → CH₄ (multi-stage electrochemistry)
Most importantly:
Electrochemical CO₂ conversion does not require continuous stable large-scale CO₂ input.
It can handle:
-
Small flow rates
-
Intermittent CO₂
-
CO₂ with varying humidity
-
Medium purity (85–95%) CO₂
This is a godsend for DAC.
1. Electrochemical CO₂ Conversion and DAC are Naturally Complementary
Electrochemical CO₂ conversion inherently possesses the following characteristics:
-
Strong power adjustability
-
Can operate intermittently with PV/Wind
-
Single modules can flexibly scale from 0.5–10 kW
-
Instantaneous CO₂ consumption can be adjusted as needed
DAC also has:
-
Fast cold start
-
Can operate in time slots
-
Adsorption decay can be compensated by EMS
-
Load adjustment frequency is much lower than electrolyzers
The dynamic load curves of the two match extremely well.
Large-scale chemical plants do not possess this dynamic.
2. The “Engineering Window” of DAC and Electrolyzers Naturally Align
The typical output of DAC:
-
Flow rate: 1–30 kg/h
-
Purity: 90–99%
-
Temperature: RT–80℃
-
Pressure: atmospheric pressure–1.5 bar
And the typical window for electrolyzers (H₂ / CO₂) of the same scale:
-
Gas source demand: 0.5–30 kg/h
-
Pressure: atmospheric pressure to 2 bar
-
Temperature: 40–80℃
-
Carrier gas (water vapor, small impurities) is tolerable
What does this mean?
DAC itself is the natural front-end interface for electrolyzers, and does not need to be scaled up to match the process window.
3. The Optimal Scale of DAC is Shifting from “Tens of Thousands of Tons” to “Kilograms”
Because electrochemical CO₂ conversion is distributed, the scale of DAC will also become distributed:
No longer
-
100,000 tons/year DAC
-
10,000 tons/year CO₂ capture facilities
But rather
-
20–200 kg/d DAC
-
2–10 kg/h DAC
-
1–5 kW level CO₂ electrolyzers
-
5–50 kW level e-Methanol / e-CH₄ microfactories
You have previously validated in the PEM electrolyzer industry:
Modularization → Cost reduction is much faster than scaling up.
DAC will follow the same path.
Part Three: The Era of PtX Microfactories is Approaching
What is DAC? The past definition was:
A machine that captures CO₂ from the air.
But the new definition from 2025 to 2030 is:
The “carbon source entry” for distributed PtX microfactories.
Why is this change happening?
1. The Essence of PtX is Not “Converting Electricity to Chemical Energy”, but Integrating Dispersed Energy Systems into “Fuel Production Units”
A typical PtX microfactory includes:
-
PV or small wind turbines
-
PEM/AEM electrolyzers (for H₂ production)
-
CO₂ electrolyzers
-
H₂ + CO mixed gas management
-
Small methanol synthesis reactors
-
Or Sabatier methanation reactors
-
Product storage tanks
-
EMS control systems
After integrating DAC, the system forms a closed loop:
Air → DAC → CO₂ → Electrolysis → Synthesis → Storage → Use
This is not a simple addition, but rather:
Re-coupling of energy flows, carbon flows, thermal flows, and information flows.
Compared to large PtX plants, these microfactories have advantages such as:
-
Lower CAPEX thresholds
-
No need for industrial waste gas CO₂
-
Stronger replicability
-
Can be deployed in areas without infrastructure
-
Suitable for end-side energy supply (ports, mining areas, laboratories, industrial parks)
2. Why Will DAC Microfactories Rapidly Spread in the Next 5 Years?
The reasons come from three structural trends:
Trend One: The “Distributed Surplus” of Renewable Energy is Becoming More Common
In Europe, Japan, Australia, Chile, and the UAE, there is a significant occurrence of:
-
Peak electricity prices dropping to 0
-
Daytime PV surplus
-
The grid cannot absorb it
-
Limited industrial load growth
Surplus electricity can only be stored in batteries or wasted, but:
DAC + Electrolysis + PtX can convert excess electricity into tradable molecules (Methanol/CH₄).
Trend Two: Carbon Sources are No Longer Dependent on Industrial Waste Gas
The vast majority of regions globally do not have industrial waste gas available. DAC provides PtX with ubiquitous carbon sources.
Trend Three: Energy Systems are Starting to Shift from “Centralized” to “Modular”
Similar to the process of 5G small base stations replacing large base stations:
-
From centralized power plants → distributed power sources
-
From centralized energy storage → edge storage
-
From centralized electrolysis → modular electrolysis
-
From centralized reactors → miniaturized reaction systems
DAC will inevitably move along this trend.
Part Four: The Three Most Commercially Valuable DAC–PtX Microfactory Models for the Future
Model 1: 5–20 kW Distributed e-Methanol Microfactory (Industrial Scenario)
Structure:
-
3–10 Nm³/h PEM electrolyzers
-
1–3 kg/h DAC units
-
Small methanol synthesis reactors (Cu/ZnO catalyst)
-
25–100 kg/d methanol production
Application Scenarios:
-
Fuel replacement for factory boilers
-
Pre-supply of fuel for ports
-
Small-scale SAF front-end validation
-
Zero-carbon demonstration projects in manufacturing
This is the fastest-growing segment from 2025 to 2027.
Model 2: 1–5 kW Research-Level CO₂ Electrolysis Comprehensive Testing System (Universities/Research Institutes)
Structure:
-
Desktop DAC (0.5–2 kg/d)
-
0.5–2 kW CO₂ electrolyzers
-
Multi-channel gas flow + analysis
-
Optional micro methanol/formic acid reaction module
This is currently the fastest-growing research procurement market globally.
Research Value:
-
Verification of catalysts
-
Verification of low-purity CO₂
-
Verification of DAC–electrolysis coupling
-
Verification of multi-path chemical synthesis
This is also the market segment where your EPC excels.
Model 3: “Carbon Cycle Regulator” in Energy Microgrid Systems
Structure:
-
PV + Electrolysis for Hydrogen + Fuel Cells
-
DAC provides carbon
-
Synthesizing CH₄ or methanol for energy storage
-
As a medium for cross-seasonal/cross-day energy storage
Especially in Europe, this solution is highly needed:
-
Excess sunlight in summer
-
Severe electricity shortages in winter
-
Batteries cannot store energy across seasons
-
Hydrogen energy has high difficulty in cross-seasonal storage
-
Methanol/CH₄ is the best seasonal energy storage medium
DAC provides the only replicable carbon source.
Part Five: A New Economic Formula is Emerging
1. The Past Economics of DAC: Cost Point Analysis (CAPEX + OPEX)
For example:
-
1 million tons DAC facility
-
Cost per ton of CO₂: $600–1,000
-
Then transported to downstream plants
This is a typical “point-to-point” analysis.
2. The Future Economics of DAC Microfactories: Systematic Analysis
DAC is no longer costed separately but is integrated into the PtX system.
The key variables become:
-
Marginal cost of electricity
-
DAC–electrolysis coupling efficiency
-
Market value of synthetic fuels
-
Transportation cost savings
-
System replicability
-
System operational flexibility
Especially:
The cost of DAC is “diluted” across the entire PtX system, rather than borne separately.
For example:
-
In a certain region, the marginal electricity price of PV → $0.02/kWh
-
Synthetic methanol → greater than $600/ton
-
The capture cost of DAC only accounts for 15–20% of the overall cost
The economics of DAC suddenly become reasonable.
Part Six: The Future Competition of DAC Lies Not in Materials, but in System Integration
In the next 5 years, the core dimensions of competition in DAC will be:
-
Granularity: Can it achieve kg/h level modules?
-
Coupling: Can it couple “gas, electricity, and heat” with electrolyzers?
-
Replicability: Can it be mass-produced like servers?
-
System-friendliness: Not pursuing adsorption efficiency, but overall efficiency?
-
Microfactory Standardization?
The competitive logic of DAC is shifting from “materials” to “system integration”, which is precisely where your EPC is in the strongest position.
Opinions from Epus
The true value of DAC lies not in capture, but in coupling. Only when DAC becomes the entry module for distributed PtX microfactories does it transform from “environmental governance” to “part of the energy system”. The future of DAC is not larger, but smaller, faster, more modular, and more universal.

 Epus Energy Technology (Shanghai) Co., Ltd.
Electro Power Cell Energy Technology (Shanghai) Co., Ltd.🌐 Official Website: www.electropowercell.net📧 Email: [email protected]📱 WhatsApp: +86 136 8167 1402
We are committed to building a system platform for “hydrogen energy—carbon capture—green fuels”, transitioning energy from physical transformation to logical construction, and promoting the replicable implementation of the entire chain from “electrolysis to liquid fuels”.