Author Information: Tang Kai1、Zhang Hu11Department of Medical Imaging, Wuhu Second People’s HospitalThis case is derived from the daily work findings of “Tang Kai”, and I must express my headache…
My insight: The ADC map is one of the most common semi-quantitative data calculated by MR practitioners, and it is often the first encountered data… We often say that DWI and ADC should be combined to more objectively assess the degree of diffusion restriction in tissues; but have we ever considered whether ADC can also have errors? What impact do MRI image artifacts have on DWI and ADC maps?
In summary, the accuracy of the ADC map is influenced by the original DWI images.
—––The following is the main text——
1. Case DescriptionPatient A, male, 43 years old, has had occipital pain for more than two months, and thus underwent a brain MRI plain scan + DWI + MRA, with results as shown in the images: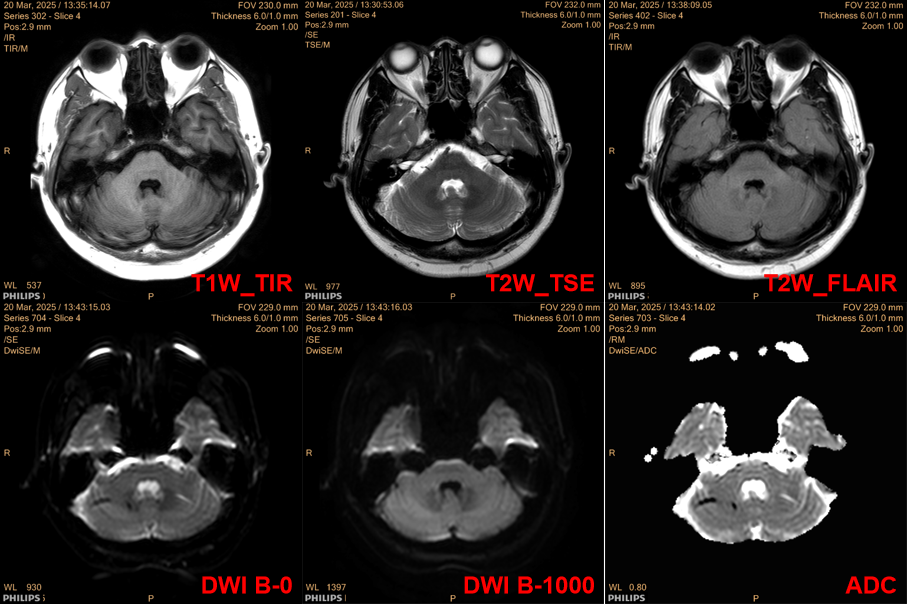
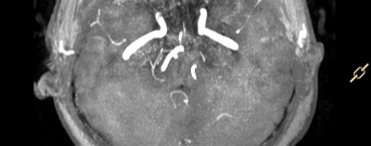 The plain scan report indicates: high signal in the white matter (Fazekas grade I), suspicious low signal in the right cerebellar hemisphere on T2WI with abnormal ADC signal, further examination is recommended; TOF-MRA suggests slight narrowing of the left anterior cerebral artery A1 segment;Therefore, an MRI enhancement scan was additionally ordered; after the examination, no obvious abnormal enhancement was observed, with results as shown in the images:
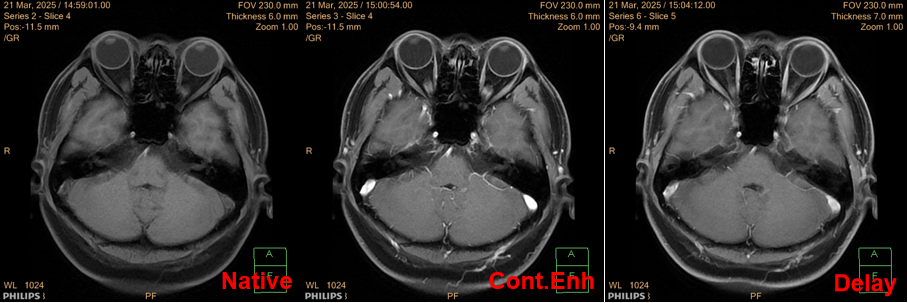 After completing the examination, the diagnosis and clinical team felt confused about the results; thus, they consulted the author regarding the cause.2. Cause Analysis1.Reasons and Identification of Abnormal Image InformationThe issue was discovered during the plain scan, so we must first look at the images: from the ADC map, we can see significant diffusion restriction in the right cerebellar hemisphere; however, upon reviewing other weighted images, no corresponding abnormalities were found in that area. Where does the description of low signal on T2WI in the report come from? Upon reviewing the report description, I found that “no abnormal high signal was seen in the DWI sequence, and low signal was observed in the right cerebellar hemisphere on b=0 and ADC map with chaotic tubular and patchy low signals”; combined with the actual image performance, we can infer that the report physician’s description of the abnormal T2WI signal was based on the B0 image.As we know, the B0 image of the DWI sequence is equivalent to a T2 star fat-suppressed weighted comparison, which is more sensitive to the Mxy phase acceleration loss caused by B0 field inhomogeneity and is often used to assist in judging fat signals or ferromagnetic substances; ADC reflects the differences in the diffusion coefficients of tissues and supports semi-quantitative measurements; however, it is not directly obtained from the device scanning but is calculated through fitting the signal attenuation of different B values in a single DWI scan; the accuracy and reliability of the ADC value are directly related to the image quality of the DWI sequence: when the original DWI data is affected by other factors, it will inevitably lead to unreliable ADC values.Observing the DWI images, we find that B0 has a low signal, while B1000 has an equal signal, leading to the following interpretations of the image information: ① B0 has a low signal, possible reasons include deposition of ferromagnetic substances, signal suppression of fat components, or the flow void effect of large blood vessels; ② The high B value image has an equal signal, while the B0 image has a low signal, indicating the presence of T2 signal cancellation, and that area is highly restricted in diffusion, while excluding the possibility of flow void effects.Regarding information ①, the possibility of fat components no longer needs to be considered (no corresponding high signal was seen on the T1_FLAIR sequence); as for the flow void effect of large blood vessels, it must be a high signal in TOF-MRA and enhancement scans, and some flow void signals should be observable in conventional T2WI images; however, the interpretation of other sequences does not confirm this; for information ②, T2 cancellation effects are common in vasogenic edema, which inevitably leads to an increase in local water molecule content, yet no signal abnormalities were observed in the corresponding FLAIR sequence, and no abnormal enhancement was seen in the enhancement scan, indicating that the blood-brain barrier in this area was not compromised.Thus, we must consider other possibilities for the abnormality in the original DWI sequence data: if we only interpret the information from the cranial MRI plain scan + MRA + enhancement scan, then there are no obvious abnormalities in the right cerebellar hemisphere; while observing the B value images alone, the information from B1000 matches that of other examinations; if the B0 data has artifacts, it can explain the series of abnormalities and contradictions mentioned above; when B0 has a low signal and B1000 has an equal signal, the calculated ADC will inevitably indicate “restricted diffusion”, but this information is misleading due to B0 artifacts, which can be traced back in the information transmission chain.2. Such cases are not uncommonIn previous posts, I have discussed similar issues: since ADC is calculated from the original DWI data at different B values, when the original data has issues, it will inevitably lead to a decrease in the accuracy of ADC data; in previous posts, the factors causing inaccurate ADC values were due to spatial registration differences, while in this case, the factor causing abnormal ADC values was B0 image artifacts.
For the DWI sequence, the prerequisite for accurate ADC values is that the images have temporal and spatial dimensional consistency; since multi-B value images are not collected in a single excitation, inaccurate registration will severely affect the reliability of semi-quantitative data; when encountering such scenarios, the diagnosing physician needs to observe the imaging performance of adjacent layers more closely or perform manual calculations;
tk921225, WeChat public account: TK’s Creative Workshop<Solutions> Thoughts on the differences in ADC after enhancement of DWI images
3. Conclusion and RecommendationsIn summary, we can find that ADC, as fitted generated data, is directly influenced by the original data; for DWI sequence data, images at each B value should be effectively observed and interpreted; when there are significant discrepancies between ADC map data and the information provided by other data, attention should be paid to whether there are abnormalities in the original B value images.In light of the above scenarios, I recommend that technicians pay attention to image observation and quality evaluation after completing MRI scanning tasks; when obvious image abnormalities are encountered, they should promptly assess whether artifacts exist to make timely decisions on whether to rescan or add other sequences with diagnostic significance;—– End of Segmentation Line ——Although this is already over 300 words… I still want to add more words~ Unlike the semi-quantitative data of CT images, the weighted images of MRI reflect the relative signal intensity under the current physical environment – gray-scale mapping, thus the visual brightness of the images will change with the different proportions of tissue components; similarly, the measured values of the images cannot be directly compared between different examinations;
Unlike CT images which have fixed window width and level, the measured values of MR images are dimensionless constants, purely algorithmically mapped (this is a good question, what is the unit of CT values, and what is the unit of MR image ROI?); in simple terms, MR images are signal intensity gray-scale mapping;
Regarding the issue of gray-scale normalization, besides fat suppression, similar problems also exist in enhanced images, diffusion, and images with multiple dimensional information; taking diffusion as an example: we often talk about high signal in diffusion, but why is there still high signal in the overall B value increase when the signal is attenuating? Naturally, it is because the signal of the restricted diffusion part attenuates more slowly, thus appearing as ‘relatively high signal’;
tk921225, WeChat public account: TK’s Creative Workshop<Solutions> Why does the comparison change after fat suppression with the same weighting?
Furthermore, the weighted comparison of MRI is not influenced by a single physical effect; its signal intensity is affected by the combined effects of scanning parameters and tissue T1, T2, and Pd; by adjusting the scanning parameters, we can emphasize the information of a certain weight, a method we call “weighting”;
Signal intensity = constant * proton density * TE effect on T2 relaxation * TR effect on T1 relaxation; in layman’s terms, by adjusting scanning parameters, we change the weight of single-dimensional information in the overall output, thereby relatively significantly increasing the proportion of that information, a method we call “weighting”; however, no matter how we optimize image parameters, the image will carry information from three dimensions: proton density, transverse magnetization vector decay, and longitudinal magnetization vector recovery;
tk921225, WeChat public account: TK’s Creative Workshop<Case Study> What is called weighting is just weighting…
Similarly, DWI images are essentially also weighted images; based on the differences in proton density information, “diffusion-sensitive gradients” are applied to allow the information of “the degree of restriction of water molecule diffusion” to affect the magnetic resonance signal intensity; due to the signal readout method of DWI images and the time required for the diffusion-sensitive gradient, the TE value of the sequence will not be too low, thus the image itself will have a certain T2 star weight (in fact, the information of T1 weight and Pd weight is usually ignored); additionally, DWI only reflects the signal changes of water molecules, so DWI images need to be combined with fat suppression techniques;The weighted comparison of conventional MR images is controlled by adjusting scanning parameters, while DWI images reflect the weight of water molecule diffusion information in the image by adjusting B values; B value is the diffusion sensitivity factor, representing the sensitivity of each MR imaging sequence to diffusion motion, and is a comprehensive reflection of diffusion motion capability; when B=0, the image is equivalent to a fat-suppressed image with some T2 star effects; as the B value increases, the T2 star part of the image decreases, and the diffusion weight increases; overall, the higher the B value, the heavier the diffusion weight of the image.
In the previous text, we discussed that the essence of DWI images is a type of weighted image, so what is the apparent diffusion coefficient (ADC)? I emphasize that the “degree of restriction of water molecule diffusion” has its reasons: if we understand diffusion motion as “the range of microscopic movement of water molecules in a unit time”, then regarding the relationship between distance and time, we can simplify it to a rate relationship (in fact, the quantification of motion in the macroscopic world is often done using rate), which is the diffusion coefficient D, measured in mm²/s; however, MR images themselves cannot distinguish the various causes (such as thermal gradients, atomic interactions, blood flow perfusion, etc.) that lead to signal attenuation, thus we use the ADC value [apparent diffusion coefficient] to replace D value;
Since D value is a relatively certain quantity, and we cannot directly obtain ADC values through scanning, and the B value that affects diffusion weight has been mentioned, how do we relate them? D is objectively present but subjectively unknown; we change the expression ratio of diffusion weight in the image by adjusting the B value, and then use mathematical methods to fit its signal curve and extract its function coefficient to calculate the ADC value, thus we use the semi-quantitative ADC value to replace the objective D value;
Since the result is a dimensionality reduction output, how do we obtain the original dimensional information? The simplest method is to raise the dimensions again, transform, and then output the corresponding information; taking T2MAP as an example: transform the coordinate scale of Mxy → find the feature that does not change with scale transformation → output the result again after dimensionality reduction; in layman’s terms, without changing other parameters, only changing the TE value to measure the signal intensity decay trend at the same scale → fit and obtain the decay coefficient of signal intensity → visualize the decay coefficients of the entire matrix, thus obtaining T2MAP;
tk921225, WeChat public account: TK’s Creative Workshop<Case Study> What is called weighting is just weighting…
The more restricted the microscopic movement of water molecules in a substance, the lower its D value; thus, in high B value scans, the influence of diffusion-sensitive gradients is smaller, the residual signal intensity is larger, the B value image is brighter, and the generated ADC data is lower;In simple terms, the diffusion coefficient is the cause, and the DWI image is the effect; in actual scanning, we cannot directly scan out the diffusion coefficient, but we need to adjust the B value to obtain the influence on the image under different scales; scanning obtains DWI images and fitting to calculate the apparent diffusion coefficient ADC is essentially a process of “inferring the cause from the effect”;Finished…