An Insight into GDB Principles

An Insight into GDB Principles

This article is a highlight from the KX forum

Author from KX forumID: ScUpax0s

The goals of this article are:

Main goal: Understand the debugging principles of GDB and learn the use of ptrace.

Secondary goal: Implement a tiny debugger that can be used for tracing.

Terminology:
  • tracer: The one who traces

  • tracee: The one being traced

As a PWN expert, I often deal with GDB. This article provides a simple introduction to the basic principles related to GDB~ (While using the tools, one should also understand the basic principles of the tools)
An Insight into GDB Principles

Brief Overview of GDB Debugging Principles
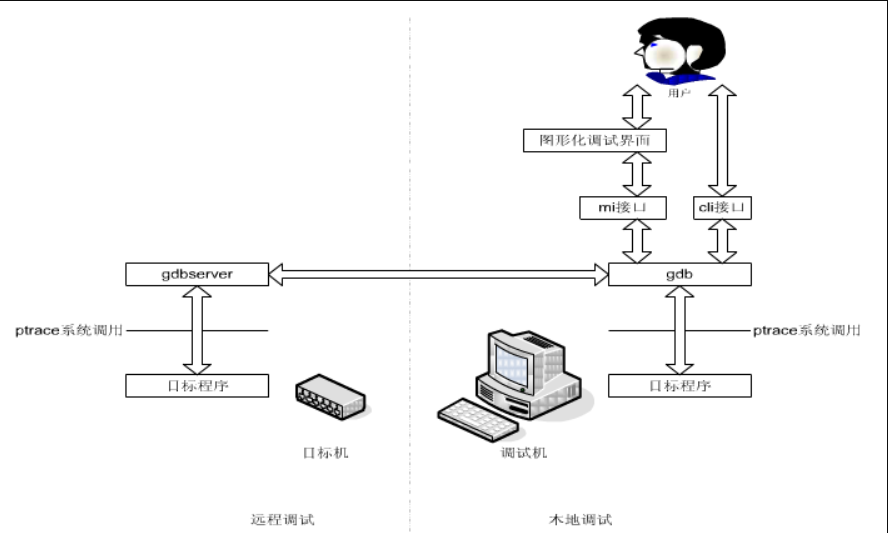
An Insight into GDB Principles
The overall structure of GDB is as follows:
An Insight into GDB Principles
What happens when we debug an executable file using gdb?

gdb ./a.out

When run this way, first, gdb parses the symbols of the a.out file. Next, when we input the run command, gdb forks a new process and sets the traceme mode through ptrace(PTRACE_TRACEME, 0, NULL, NULL); Finally, it executes exec to start loading the file to be debugged.

attach pid

When debugging PWN challenges, we trace the process to be debugged using attach pid. gdb tracks the target process by executing ptrace(PTRACE_ATTACH, pid, 0, 0).

gdb server’s target remote

When debugging the kernel with gdb+qemu, target remote is often used to attach to qemu for debugging vmlinux. There is a specially defined communication format for the data exchanged between the two.
An Insight into GDB Principles

ptrace

ptrace can be said to be the soul of gdb.
https://man7.org/linux/man-pages/man2/ptrace.2.html
The prototype of ptrace is as follows:
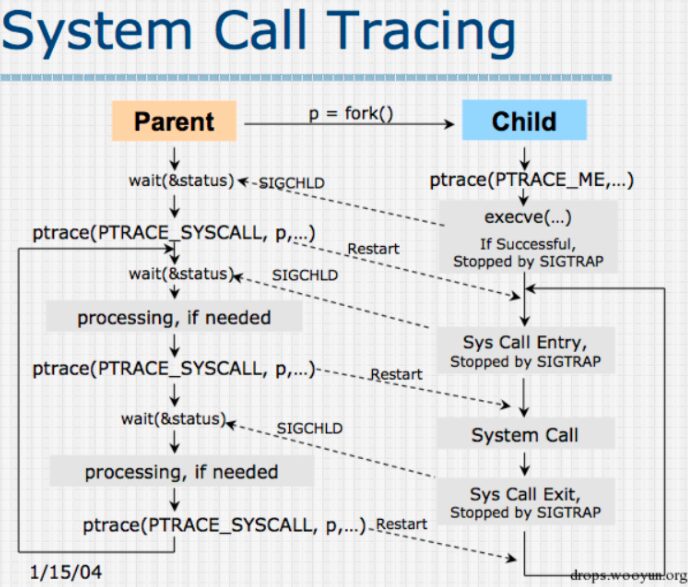
long ptrace(enum __ptrace_request request, pid_t pid, void *addr, void *data);
The official description is as follows:
The ptrace() system call provides a means by which one process (the "tracer") may observe and control the execution of another process (the "tracee"), and examine and change the tracee's memory and registers. It is primarily used to implement breakpoint debugging and system call tracing.
Translation: The ptrace() system call provides a method for the tracer to observe and control the tracee, specifically allowing inspection of the memory and register values of the tracee. ptrace is primarily used for implementing breakpoint debugging and system call tracing.
A tracee first needs to be attached to the tracer. Attachment and subsequent commands are per thread: in a multithreaded process, every thread can be individually attached to a (potentially different) tracer, or left not attached and thus not debugged. Therefore, "tracee" always means "(one) thread", never "a (possibly multithreaded) process". Ptrace commands are always sent to a specific tracee using a call of the form
First, the tracee process must be attached to the tracer (which is what we do after starting gdb with attach pid). It is important to note that the attach and subsequent commands are per thread. If it is a multithreaded program, each thread must be attached individually. Here, it is emphasized that the tracee is a single thread, not an entire multithreaded program.
While being traced, the tracee will stop each time a signal is delivered, even if the signal is being ignored. (An exception is SIGKILL, which has its usual effect.) The tracer will be notified at its next call to waitpid(2) (or one of the related "wait" system calls); that call will return a status value containing information that indicates the cause of the stop in the tracee. While the tracee is stopped, the tracer can use various ptrace requests to inspect and modify the tracee. The tracer then causes the tracee to continue, optionally ignoring the delivered signal (or even delivering a different signal instead).
When being traced, the tracee will stop each time a signal is delivered, even if the signal is ignored. (An exception is SIGKILL, which has its usual effect.) The tracer will be notified at its next call to waitpid or similar system calls. That call will return a status value containing information indicating the cause of the stop in the tracee. While the tracee is stopped, the tracer can use various ptrace requests to inspect and modify the tracee. The tracer then tells the tracee to continue, optionally ignoring the delivered signal.
The meanings of the four parameters of ptrace are explained as follows:
First parameter request: The value of request determines the operation to be performed
The first parameter of ptrace can be one of the following values:
PTRACE_TRACEME,   This process is being traced by its parent process. The parent process should wish to trace the child process PTRACE_PEEKTEXT,  Read a byte from the memory address given by addr PTRACE_PEEKDATA,  Same as above PTRACE_PEEKUSER,  Can check the user mode memory area (USER area), read a byte from the USER area, offset by addr PTRACE_POKETEXT,  Write a byte to the memory address given by addr PTRACE_POKEDATA,  Write a byte to the memory address given by addr PTRACE_POKEUSER,  Write a byte to the USER area, offset by addr PTRACE_GETREGS,    Read registers PTRACE_GETFPREGS,  Read floating-point registers PTRACE_SETREGS,  Set registers PTRACE_SETFPREGS,  Set floating-point registers PTRACE_CONT,    Continue running PTRACE_SYSCALL,  Continue running PTRACE_SINGLESTEP,  Set single-step execution flag PTRACE_ATTACH, Trace the specified pid PTRACE_DETACH,  End tracing
Second parameter pid: Indicates the process that ptrace should trace.
Third parameter addr: Specifies the memory address that ptrace should read or monitor.
Fourth parameter data: If we want to write data to the target process, then data is the data to be written; if we read data from the target process, the read data goes into data.
Next, let’s look at some representative modes in request.

(1) PTRACE_TRACEME

This mode is only used by the tracee, and the process using it will be traced by its parent process. The parent process learns of the child process’s signals through wait().
/** * ptrace_traceme  --  helper for PTRACE_TRACEME * * Performs checks and sets PT_PTRACED. * Should be used by all ptrace implementations for PTRACE_TRACEME. */static int ptrace_traceme(void){    int ret = -EPERM;    write_lock_irq(&tasklist_lock);    /* Are we already being traced? */    if (!current->ptrace) {        ret = security_ptrace_traceme(current->parent);        /*         * Check PF_EXITING to ensure ->real_parent has not passed         * exit_ptrace(). Otherwise we don't report the error but         * pretend ->real_parent untraces us right after return.         */        if (!ret && !(current->real_parent->flags & PF_EXITING)) {            current->ptrace = PT_PTRACED;            __ptrace_link(current, current->real_parent);        }    }    write_unlock_irq(&tasklist_lock);    return ret;}
When we only use the traceme mode, the kernel first allows the writer to obtain the read/write lock and prohibits local interrupts.
Next, it checks whether our current process is already being traced, and then links the child process to the parent process’s ptrace linked list.
Finally, it releases the lock.

(2) PTRACE_ATTACH

In attach mode, by specifying a tracee’s pid, the tracee sends a SIGSTOP signal to the tracer. The tracer uses waitpid() to wait for the tracee to stop.
if (request == PTRACE_ATTACH) {       if (child == current)                         goto out;       if ((!child->dumpable ||                // Check process permissions           (current->uid != child->euid) ||           (current->uid != child->suid) ||           (current->uid != child->uid) ||           (current->gid != child->egid) ||           (current->gid != child->sgid) ||           (!cap_issubset(child->cap_permitted, current->cap_permitted)) ||           (current->gid != child->gid)) &&& !capable(CAP_SYS_PTRACE))           goto out;                         if (child->flags & PF_PTRACED)           goto out;       child->flags |= PF_PTRACED;           // Set process flag PF_PTRACED       write_lock_irqsave(&tasklist_lock, flags);       if (child->p_pptr != current) {     // Set the process as the current process's child.           REMOVE_LINKS(child);           child->p_pptr = current;           SET_LINKS(child);       }       write_unlock_irqrestore(&tasklist_lock, flags);       send_sig(SIGSTOP, child, 1);      // Send a SIGSTOP to the child process to stop it       ret = 0;       goto out;   }

(3) PTRACE_CONT

The tracer uses this mode to send a signal to the tracee, allowing the stopped tracee to continue running.
case PTRACE_CONT:            long tmp;            ret = -EIO;            if ((unsigned long) data > _NSIG)       // Check if the signal exceeds the range?                goto out;            if (request == PTRACE_SYSCALL)                child->flags |= PF_TRACESYS;        // If it is PTRACE_SYSCALL, set the PF_TRACESYS flag            else                child->flags &= ~PF_TRACESYS;         // If it is PF_CONT, remove the PF_TRACESYS flag            child->exit_code = data;                // Set the signal to continue processing             tmp = get_stack_long(child, EFL_OFFSET) & ~TRAP_FLAG; // Clear TRAP_FLAG            put_stack_long(child, EFL_OFFSET,tmp);             wake_up_process(child);                 // Wake up the stopped child process            ret = 0;            goto out;

(4) PTRACE_PEEKUSER

Read a word at the addr in the tracee’s USER area. The read word is the return value.

(5) PTRACE_SINGLESTEP

Specifically, for PTRACE_SINGLESTEP in ptrace, it is implemented based on the TF bit (trap flag) of the eflags register. It forces the child process to execute the next assembly instruction and then stops it, at which point the child process generates a debug exception, and the corresponding exception handler clears this flag and forces the current process to stop. Then it sends a SIGCHLD signal to the parent process.

demo

With the above foundations, let’s look at the following demo
#include <sys/ptrace.h>#include <sys/types.h>#include <sys/wait.h>#include <unistd.h>#include <sys/reg.h>   /* For constants  ORIG_RAX etc */#include <stdio.h>int main(){    char * argv[ ]={"ls","-al","/etc/passwd",(char *)0};    char * envp[ ]={"PATH=/bin",0};    pid_t child;    long orig_rax;    child = fork();    if(child == 0)    {        ptrace(PTRACE_TRACEME, 0, NULL, NULL);        printf("Try to call: execl\n");        execve("/bin/ls",argv,envp);        printf("child exit\n");    }    else    {        wait(NULL);             // Wait for child process        orig_rax = ptrace(PTRACE_PEEKUSER,                          child, 8 * ORIG_RAX,                          NULL);        printf("The child made a "               "system call %ld\n", orig_rax);        ptrace(PTRACE_CONT, child, NULL, NULL);        printf("Try to call:ptrace\n");    }    return 0;
This program outputs as follows:
root@ubuntu:~/tiny_debugger# ./demo1Try to call: execlThe child made a system call 59Try to call:ptraceroot@ubuntu:~/tiny_debugger# -rw-r--r-- 1 root root 2446 Dec 13 19:53 /etc/passwd
Let’s summarize its process.
  1. Fork a child process. The child process is marked as tracee. (PTRACE_TRACEME)

  2. The child process calls execve, sending a SIGCHLD to the parent process. Meanwhile, the child process stops due to SIGTRAP.

  3. The parent process captures SIGCHLD and uses ptrace to obtain the system call number (59) of the child process.

  4. The parent process tells the child process to continue executing (PTRACE_CONT), and the child process outputs the content of ls.

  5. The child’s printf(“child exit\n”); will not be executed because execve discards the part after execve() in the original child process, and the stack and data of the child process will be replaced by the corresponding parts of the new process. It never returns.

It should be noted that the one causing the child process to stop is the exec family functions within the child process.
/** * ptrace_event - possibly stop for a ptrace event notification * @event:    %PTRACE_EVENT_* value to report * @message:    value for %PTRACE_GETEVENTMSG to return * * Check whether @event is enabled and, if so, report @event and @message * to the ptrace parent. * * Called without locks. */static inline void ptrace_event(int event, unsigned long message){    if (unlikely(ptrace_event_enabled(current, event))) {        current->ptrace_message = message;        ptrace_notify((event << 8) | SIGTRAP);    } else if (event == PTRACE_EVENT_EXEC) {        /* legacy EXEC report via SIGTRAP */        if ((current->ptrace & (PT_PTRACED|PT_SEIZED)) == PT_PTRACED)            send_sig(SIGTRAP, current, 0);    }}
When the tracee triggers an exec, it generates a SIGTRAP through send_sig(SIGTRAP, current, 0), causing it to stop.
An Insight into GDB Principles
Next, let’s summarize how ptrace works:
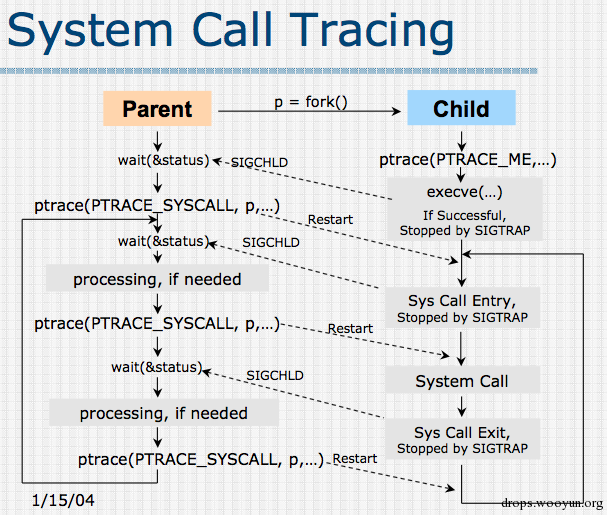
  • Reading and modifying data using copy_from_user and copy_to_user.

  • Accessing registers through copy_regset_from/to_user. The register data is stored in the task struct.

  • Single stepping: Each step (step) once, the CPU will continue executing until there is a branch, interrupt, or exception. ptrace enables single-step debugging by setting the corresponding flags in the process’s thread_info.flags and MSR.

void user_enable_single_step(struct task_struct *child){    enable_step(child, 0);}
/* * Enable single or block step. */static void enable_step(struct task_struct *child, bool block){    /*     * Make sure block stepping (BTF) is not enabled unless it should be.     * Note that we don't try to worry about any is_setting_trap_flag()     * instructions after the first when using block stepping.     * So no one should try to use debugger block stepping in a program     * that uses user-mode single stepping itself.     */    if (enable_single_step(child) && block)        set_task_blockstep(child, true);    else if (test_tsk_thread_flag(child, TIF_BLOCKSTEP))        set_task_blockstep(child, false);}
In enable_single_step, the X86_EFLAGS_TF and TIF_SINGLESTEP flags are set.
In test_tsk_thread_flag, the corresponding task info’s TIF_BLOCKSTEP flag is checked.
void set_task_blockstep(struct task_struct *task, bool on){    unsigned long debugctl;    local_irq_disable();    debugctl = get_debugctlmsr();    if (on) {        debugctl |= DEBUGCTLMSR_BTF;        set_tsk_thread_flag(task, TIF_BLOCKSTEP);    } else {        debugctl &= ~DEBUGCTLMSR_BTF;        clear_tsk_thread_flag(task, TIF_BLOCKSTEP);    }    if (task == current)        update_debugctlmsr(debugctl);    local_irq_enable();}
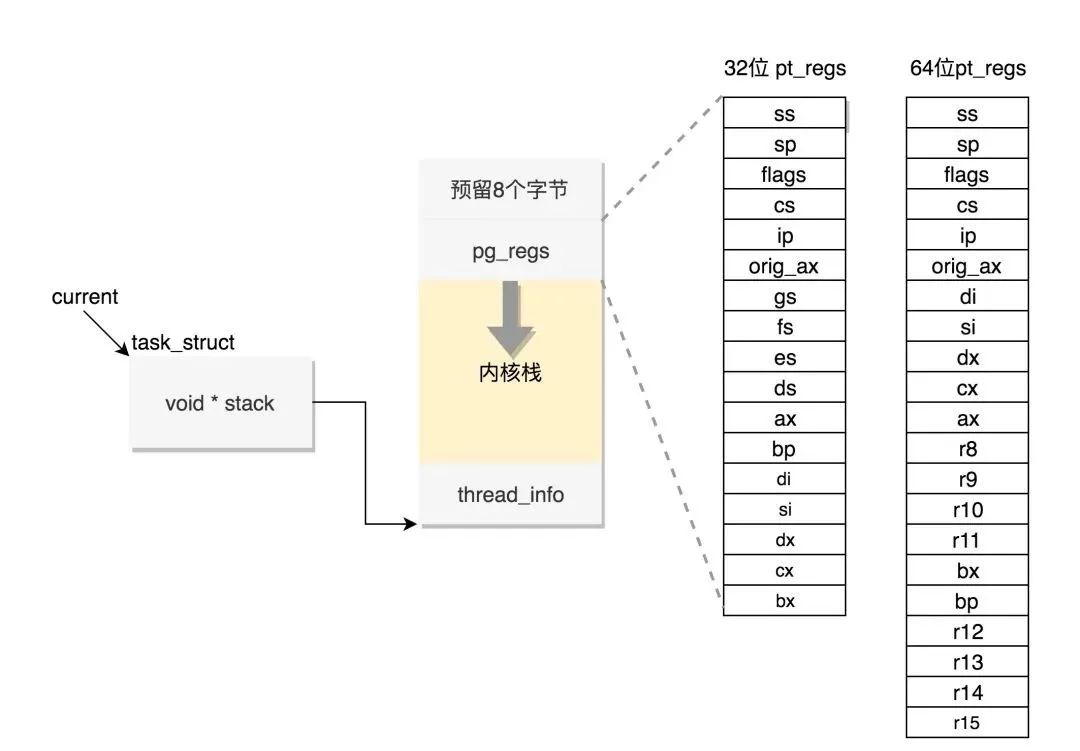
Next, in set_task_blockstep, the DEBUGCTLMSR_BTF and the corresponding task info’s TIF_BLOCKSTEP are set or cleared.
An Insight into GDB Principles

Breakpoints

First, it’s important to clarify that breakpoints are not part of the implementation of ptrace. Additionally, when in attach and traceme states, any signals delivered to the tracee will first be intercepted by GDB.
The general implementation of breakpoints is as follows:
Assuming we want to stop at addr.
Then GDB will do the following.
1. Read the instruction at addr and store it in GDB’s breakpoint linked list.
2. Inject the interrupt instruction INT 3 (0xCC) at the original addr. This means replacing the instruction at addr with INT 3.
3. When execution reaches addr (INT 3), the CPU executing this instruction causes a breakpoint exception (breakpoint exception), generating a SIGTRAP for the tracee. At this point, in attach mode, the tracee’s SIGTRAP will be captured by the tracer (GDB).
Then GDB checks its maintained breakpoint linked list for the corresponding position. If found, it indicates a hit on the breakpoint.
4. Next, if we want the tracee to continue running normally, GDB will replace the INT 3 instruction back to the original instruction, rewind, re-execute the normal instruction, and then continue running.
We can see the following demo:
#include<stdio.h>#include<stdlib.h>#include<unistd.h>int main(){    printf("test INT 3\n");    __asm__("int $0x3");    printf("breakpoint");    return 0;}
When we run it independently:
root@ubuntu:~/tiny_debugger# ./bptest INT 3Trace/breakpoint trap (core dumped)
When placed in GDB:
An Insight into GDB Principles
It can be seen that it has stopped due to the presence of INT 3. If we continue, it can run to completion normally.
An Insight into GDB Principles

Watchpoints (Hardware Breakpoints)

A very useful command in GDB is the watch command. It is used to monitor changes to a specific memory location or register.
The implementation of watch is related to the CPU’s related registers. Taking the 80386 as an example.
There are eight special registers from DR0 to DR7 to implement hardware breakpoints.
An Insight into GDB Principles
(1) DR0-DR3: Each register saves the linear address of the corresponding conditional breakpoint. Additional information about each breakpoint is stored in DR7. It should be noted that since the stored address is linear, enabling paging does not affect it. If paging is enabled, the linear address is converted to a physical address by the mmu; otherwise, the linear address is equivalent to the physical address.
(2) DR7 Debug Control Register: The lower eight bits of DR7 (0, 2, 4, 6 and 1, 3, 5, 7) selectively enable four conditional breakpoints. There are two levels of enablement: local (0, 2, 4, 6) and global (1, 3, 5, 7). The processor automatically resets the local enable bits on each task switch to avoid unnecessary breakpoints in the new task. The global enable bits are not reset by task switches; therefore, they can be used for global conditions across all tasks.
Bits 16-17 (corresponding to DR0), 20-21 (DR1), 24-25 (DR2), and 28-29 (DR3) define when the breakpoint is triggered. Each breakpoint has a two-bit corresponding value to specify whether they interrupt on execution (00b), data write (01b), data read or write (11b). 10b is defined to indicate IO read or write interrupts, but no hardware supports it. Bits 18-19 (DR0), 22-23 (DR1), 26-27 (DR2), and 30-31 (DR3) define how large of a memory area the breakpoint monitors. Similarly, each breakpoint has a two-bit corresponding value to specify whether they watch one (00b), two (01b), eight (10b), or four (11b) bytes.
(3) DR6 Debug Status Register: Informs the debugger which breakpoints have occurred.
An Insight into GDB Principles

Implementing a Tracer with ptrace

An Insight into GDB Principles
This section mainly references: On the subject of debuggers and tracers
The complete code with full comments has been uploaded to GitHub: OrangeGzY/tiny_debugger
We hope to write a mini tracer to implement breakpoints and tracing.
At the simplest level, we need two processes: the child process is responsible for starting the tracee program, and the parent process is responsible for tracing the tracee.
The tracee program is as follows:
#include <stdio.h>int func1(){    printf("function1");}void func2(){    printf("function2");}void func3(){    printf("fucntion3");}int main(){    //printf("===========\n");    func1();    func3();    func2();    func2();    func3();    //printf("===========\n");    return 0;}
The tracee program is started by the child process forked from execl.
if(child == 0){    ptrace(PTRACE_TRACEME, 0, NULL, NULL);    execl(argv[1],argv[1],NULL);    perror("fail exec");    exit(-1);}
Next, let’s look at the implementation of the tracer.
An Insight into GDB Principles

ELF File Parsing

First, we need to parse some ELF information corresponding to the tracee to obtain function symbols, function names, and function addresses.
fread(&header, sizeof(Elf64_Ehdr), 1, fp);    //read elf header of target filefseek(fp, header.e_shoff, SEEK_SET);        //move the pointer to Section Header Table
First, we read the ELF header, and then move the file pointer to the section table position.
Next, we scan each section header until we find the information for our symbol table.
for(int i=0;i < header.e_shnum;i++){    fread(&section_header, sizeof(Elf64_Shdr), 1, fp);    if(section_header.sh_type == SHT_SYMTAB)    {        ......    }    ......}
After finding the symbol table, we locate the header of the string table (strtab header) in the section table and read the relevant information.
fseek(fp,str_table_offset,SEEK_SET);                    //定位到字符串表headerfread(&str_section_header, sizeof(Elf64_Shdr), 1, fp);    //读取字符串表表头
Now we have the basic information of the symbol table’s string table. We can proceed to the next step.
We scan each entry in the symbol table Elf64_Sym.
If this symbol is a function and the address exists and is valid, then this is one of the functions we want to trace.
We implement tracing by injecting breakpoints at the start of each function.
After scanning for the functions to be traced, we store their corresponding information (function address, function name, and the instruction at that address) into a defined Breakpoint structure.
int bp = 0;        //globaltypedef struct breakpoint{    size_t addr;    char name[25];    size_t orig_code;}Breakpoint;Breakpoint bp_list[N];
for(int i=0;i<sym_entry_count; i++){            //符号表中每一个元素是一个 Elf64_Sym            Elf64_Sym sym;            fread(&sym, sizeof(Elf64_Sym), 1,fp);                //每次读一个Symbol            if(ELF64_ST_TYPE(sym.st_info) == STT_FUNC && sym.st_name!=0 && sym.st_value != 0){                /* 如果该符号是一个函数或其他可执行代码,在字符串表中,且虚拟地址不为0 */                long file_ops = ftell(fp);                                        //保存此时fp的位置                fseek(fp,str_section_header.sh_offset+sym.st_name,SEEK_SET);    //定位到字符串表中对应符号的位置                bp_list[bp].addr = sym.st_value;                fread(bp_list[bp].name,25,sizeof(char),fp);                        //读取对应的符号                bp = bp + 1;                fseek(fp,file_ops,SEEK_SET);                                    //恢复fp到上一次读取的Symbol的位置,准备下一次读取。            }        }
When the scanning is complete, all the functions to be traced (breakpoints) have been added to our bp_list.
An Insight into GDB Principles

Breakpoint Injection

We implement breakpoint injection for each function that needs to be traced by traversing Breakpoint bp_list[N].
int breakpoint_injection(pid_t child){    /* We inject INT 3 (0xCC) at the first instruction of each function */    for(int i=0 ; i<bp ; i++){        //使用ptrace读出一个字节存在orgi code中        bp_list[i].orig_code = ptrace(PTRACE_PEEKTEXT,child,bp_list[i].addr,0);        #ifdef DEBUG        printf("[*] Set Breakpoint:0x%llx,0x%llx\n",bp_list[i].addr,bp_list[i].orig_code);        #endif        ptrace(PTRACE_POKETEXT, child, bp_list[i].addr, (bp_list[i].orig_code & 0xFFFFFFFFFFFFFF00) | INT_3);    //将最低为的字节打入 int 3    }    printf("\n");    #ifdef DEBUG    check_bp(child);    #endif}
The steps are as follows:
(1) Read the original instruction at the breakpoint and store it in bp_list[i].orig_code.
(2) Use ptrace to inject 0xCC (INT 3) at addr. This modifies the instruction at that point, performing a dynamic patch.
(3) Check if the injection was successful.
At this point, our breakpoints have been injected, and INT 3 has been injected at the start of each function.
An Insight into GDB Principles

Breakpoint Tracking

After we finish injecting breakpoints in the tracer, we first wait for the child process to execute execl.
Next, we check the type of signal that wait has received. If it is a SIGSTOP, we further check if it is SIGTRAP.
If it is SIGTRAP, we check whether a breakpoint has been hit. At this point, we do the following steps.
(1) Save the user-mode registers in preparation for rollback.
(2) Scan the breakpoint list to see if the value in the rip register minus one matches the address of any entry in the breakpoint list. If it does, it indicates a hit on the breakpoint (hit), and if hit, output the function name.
(3) Next, to maintain the normal execution of the program, we use ptrace to restore the instruction at the address where INT 3 was injected back to orig_code.
(4) After that, we use ptrace to set the registers, letting the execution flow roll back one step, executing the instruction that should be executed (the int 3 has now been replaced back to normal).
(5) Single-step once, skip over this normal instruction, and re-inject the breakpoint at this address.
At this point, we have achieved tracking and maintaining breakpoints while preserving the normal execution flow of the program and breakpoint information.
if(WIFSTOPPED(status))            {                /* If it is a STOP signal */                if(WSTOPSIG(status)==SIGTRAP)                {                // If SIGTRAP was triggered, it indicates a breakpoint hit                    ptrace(PTRACE_GETREGS,child,0,&regs);    // Read the current user-mode register values, preparing for rollback                    //printf("[+] SIGTRAP rip:0x%llx\n",regs.rip);                    /* Compare the current addr with the addr maintained in our bp_list. If found, it indicates a hit on the breakpoint */                    if((hit_index=if_bp_hit(regs))==-1)                    {                        /* Missed */                        printf("MISS, fail to hit:0x%llx\n",regs.rip);                        exit(-1);                    }                    else                    {                        /* If hit */                        /* Output hit info */                        printf("%s()\n",bp_list[hit_index].name);                        /* Restore the original instruction at the addr where INT 3 was patched */                        ptrace(PTRACE_POKETEXT,child,bp_list[hit_index].addr,bp_list[hit_index].orig_code);                        /* Roll back the execution flow, re-executing the correct instruction */                        regs.rip = bp_list[hit_index].addr;                        ptrace(PTRACE_SETREGS,child,0,&regs);                        /* Single-step once, then restore the breakpoint */                        ptrace(PTRACE_SINGLESTEP,child,0,0);                        wait(NULL);                        /* Restore the breakpoint */                        ptrace(PTRACE_POKETEXT, child, bp_list[hit_index].addr, (bp_list[hit_index].orig_code & 0xFFFFFFFFFFFFFF00) | INT_3);                    }                }               }            ptrace(PTRACE_CONT,child,0,0);

Final output:

An Insight into GDB Principles
If we enable debug mode, the output is as follows:
An Insight into GDB Principles

It can be seen that the entire process is very clear.

References

https://man7.org/linux/man-pages/man2/ptrace.2.html
https://sourceware.org/gdb/wiki/Internals
https://www.jianshu.com/p/b1f9d6911c90
https://blog.csdn.net/u012417380/article/details/60468697
https://blog.csdn.net/reliveIT/article/details/108269437
Ptrace–An Application of Code Injection Technology in Linux

An Insight into GDB Principles

– End –

An Insight into GDB Principles

KX ID: ScUpax0s

https://bbs.pediy.com/user-home-876323.htm

*This article is originally by KX forum ScUpax0s, please indicate the source from KX community when reprinting.

# Previous Recommendations

  • Detailed Analysis Series of Linux ptrace (II)
  • Firm-AFL: Efficient IoT Firmware Gray Box Fuzzing

  • Google CTF 2020 Qualifying Round reverse_android

  • CVE-2020-12351: Analysis of Linux Bluetooth Module Denial of Service Vulnerability

  • Windows Application Responding to GPIO (SCI) Device Interrupts Hardware Part

An Insight into GDB Principles
Official WeChat ID: ikanxue
Official Weibo: KX Security
Business Cooperation: [email protected]
An Insight into GDB Principles

Share This

An Insight into GDB Principles

Like This

An Insight into GDB Principles

Watch This

An Insight into GDB Principles

Click “Read Original” to learn more!

Leave a Comment