
Introduction to GDB
GDB (GNU Debugger) is a powerful command-line debugging tool. Generally, when developing on Windows, command-line debugging is rarely used, as debuggers are mostly integrated with compilers in IDEs.
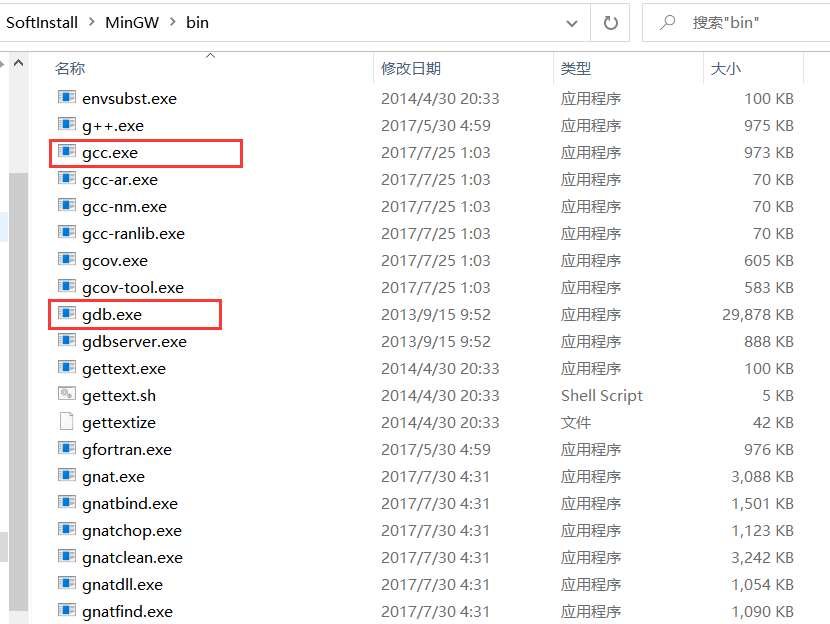
Of course, you can also directly use gcc and gdb to compile and debug our C programs on Windows. For example, MinGW (a collection of freely usable and distributable Windows-specific header files and libraries using the GNU toolchain) includes both gcc and gdb tools:

Use the gdb -v command to check the version of gdb:

However, when developing on Linux, the gdb tool is one of the must-know tools.
I recently transitioned to Linux, so I naturally need to master some essential tools and knowledge. I learn as I go, and in this note, we’ll first share the usage of gdb:
Example Demonstration of GDB Usage
Regular readers know that one of the characteristics of our public account articles is that they contain many examples and are highly actionable. Following the article step by step should help you learn something.
Similarly, in this note, we will analyze through examples.
Example code gdb_test.c:
Swipe left and right to view all code>>>
// Public Account: Embedded Mixed Bag
// Author: ZhengN
#include <stdio.h>
// Test Function 1
void test0(void)
{
int i = -1;
if (i = 0)
printf("i = %d\n", i);
else if (i = 1)
printf("i = %d\n", i);
else
printf("i = %d\n", i);
}
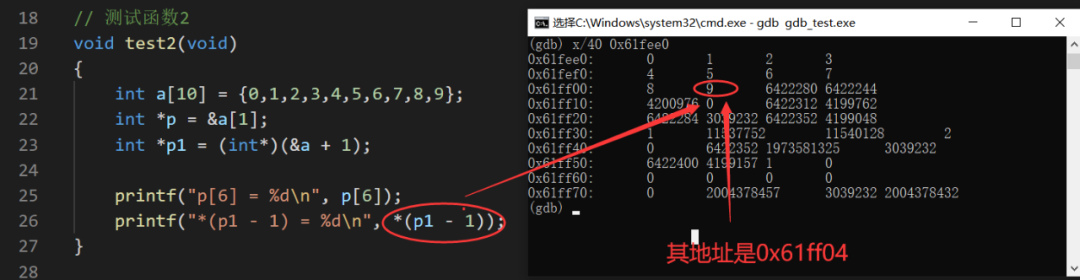
// Test Function 2
void test1(void)
{
int a[10] = {0,1,2,3,4,5,6,7,8,9};
int *p = &a[1];
int *p1 = (int*)(&a + 1);
printf("p[6] = %d\n", p[6]);
printf("*(p1 - 1) = %d\n", *(p1 - 1));
}
// Main Function
int main(int argc, char *argv[])
{
test0();
test1();
return 0;
}
This example code contains two test functions, which are also two classic and easily mistaken interview questions. Everyone can think about what the results are.
Next, we will use gdb to debug and analyze step by step. The operations in Linux are similar to those in Windows.
Generally, we use the following command to compile:
gcc gdb_test.c -o gdb_test.exe
However, the compiled gdb_test.exe does not contain debugging information. We must compile an executable file with debugging information (such as line numbers) to use gdb for debugging. We can generate debugging information by adding the -g parameter.
In addition, we should not use optimization options during compilation, as using optimization may cause the compiler to reorder statements and optimize some variables, leading to discrepancies between the program execution flow and the source code.
Furthermore, we can use the -Wall parameter to enable all warnings, so our compilation command becomes:
gcc -g -Wall gdb_test.c -o gdb_test.exe
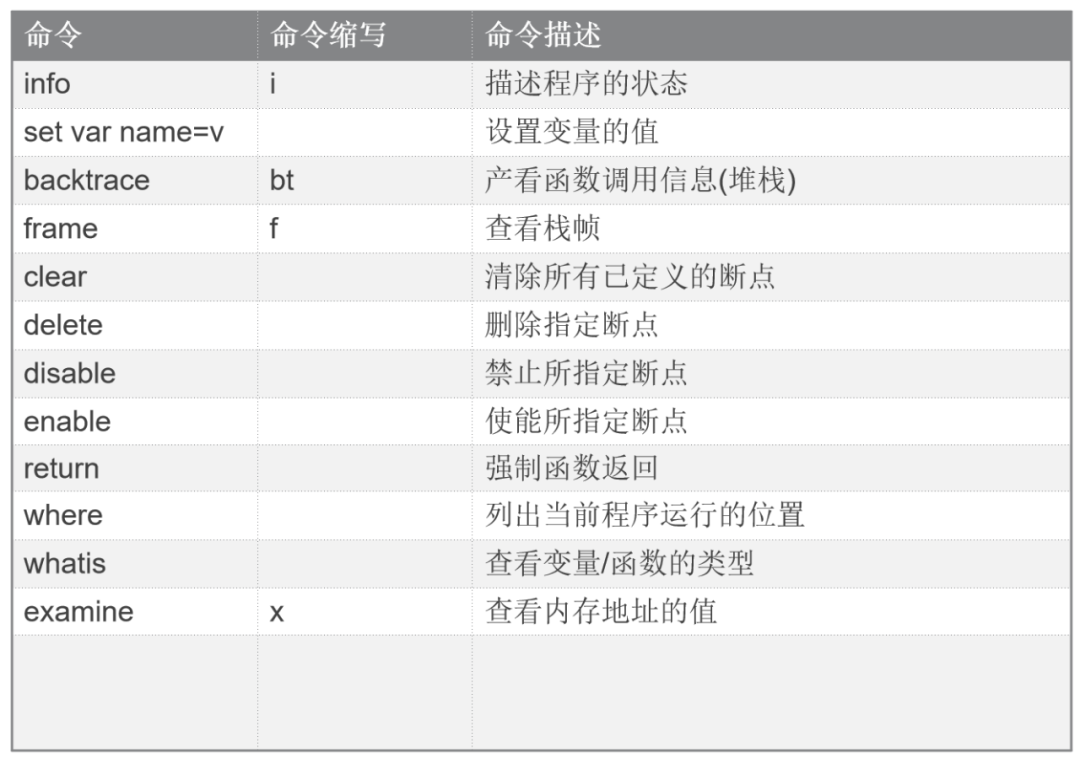
1. Common GDB Commands
Below is a rough list of some commonly used commands:
2. Demo Debugging Analysis
Use the above compilation command to compile and obtain an executable program gdb_test.exe with debugging information. There are two ways to start debugging.
One way is to first enter the gdb environment by typing the gdb command and then input file + executable program to load the debugging file, i.e.:

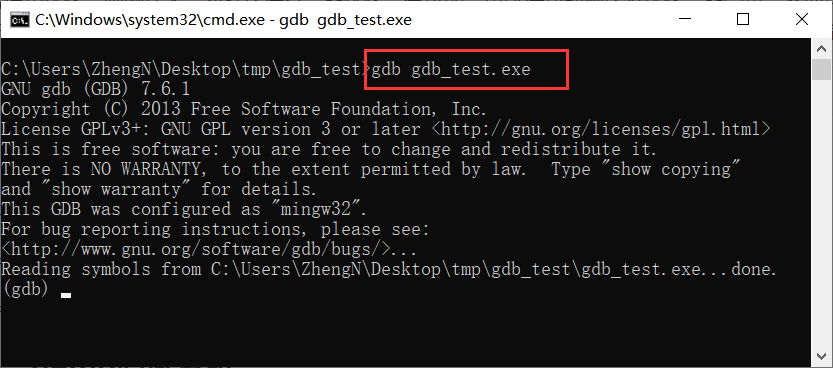
The other way is to directly input gdb + executable program to debug the program, i.e.:
(1) Debugging Test Function 1
Have you thought about the result of the above test function 1? Let’s step through the debugging to see what the result is:
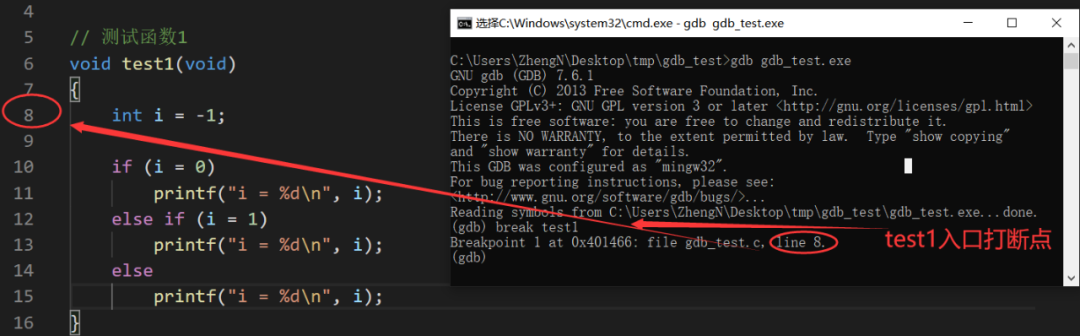
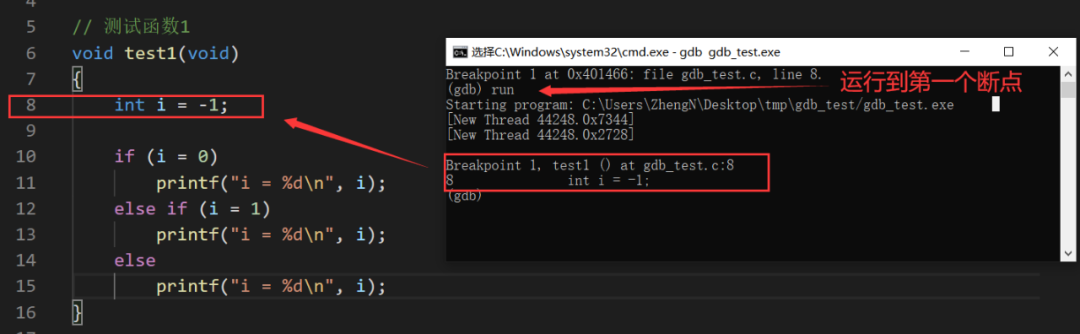
① Set a breakpoint at the entrance of the test1 function:
② Run to the breakpoint:
③ Step down to execute:
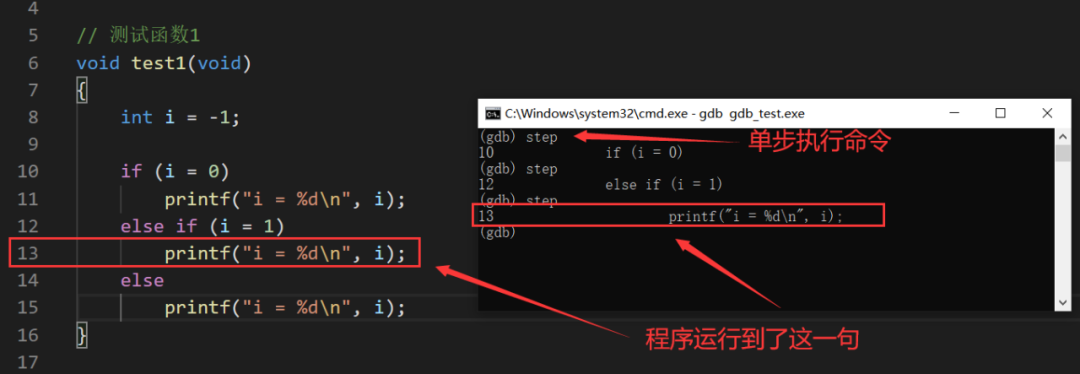
Clearly, after stepping through, we arrive at the statement which gives us the result of test function 1, i.e., output i = 1. Did you analyze it correctly?
This can easily be overlooked, as the condition in the if statement uses = instead of ==, which may confuse some beginners in C programming.
The general form of an if statement is:
if (expression)
 statement
It is clear that if the expression is true (non-zero), then the statement is executed. In this case, if (i = 0) is equivalent to:
i = 0;
if (i)
Clearly, the expression of the if statement is false, and the statement will not be executed.
Similarly, if (i = 1) is equivalent to:
i = 1;
if (i)
Clearly, the expression of the if statement is true, and the statement will be executed.
When you find that the code you wrote has an abnormal execution flow, consider debugging it step by step to see if the program follows the flow you designed and whether your execution logic is incorrect.
(2) Debugging Test Function 2
Test function 2 is also a classic interview question. Can’t see the result at a glance? No worries, let’s debug and analyze it together. Continuing from the previous process, we output the quit command to exit the gdb environment, and then re-enter to debug test2.
① Set a breakpoint at the entrance of the test2 function:
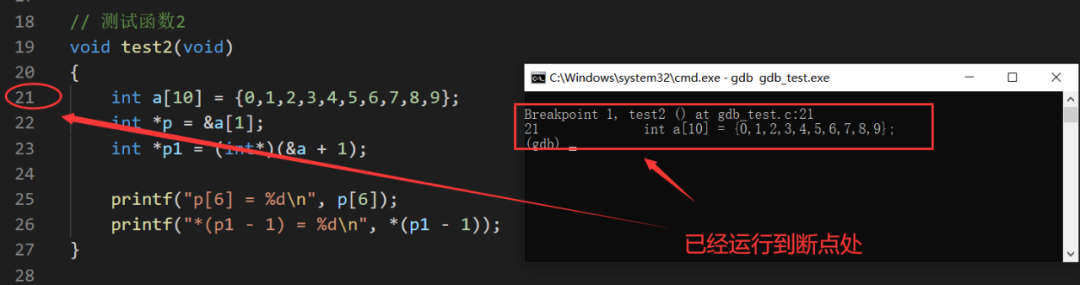
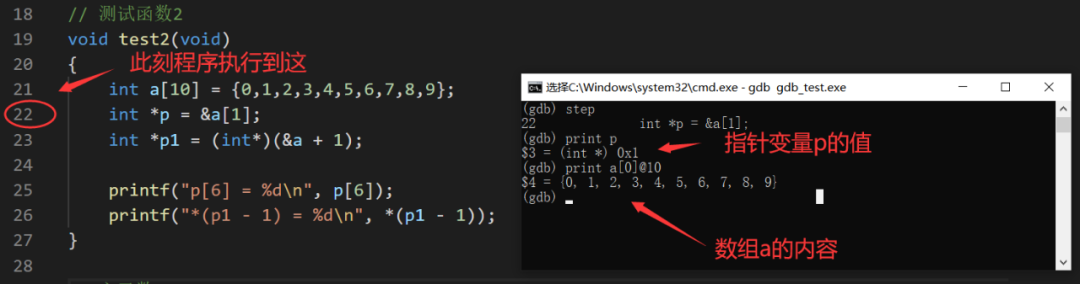
② Run to the breakpoint:

At this point, let’s take a look at the a[1] element's address and the contents of array a:
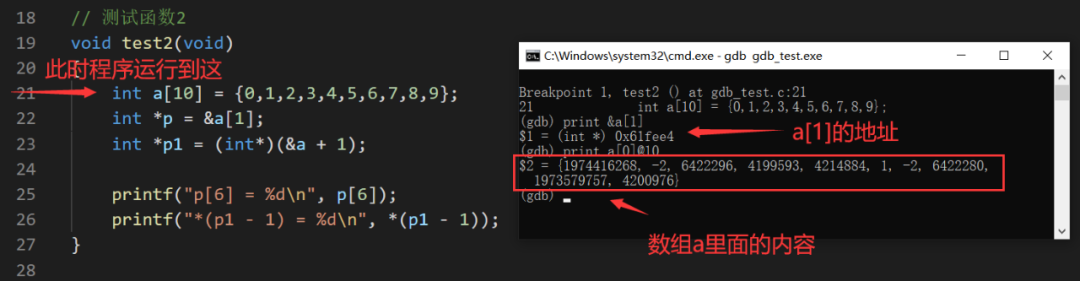
As seen, before the array is initialized, the values in the entire array space are random. This reflects a problem: local variables have unpredictable values before initialization, so it is advisable to initialize local variables with a definite value to prevent errors.
③ Step down to execute:
At this point, let’s look at the value of the pointer variable p and the values in the array a:
Since the statement on line 23 has not yet been executed, the value pointed to by p is not yet the address of a[1].
Continue stepping down, and then we look at the value of the pointer variable p and the values in the memory range defined by the pointer variable p:
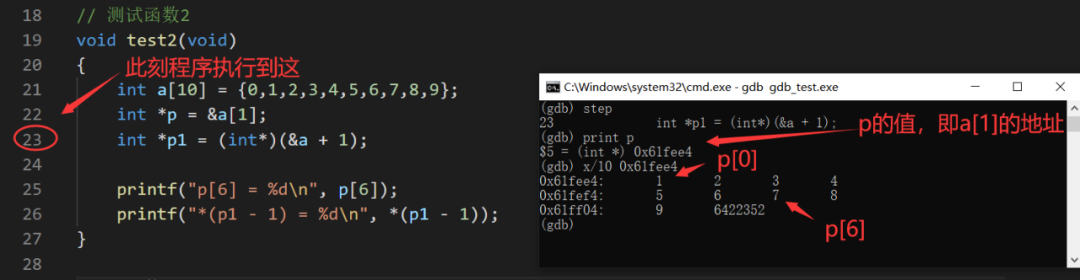
Thus, we have clearly obtained the value of p[6] through debugging.
Continuing to step down, we look at the values of &a[0], &a, (&a + 1), and p1:
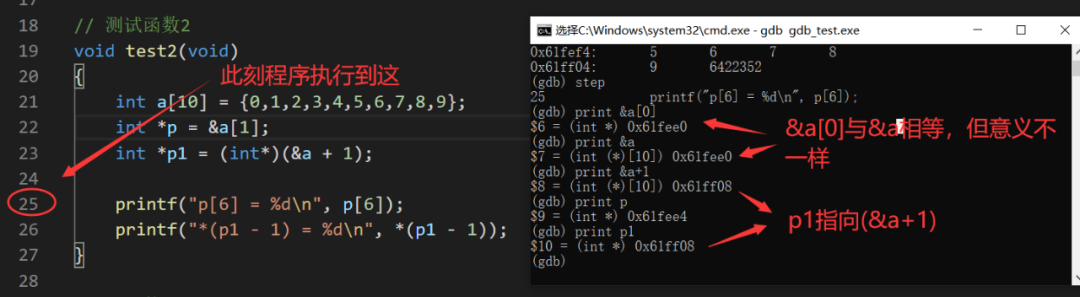
From the output information of gdb, we know that &a is of type (int (*) [10]), which is a pointer to an array of 10 integers. Therefore, (&a + 1) means moving forward by 10 * sizeof(int). Furthermore, using other output information:
&a's value is 0x61fee0
&a + 1's value is 0x61ff08
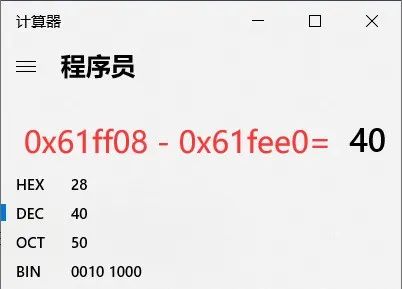
The difference between the two values is 40, which is exactly the number of bytes occupied by the entire array.
Since p1 is an integer pointer, the address pointed to by p1 – 1 is the address of a[9] (0x61ff04), so the value of *(p1 – 1) is also the value of a[9]. Finally, let’s look at the values in the next 40 addresses starting from &a:
That concludes this instance demonstration, which only uses a small portion of gdb commands. There are more commands you can practice using; once you grasp the basics, you can look up anything you don’t understand later.
It may be written somewhat chaotically, but I hope it can help everyone. In short, when encountering uncertain knowledge points or when the program execution does not match expectations, consider debugging it step by step to see if there are any anomalies in the data.
You May Also Like
Interviewer: How to Compile C Programs on Linux?
Essentials | Using Git: A Must-Have Skill for Embedded Systems
Practical Knowledge in Embedded Systems: JSON Data