gdb.Debugging C programs used to confuse me. However, when I was writing my operating system[1], I had many bugs to debug. I was fortunate to use the QEMU emulator, which allowed me to attach a debugger to my operating system. This debugger is gdb.
I need to explain that you can start with some small things using gdb, as I found it really confusing when I first learned it. We will set breakpoints and inspect memory in a small program.
1. Set Breakpoints
If you have ever used a debugger, you might already know how to set breakpoints.
Below is a program we are going to debug (although it has no bugs):
#include <stdio.h>
void do_thing() {
    printf("Hi!\n");
}
int main() {
    do_thing();
}
Save it as hello.c. We can debug it like this:
bork@kiwi ~> gcc -g hello.c -o hello
bork@kiwi ~> gdb ./hello
The above compiles hello.c with debug information (so that gdb can work better), and it gives us a prominent prompt like this:
(gdb)
We can use the break command to set breakpoints and then use run to start debugging the program.
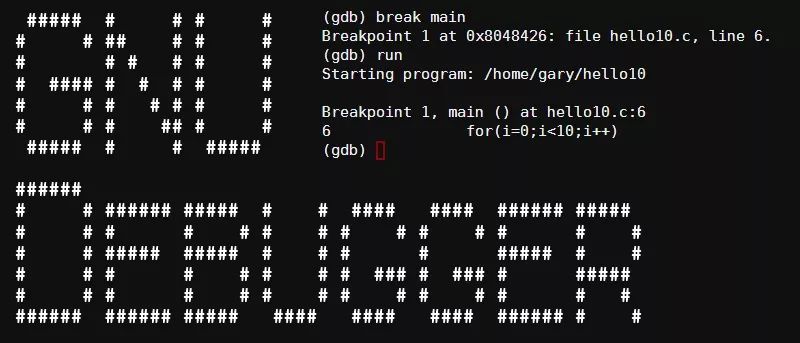
(gdb) break do_thing
Breakpoint 1 at 0x4004f8
(gdb) run
Starting program: /home/bork/hello

Breakpoint 1, 0x00000000004004f8 in do_thing ()
The program pauses at the start of do_thing.
We can use where to see where we are in the call stack.
(gdb) where
#0  do_thing () at hello.c:3
#1  0x08050cdb in main () at hello.c:6
(gdb)
2. Read Assembly Code
Using the disassemble command, we can see the assembly code for this function. Awesome, this is x86 assembly code. Although I don’t understand it very well, the line callq is the call to the printf function.
(gdb) disassemble do_thing
Dump of assembler code for function do_thing:
   0x00000000004004f4 <+0>:     push   %rbp
   0x00000000004004f5 <+1>:     mov    %rsp,%rbp
=> 0x00000000004004f8 <+4>:     mov    $0x40060c,%edi
   0x00000000004004fd <+9>:     callq  0x4003f0
   0x0000000000400502 <+14>:    pop    %rbp
   0x0000000000400503 <+15>:    retq
You can also use the abbreviation disas for disassemble.
3. Inspect Memory
When debugging my kernel, the main reason I used gdb was to ensure that the memory layout was as I expected. The command for inspecting memory is examine, or you can use the abbreviation x. We will use x.
By looking at the assembly code above, it seems that 0x40060c might be the address of the string we want to print. Let’s try it.
(gdb) x/s 0x40060c
0x40060c:        "Hi!"
Indeed. In x/s, the /s part means “display it as a string”. I can also “display 10 characters” like this:
(gdb) x/10c 0x40060c
0x40060c:       72 'H'  105 'i' 33 '!'  0 '\000'        1 '\001'        27 '\033'       3 '\003'        59 ';'
0x400614:       52 '4'  0 '\000'
You can see the first four characters are H, i, !, and \0, and what follows are some unrelated things.
I know gdb has many other features, but I still don’t understand it very well. However, x and break have helped me a lot. You can also read the documentation for examining memory[2].
via: https://jvns.ca/blog/2014/02/10/three-steps-to-learning-gdb/
Author: Julia Evans[4] Translator: Torival Proofreader: wxy
This article is originally compiled by LCTT and proudly presented by Linux China

< Swipe left and right to view related articles >


Click the image, enter the article ID, or scan the QR code to go directly