Original: https://blog.csdn.net/fangye945a/article/details/85254627
When developing C/C++ projects on the ARM and Linux platforms, you will inevitably encounter some bugs in your programs. Small projects are manageable, but for large projects with extensive code, it becomes challenging to pinpoint issues. This is where using the gdb debugger can help you easily locate code bugs.
Previously, I shared information about using GDB:
GDB Debugger Is Actually That Simple
A Step-by-Step Guide to Using VSCode + gdb + gdbserver to Debug ARM Programs
These can be read in conjunction.
1. Usage Method
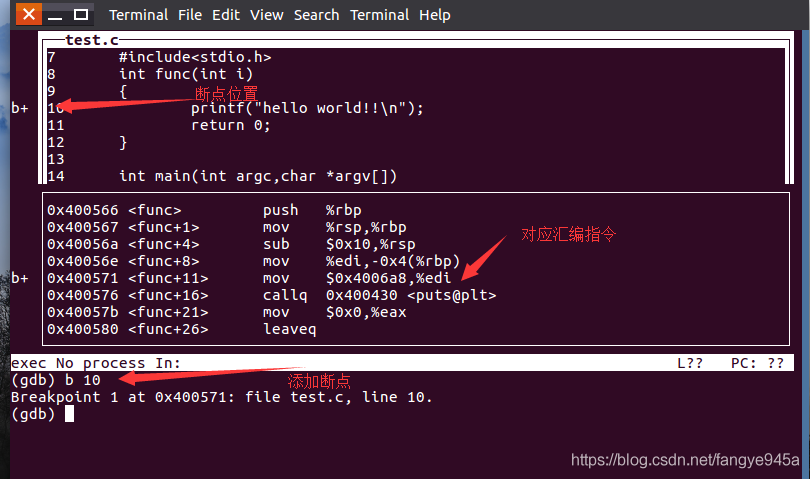
Below is an example code:
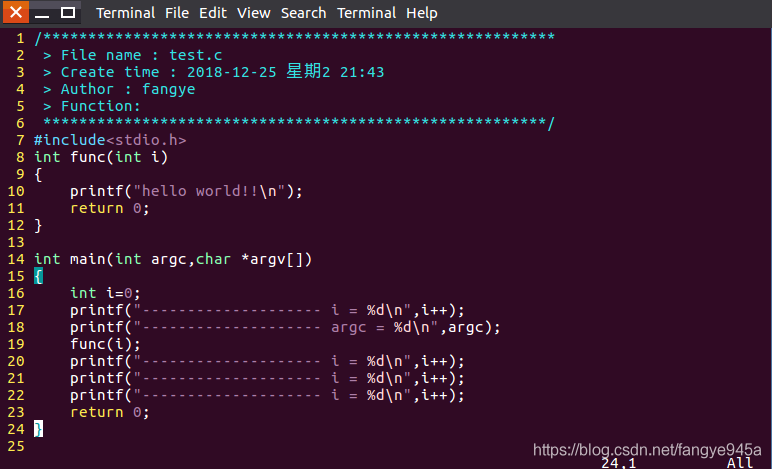
When compiling the code, add the debug option -g, as shown below:
gcc -g test.c -o test
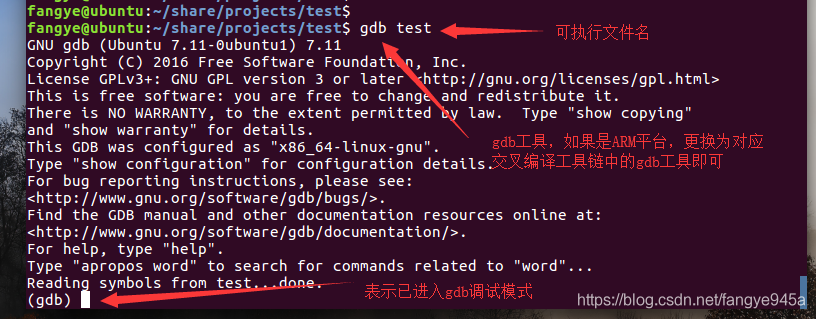
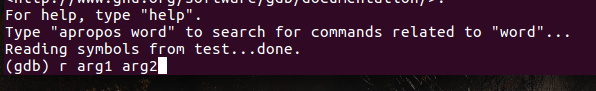
Use the gdb debugger to run the program: gdb <executable name>
2. Controlling gdb
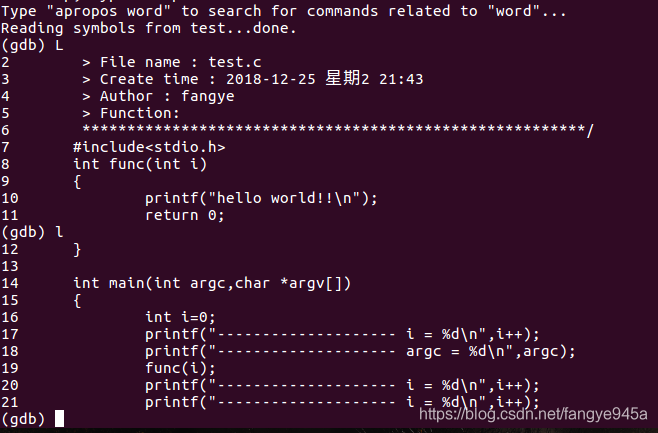
1. (gdb) l(L) to view the source code, (gdb) L 1 to start viewing from the first line.
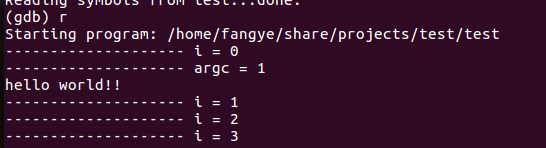
2. (gdb) r(run) to run the code from the beginning, automatically returning to the gdb command line upon hitting set breakpoints, segmentation faults, or program termination.
3. To run code with parameters, add them after r. For example: (gdb) r arg1 arg2
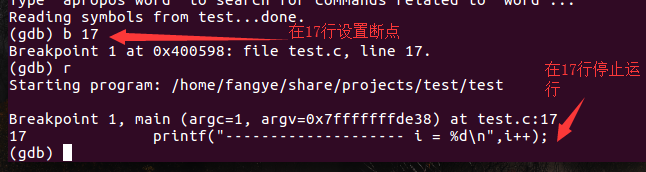
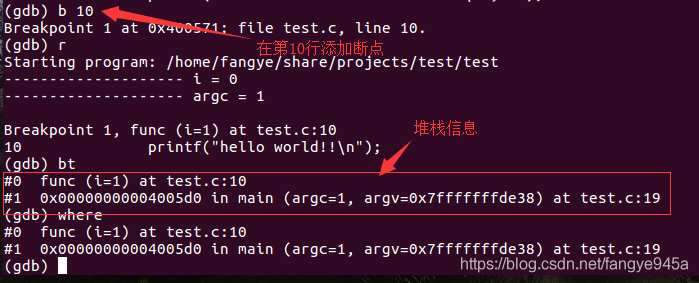
4. (gdb) b n to set a breakpoint at line n (the program will pause at this position).
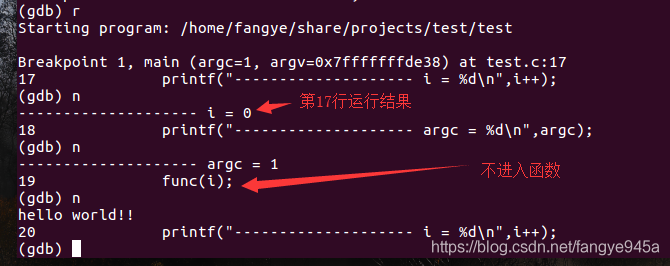
5. (gdb) n to execute the next line of code (will not enter functions).
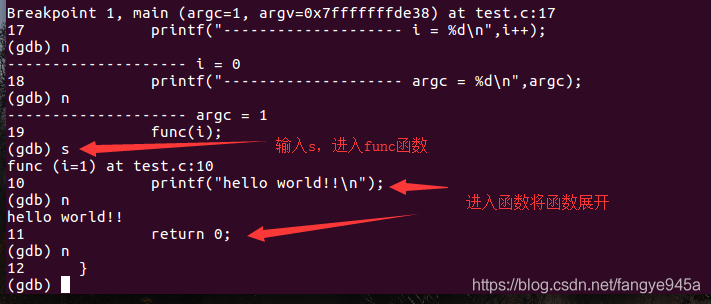
6. (gdb) s(step) to execute the next line of code (will enter functions and expand them).
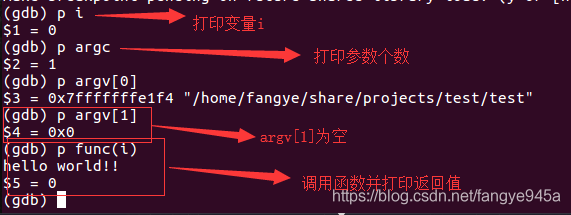
7. (gdb) p(print) <expression> to print the value of an expression, which can be any valid C language expression, such as a variable, number, function call, etc.
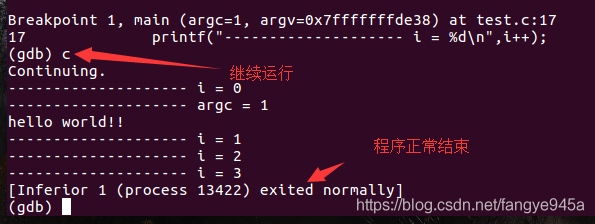
8. (gdb) c(continue) to continue running the program, automatically returning to the gdb command line upon hitting set breakpoints, segmentation faults, or program termination.
9. (gdb) bt or where to display the program stack information, generally used when encountering segmentation faults.
10. (gdb) q and then input y to exit gdb debugging.

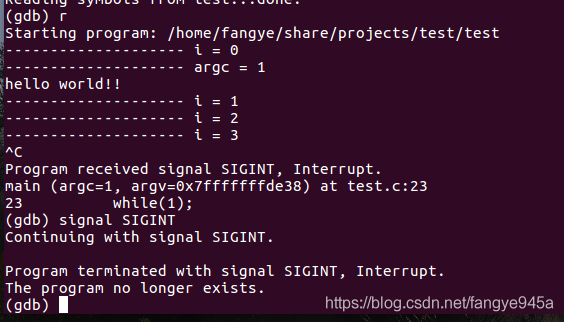
11. While the program is running, input ctrl+c to return to gdb debugging mode, and input (gdb) signal <signal> to send a signal to the program.
12. (gdb) layout split to display the source code and assembly window, allowing you to see the breakpoint location and debug the code more intuitively.
3. Related Links
Program Compilation:
https://blog.csdn.net/csdn_kou/article/details/81407195
More gdb Usage:
https://blog.csdn.net/yimingsilence/article/details/72153049
http://www.cnblogs.com/qigaohua/p/6077790.html
Debugging Multi-file Programs:
https://blog.csdn.net/niepangu/article/details/52887803
https://blog.csdn.net/timsley/article/details/51000667
Debugging Multi-threaded Programs:
http://www.cnblogs.com/lsgxeva/p/8078670.html
Copyright Statement: This article is sourced from the internet, freely conveying knowledge, and the copyright belongs to the original author. If there are any copyright issues, please contact me for deletion.
You May Also Like:
Practical | How to Remotely Log In to Development Boards?
Practical | Teach You to Build an Embedded Web Server in 10 Minutes
Practical | Teach You to Turn on Lights via Webpage in 10 Minutes
GDB Debugger Is Actually That Simple
A Step-by-Step Guide to Using VSCode + gdb + gdbserver to Debug ARM Programs
Reply with 1024 in the WeChat public account chat interface to get embedded resources; reply m to view the article summary.