Visual Interface Development with Node-RED: Framework Introduction and Data Flow Deployment

Visual Interface Development with Node-RED: Framework Introduction and Data Flow Deployment

Introduction to Node-RED Framework and Data Flow Deployment

We have previously introduced the basics of Node-RED, including login functionality. Today, we will learn about the specific framework of the open-source visual development tool Node-RED and how to deploy the first data flow.

1

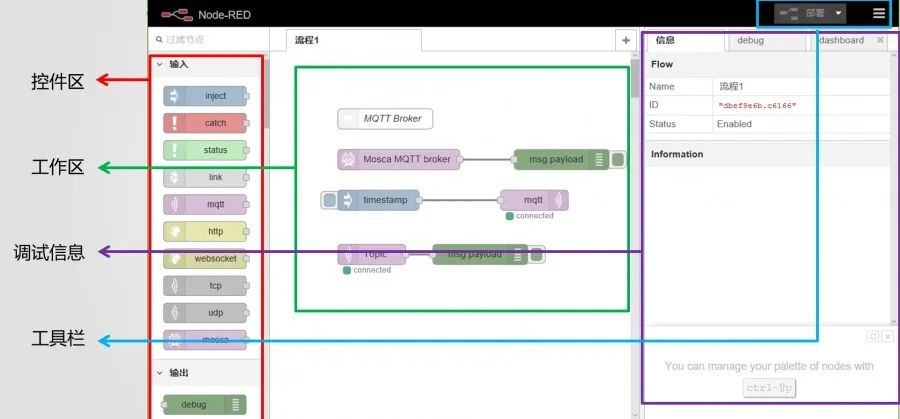
Introduction to the Interface Framework

The data flow editing interface consists of four parts. The leftmost part is a list of various defined nodes, which we call the control area. The middle is a workspace where users can drag and drop nodes to create instances of nodes. Node-RED assigns a unique ID to each node instance, and users can edit individual instances by double-clicking on them. Data flows are created by connecting the in and out of nodes, and node instances will record the information of the outgoing connections. Each line records the target node instance information. The rightmost part is the debug node output area and the help information display area for nodes. In the upper right corner, there is a “deploy” button to save and execute the written program.
Visual Interface Development with Node-RED: Framework Introduction and Data Flow Deployment

Visual Interface Development with Node-RED: Framework Introduction and Data Flow Deployment

2

Deployment of the First Data Flow

Almost all programming-related tutorials like to start with a hello world example, so the deployment of the first data flow in Node-RED also starts here.

(1) Drag and Drop Input and Output Nodes:

After entering Node-RED, drag the input node “inject” and the output node “debug” from the control area into the workspace using the left mouse button. After dragging in, you will find that “inject” becomes “timestamp” and “debug” becomes “msg.payload”. This is a normal phenomenon. If your computer or Raspberry Pi is running in an English environment, the names of the nodes in the workspace will naturally change to English.

(2) Change Node Configuration:

Double-click the timestamp node to enter the node configuration interface.

Visual Interface Development with Node-RED: Framework Introduction and Data Flow Deployment

Click the dropdown menu (small triangle) after the content option, select text string from the menu, and enter “hello world” in the input box.

You can see that at this time, the name of the “timestamp” node is displayed as “hello world”.

Visual Interface Development with Node-RED: Framework Introduction and Data Flow Deployment

(3) Connect Input Node and Output Node:

In Node-RED, “flow” represents the direction of data flow. Using the mouse, press and hold the left button to connect from interface 1 to interface 2 in the above image, which completes the connection of the input and output nodes. Connecting the input and output nodes with a line is probably the simplest and most intuitive way to construct a data flow.

Visual Interface Development with Node-RED: Framework Introduction and Data Flow Deployment

(4) Node Deployment:
The deploy button is located in the upper right corner of the interface, and the dropdown menu has the following options:

Visual Interface Development with Node-RED: Framework Introduction and Data Flow Deployment

Clicking deploy will display a successful deployment message.

Visual Interface Development with Node-RED: Framework Introduction and Data Flow Deployment

(5) Debugging:
There is a small button on the left side of the timestamp node. Clicking the button can manually inject messages, and the injected message is the text string of the input node. Before clicking the button on the timestamp node, ensure that the debug node is available, meaning the button must be “sticking out” (as in blue box 2) and not “retracted” (as in blue box 3), as a retracted debug node will not work. Clicking the button can toggle whether the node is working.

Visual Interface Development with Node-RED: Framework Introduction and Data Flow Deployment

Click the button on the left side of the timestamp node to send the message, and click the debugging window in the upper right corner (the small bug button) to view the output message.

Visual Interface Development with Node-RED: Framework Introduction and Data Flow Deployment

Visual Interface Development with Node-RED: Framework Introduction and Data Flow Deployment

3

Manually Editing JSON Format Output

In the timestamp node, the input content can not only be selected as text strings or numbers but can also output in JSON format. You can manually edit the JSON formatted code to output messages in JSON format.

Visual Interface Development with Node-RED: Framework Introduction and Data Flow Deployment

Click the three dots marked in blue on the content line in the image to enter the JSON editor. Enter the JSON formatted code:

Visual Interface Development with Node-RED: Framework Introduction and Data Flow Deployment

After entering, click format JSON to check for errors. Once completed, click deploy. Click the button on the left side of the timestamp to send a JSON formatted message, which will be displayed in the debugging window.

Visual Interface Development with Node-RED: Framework Introduction and Data Flow Deployment

Visual Interface Development with Node-RED: Framework Introduction and Data Flow Deployment

Previous Issues Review

  • Visual Interface Development with Node-RED【02】——Setting Panel Login Username and Password

  • Visual Interface Development with Node-RED【01】——Node Introduction

  • Visual Interface Development——Node-RED Environment Setup

  • If I could make a counterfeit EUV lithography machine, would the country accuse me of selling counterfeit goods?

  • NB-IoT, Cat.1, 5G Will Welcome a New Wave of Development

  • Today, it’s the one-year anniversary of the Little Bear Package!

  • The number of NB-IoT connections in the country has exceeded 100 million. Is that slow or fast?

Leave a Comment

×