In 2021, I introduced the basic principles and configuration of the Zephyr tracing system in two articles: Introduction to Zephyr Tracing System – Part 1 and Configuration and Invocation Framework of Zephyr Tracing System – Part 2. At that time, Percepio only offered paid software, so I did not continue writing about how to use the Trace system. Three years later, Percepio has provided the free Percepio View tool for Zephyr, and this article will introduce how to use the Percepio View tool to trace Zephyr.
Percepio View
Percepio is an active member of the Zephyr community, contributing and continuously maintaining the TraceRecorder library in Zephyr, which helps developers observe the real-time performance of applications using the Zephyr RTOS. Recently, they have made Percepio View available as a free tool for the Zephyr community to assist developers in building better real-time applications. Compared to Percepio Tracealyzer, Percepio View has more limited functionality, offering only four features: Trace View, Event Log, CPU Load, and User Event Show, with the CPU Load and User Event Show features requiring free registration to use.
For more comparisons of Percepio tracing tool products, refer to Comparison Link[1]
Download & Installation
The download link for Percepio View is: https://traceviewer.io/get-view/, currently available for Windows and Linux versions. I am using Ubuntu, so this article will provide instructions for Linux.
Linux has two versions: standalone and requires Mono. It is recommended to download the standalone version directly. The specific link is: https://download.tracealyzer.io/PercepioViewForZephyr-4.10.3-linux-standalone-x86-64.tgz
After downloading, the installation steps are as follows:
1. Extract to the specified directory
tar -zxvf PercepioViewForZephyr-4.10.3-linux-standalone-x86-64.tgz -C ~/portable
2. Enter the directory to install the certificate; this step is very important, as failing to execute it will result in the serial number not being activated later
cd ~/portable/PercepioViewForZephyr-4.10.3/
sudo ./cert-sync cacerts_from_mozilla.pem
3. Run the following command to execute Percepio View
./launch-tz.sh
You should see the following interface:
 4. Register for Percepio View Registration is free, and you need to register to access the CPU Load Graph and User Event features. The first time you start Percepio View, a registration link will be provided. If you do not receive it, you can visit https://traceviewer.io/register-view/?target=zephyr to register. After successful registration, the license key will be sent to your email. In Percepio View, select Help->Enter License Details, and enter the license key in the pop-up dialog. If you encounter the following error when activating the license key:
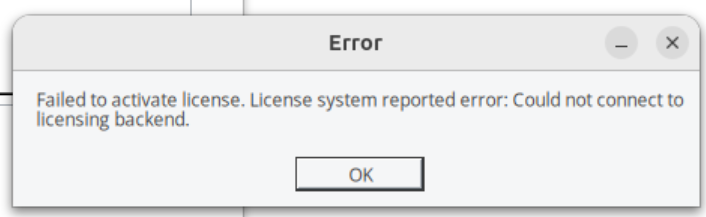 it may be due to not adding the certificate (refer to step 2) or the 443 port being disabled (unlikely).
Using TraceRecorder in Zephyr
In Zephyr, the TraceRecorder is used to capture the trace data of the RTOS operation, and Percepio View can analyze the RTOS’s operational status using this trace data.
Configuration
Percepio View only supports snapshot analysis and does not support streaming real-time analysis. Therefore, adding the following configuration in Zephyr is sufficient:
CONFIG_TRACING=y
CONFIG_PERCEPIO_TRACERECORDER=y
CONFIG_PERCEPIO_TRC_CFG_STREAM_PORT_RINGBUFFER=y
CONFIG_PERCEPIO_TRC_CFG_STREAM_PORT_RINGBUFFER_SIZE=204800
Among them, <span>CONFIG_PERCEPIO_TRC_CFG_STREAM_PORT_RINGBUFFER_SIZE</span> sets the size of the trace data ring buffer. By default, when it is full, it will overwrite old data. The size should be adjusted according to the actual memory situation of the hardware.
Data Capture
In Zephyr, the TraceRecorder uses <span>RecorderDataPtr</span> to point to the ring buffer structure <span>struct TraceRingBuffer</span>, and Percepio View obtains all trace data by accessing this structure. There are many methods to dump this structure’s data in Zephyr. The most commonly used are gdb and j-link. This article will explain the gdb dump based on the esp32-c3.
esp32-c3 jtag/gdb
The esp32-c3 has a built-in jtag, which can be directly connected to the USB port through pins.
- Connect the esp32-c3 jtag to the computer, following the table below:
- GPIO18 – D-
- GPIO19 – D+
- 5V – VCC
- GND – GND
2. Install openocd The openocd in Zephyr does not support esp32-c3; you need to use the version released by Espressif, which can be downloaded from https://github.com/espressif/openocd-esp32/releases and extracted to<span>/home/frank/portable/openocd-esp32/</span>
3. Start openocd
export PATH=/home/frank/portable/openocd-esp32/bin:$PATH
openocd -f board/esp32c3-builtin.cfg
After successful startup, you will see the following information:
Open On-Chip Debugger v0.12.0-esp32-20250422 (2025-04-22-13:02)
Licensed under GNU GPL v2
For bug reports, read http://openocd.org/doc/doxygen/bugs.html
Info : only one transport option; autoselecting 'jtag'
Info : esp_usb_jtag: VID set to 0x303a and PID to 0x1001
Info : esp_usb_jtag: capabilities descriptor set to 0x2000
Info : Listening on port 6666 for tcl connections
Info : Listening on port 4444 for telnet connections
Info : esp_usb_jtag: serial (84:F7:03:A6:F0:60)
Info : esp_usb_jtag: Device found. Base speed 40000KHz, div range 1 to 255
Info : clock speed 40000 kHz
Info : JTAG tap: esp32c3.tap0 tap/device found: 0x00005c25 (mfg: 0x612 (Espressif Systems), part: 0x0005, ver: 0x0)
Info : [esp32c3] datacount=2 progbufsize=16
Info : [esp32c3] Examined RISC-V core; found 1 harts
Info : [esp32c3]  XLEN=32, misa=0x40101104
Info : [esp32c3] Examination succeed
Info : [esp32c3] starting gdb server on 3333
Info : Listening on port 3333 for gdb connections
4. Compile and start gdb
The Zephyr SDK includes gdb, so there is no need to install it separately. After compiling, you can connect and start it directly using the debug command.
west build -b esp32c3_devkitc zephyr/samples/synchronization/
west debug
If gdb starts normally, you will see the following information:
Type "apropos word" to search for commands related to "word"...
Reading symbols from /home/frank/work/zpro/zephyrproject/build/zephyr/zephyr.elf...
Remote debugging using :3333
0x40000000 in ?? ()
Register cache flushed.
JTAG tap: esp32c3.tap0 tap/device found: 0x00005c25 (mfg: 0x612 (Espressif Systems), part: 0x0005, ver: 0x0)
[esp32c3] Reset cause (3) - (Software core reset)
Hardware assisted breakpoint 1 at 0x420000be: file /home/frank/work/zpro/zephyrproject/build/zephyr/include/generated/zephyr/syscalls/kernel.h, line 84.
(gdb)
Dumping Trace Data
In gdb, execute the <span>c</span> command to let the system run for a while, then pause the execution with ctrl+c. In gdb, execute the following command to dump the data pointed to by <span>RecorderDataPtr</span> to trace.bin:
dump binary value trace.bin *RecorderDataPtr
During the dump, gdb may prompt the following error:
The value of type `RecorderData’ requires 207596 bytes, which is more than max-value-size
This is because gdb’s default <span>max-value-size</span> is 64K. You need to modify <span>max-value-size</span> to be larger than RecorderData. You can execute the following command to resolve this:
set max-value-size sizeof(*RecorderDataPtr)
Analyzing Data with Percepio View
Open the trace.bin file through File->Open to load the trace data and display it.
However, to display it correctly, some additional configuration is required.
Configuration
When directly opening the trace.bin file, Percepio View will prompt:
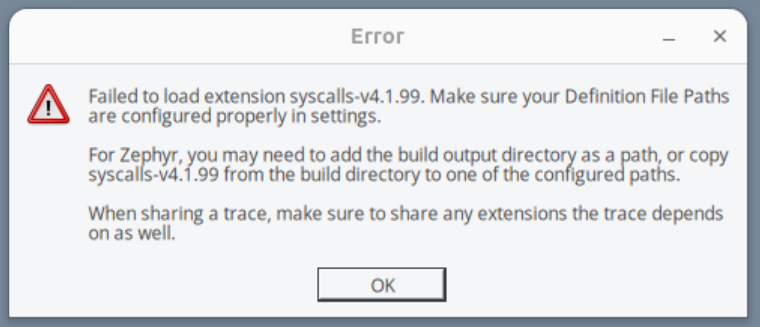
This is because Percepio View requires the syscalls.xml file, which is located in the Zephyr <span>build</span> directory. You need to add the path to the Zephyr build directory through File->Settings->Define File Path 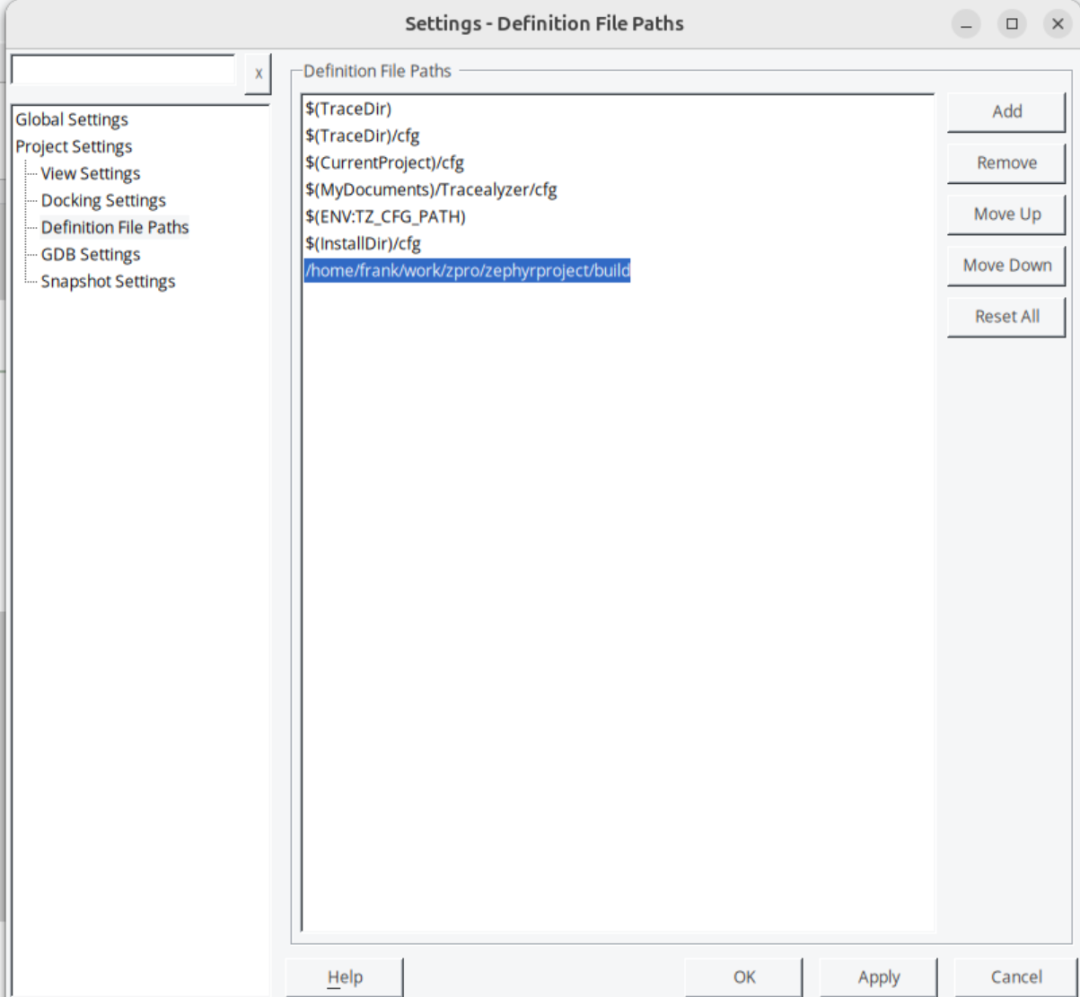
Snapshot
From the previous steps, we know that to capture data, we need to use gdb, and using command line each time is not very convenient. Percepio View provides a Snapshot interface, and after configuring the gdb startup parameters, you can directly capture data through the Snapshot interface, which will automatically update the analysis interface.
Configuring GDB Snapshot
Percepio View only provides an interface for calling gdb; the actual gdb still needs to be configured by the user. In File->Settings->GDB Settings, configure the gdb startup parameters.
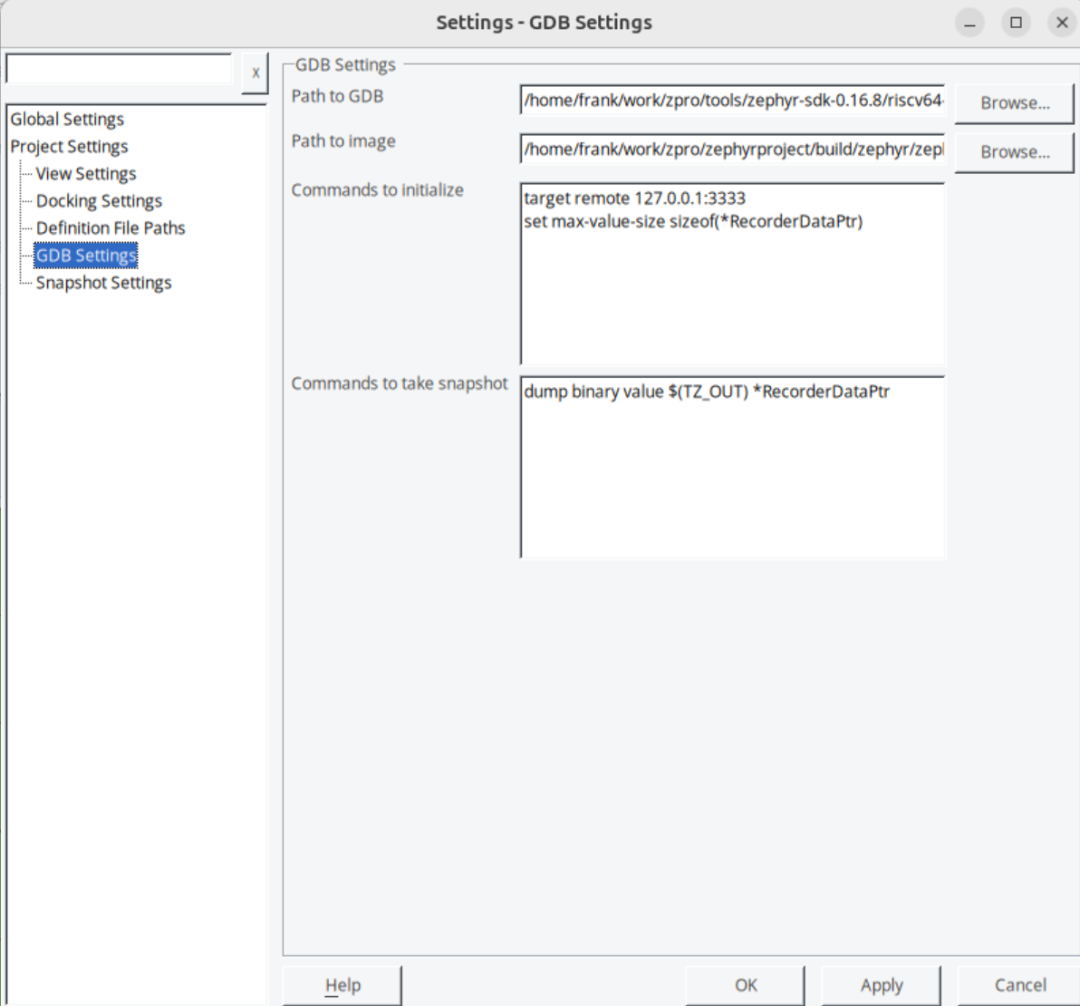
- Path to GDB: This is the gdb of the cross-toolchain. For esp32c3, which is a RISC-V core, you can choose the one provided by the Zephyr SDK: /home/frank/work/zpro/tools/zephyr-sdk-0.16.8/riscv64-zephyr-elf/bin/riscv64-zephyr-elf-gdb
- Path to Image: This is the elf file that gdb will analyze, select the final build result of Zephyr: /home/frank/work/zpro/zephyrproject/build/zephyr/zephyr.elf
- Commands to initialize: These are the commands to be executed when gdb starts:
<span>target remote 127.0.0.1:3333</span>Connect to the gdbserver on the device<span>set max-value-size sizeof(*RecorderDataPtr)</span>Modify the maximum dump size to avoid dump failure- Commands to take snapshot: This is the gdb command for the snapshot, which is the command to execute when dumping data.
Capturing Data
Open the Snap interface through Trace->Open Snapshot Tool, select GDB for the Snapshot Engine, and then click the Read Snapshot button. This will execute the gdb command to capture data and update the interface.
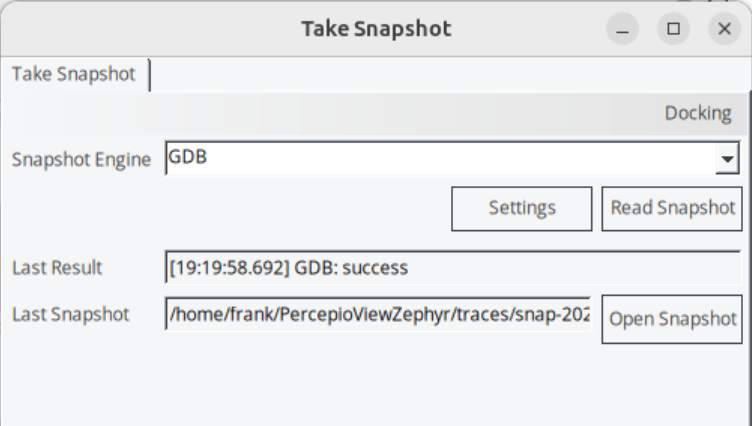
If executed successfully, the Last Result will indicate success and the time taken, and the Last Snapshot will indicate the location of the saved snap file. At the same time, Percepio View will also update the analysis of the newly captured data.
Analysis
Percepio View’s functionality is relatively simple and easy to grasp. Here is a basic introduction:
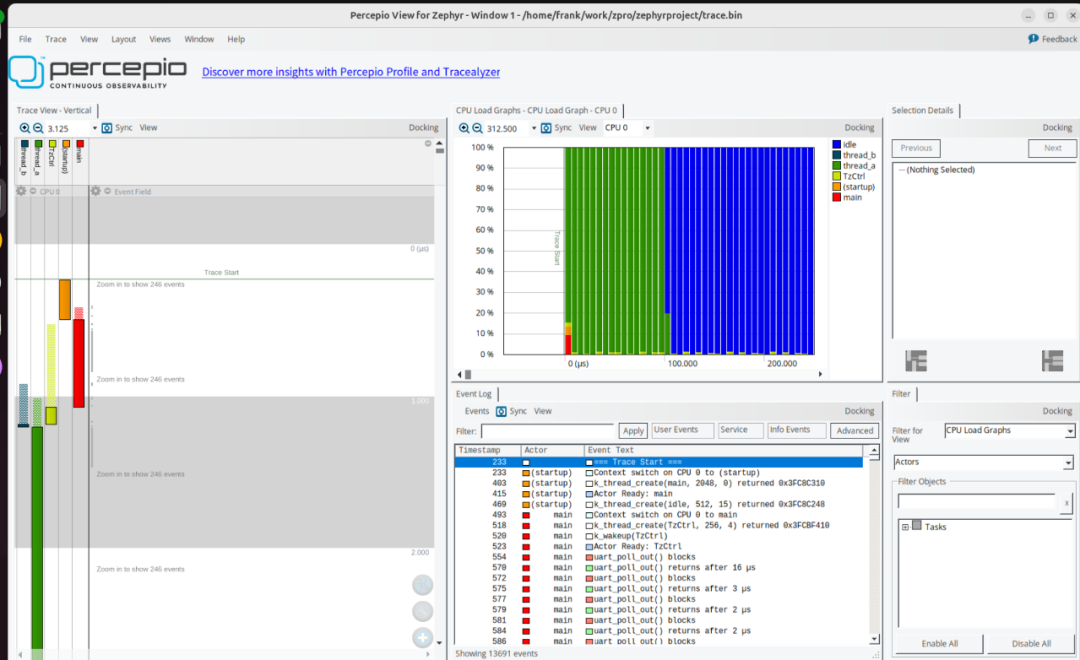
Trace View
The Trace View displays a graphical timeline of thread execution, interrupt handlers, kernel API calls, and custom user event logs. This feature allows you to observe whether threads are running as expected and whether thread scheduling priorities are appropriate.
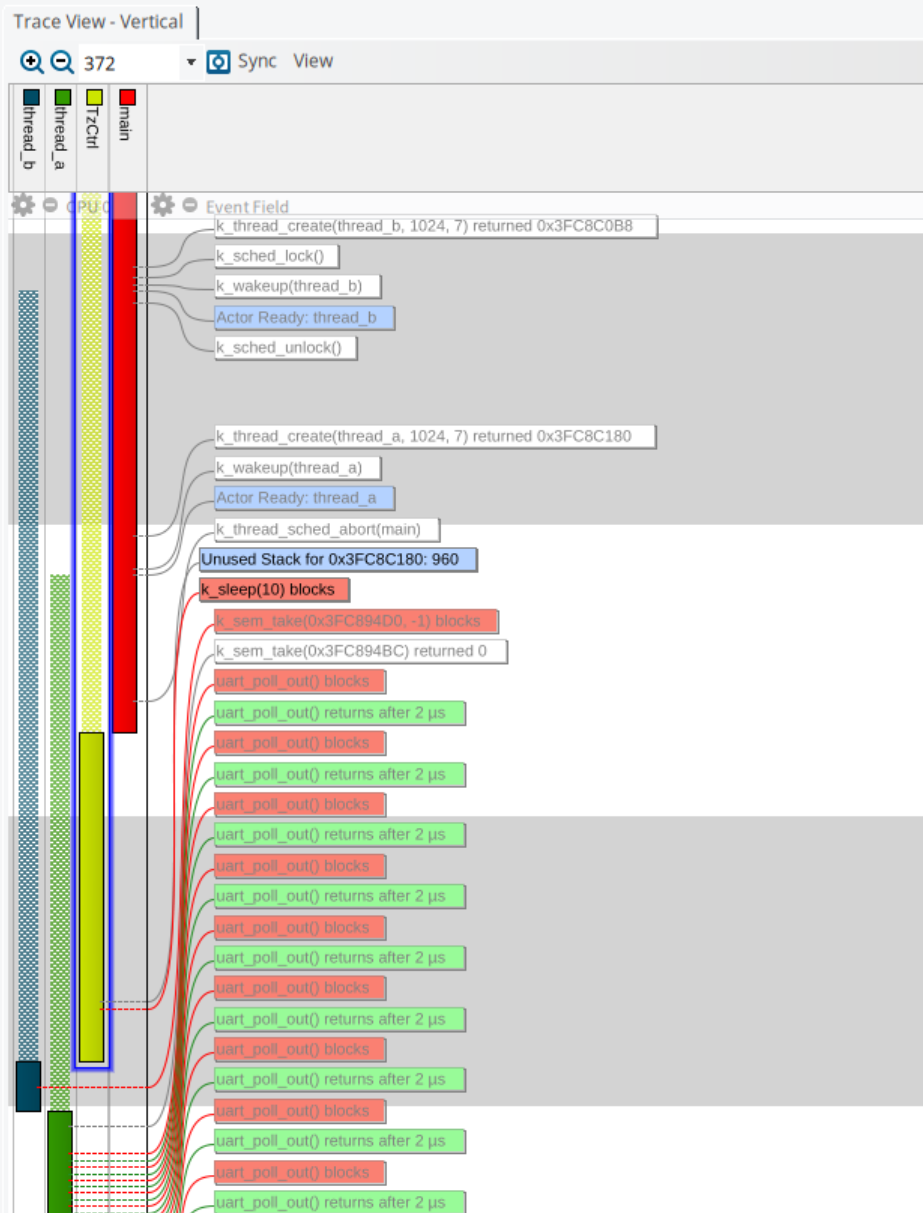
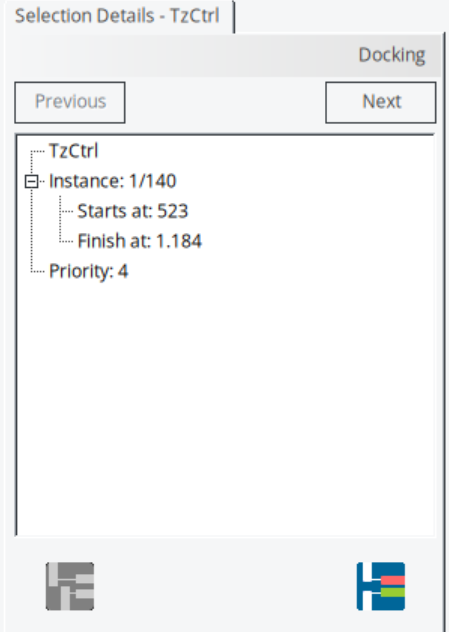
In the above image, blocks of one color represent a thread, with dotted blocks indicating the thread is ready and solid blocks indicating the thread is running. Clicking on a thread’s block will display the events that occurred during that thread’s execution. Meanwhile, in the Selection Details window, you can see the current CPU time and priority occupied by that thread:
CPU Load Graph
This graph displays the relative CPU time used by each thread and interrupt handler, as well as the overall CPU usage. It helps identify hotspots of high CPU load for optimization that can yield the greatest performance improvements.
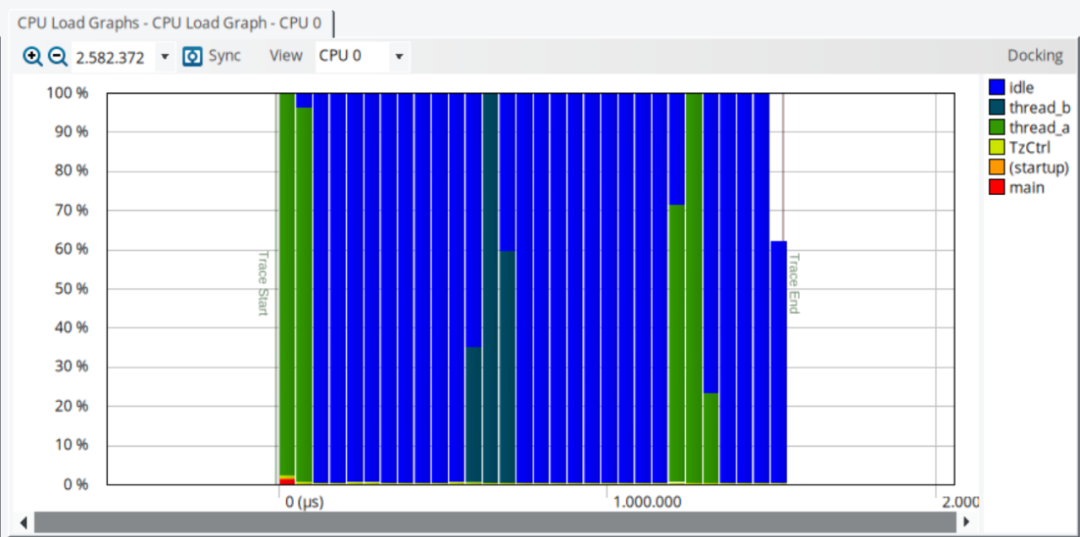
In the above image, thread_a and thread_b show moments of high CPU loading. If the application experiences occasional stuttering, you can investigate these two threads for optimization.
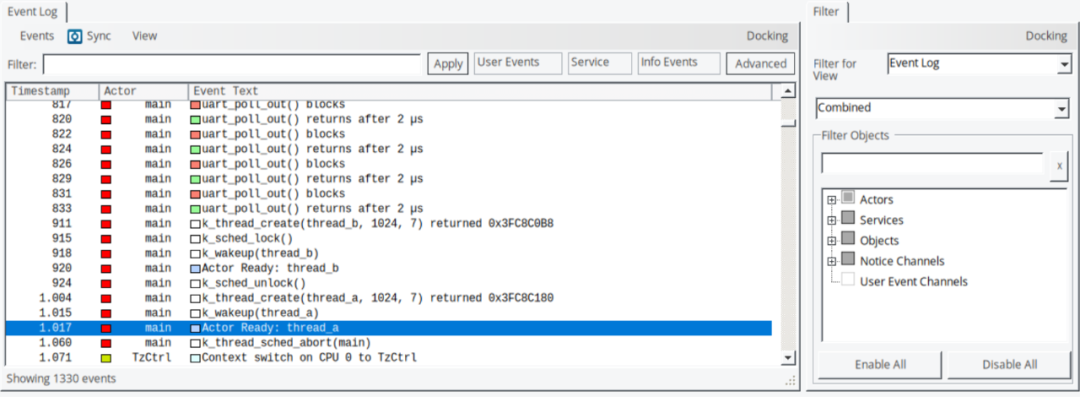
Event Show
This feature displays a list of recorded events, including kernel events and user events, making it easy to search and filter. In the Trace, double-clicking an event will highlight the corresponding event in the Event window, and vice versa.
Conclusion
In summary, my experience using Percepio View on Zephyr is as follows:
- Although Percepio View is free, its functionality is limited, making it suitable for viewing the working relationships between kernel objects and analyzing the load of the Zephyr system.
- As long as the Zephyr board supports gdb, Percepio View can be used, but it is not plug-and-play; some issues need to be addressed (as described in this article).
- Currently, I have tested the TraceRecorder on ARM/RISC-V architectures under Zephyr, and it works normally, but on Xtensa architecture, the TraceRecorder causes thread switching failures.
References
https://traceviewer.io/getting-started-zephyr-view/https://www.zephyrproject.org/tracing-zephyr-applications-with-percepio-view/
References
[1]
Comparison link: https://traceviewer.io/feature-comparison/
This article is reprinted from HalfCoder. Click here to read the original article for more information.

Scan to apply for KubeCon + CloudNativeCon end-user tickets.

(Free invitation tickets are limited and available on a first-come, first-served basis.)
2024 China KubeCon + CloudNativeCon + Open Source Summit + AI_dev exciting content

Contact Linux Foundation APAC
The Linux Foundation is a non-profit organization and an important part of the technology ecosystem.
The Linux Foundation supports the creation of a sustainable open-source ecosystem by providing financial and intellectual resources, infrastructure, services, events, and training. Through collaborative efforts in the creation of shared technologies, the Linux Foundation and its projects have formed extraordinarily successful investments. Please follow the LFAPAC (Linux Foundation APAC) WeChat public account.