Local Operating System: macOS / Linux / Windows for GDB, macOS / Linux for LLDB
Remote Operating System: Any operating system supporting gdbserver for GDB, macOS / Linux or other operating systems supporting lldb-server for LLDB
Required Tools: gdbserver or lldb-server on the target machine
Binary and Symbol File Synchronization: Manual
Client Debugger: Bundled GDB or Bundled LLDB, GDB from the toolchain, Custom GDB

Remote debugging configuration allows you to debug remotely under gdbserver or lldb-server. Use this configuration if you already have an executable with debugging information and do not need CLion to build the project for you. This configuration does not depend on a specific build system or project format.
The terms we use below: the local machine (host) is where you run CLion and the GDB/LLDB client, while the remote machine (target) is where you start the application under gdbserver/lldb-server.
With this configuration, you can remotely debug applications built by any build system. The only requirement is that debugging symbols must be present on the local machine.

👇 Click to receive 👇
👉 C Language Knowledge Material Collection

Target Platform GDB/gdbserver has no target environment restrictions as long as it supports gdbserver.
Your program can run remotely on any operating system, including Linux-based embedded systems, cloud platforms, or within Docker containers. You can connect to any GDB stub that complies with the remote gdbserver protocol, for example, using Qemu to debug the operating system kernel or using OpenOCD to debug flashed firmware.
The bundled GDB in CLion is used as the client debugger by default, with multi-architecture support suitable for various remote cross-platform debugging scenarios on Linux/Windows/macOS and embedded systems. Here is the complete list of supported targets.

LLDB/lldb-server You can target platforms such as macOS, Linux, Android, Apple TV/Apple Watch that support lldb-server.

Bundled GDB supported remote targets: i686-pc-mingw32, i686-w64-mingw32, x86_64-w64-mingw32, i686-linux-gnu, x86_64-linux-gnu, aarch64-linux-gnu, alpha-linux-gnu, arm-linux-gnu, arm-linux-gnueabi, arm-linux-gnueabi, hppa-linux-gnu, ia64-linux-gnu, m68k-linux-gnu, m68k-rtems, mips-linux-gnu, mipsel-linux-gnu, mips64-linux-gnu, mips64el-linux-gnu, powerpc-linux-gnu, powerpc-linux-gnu, spe

Workflow Overview Here is a brief description of the steps required to perform remote GDB/LLDB debugging. More details on each step will be provided in the next chapter.
Prepare a binary file with debugging information. If necessary, use a cross-platform toolchain.
In the case of remote LLDB, the debugger does not automatically download any debug symbols or system libraries, so these should be present on the local machine. For cross-platform debugging from macOS to Linux or from Linux to macOS, cross-compile via musl (or alternatives) which will come with the required libraries.

Ensure that the binary file is placed on the remote machine, and the symbol file is on the local machine.
Typically, the debug executable itself can serve as the symbol file, or this can be a separate file.
Since the remote debugging configuration does not synchronize your files, you need to keep track of the binary and symbol files and manually synchronize them whenever there are changes.

In CLion, create a remote debugging configuration. The settings you specify are crucial for the debugger to be able to stop at breakpoints during the remote session, so we recommend checking the settings configuration carefully.
Start the program on the remote machine to run under gdbserver/lldb-server.
Back in CLion, start debugging the configuration you created in step 3.

Create a remote debugging configuration Go to Run | Edit Configurations, click , and select Remote Debug from the template list.

Specify the following settings:
-
Debugger
Select client debugger: Bundled GDB / Bundled LLDB, a GDB debugger from the toolchain, or a custom GDB binary.
-
‘target remote’ parameter (‘process connect’ url for LLDB)
In this field, provide the connection to the remote system.
For GDB, this is the IP address followed by the port number (like in our example) or connection details in another format.
For LLDB, use the connect://host:port syntax, for example connect://127.0.0.1:1234.
-
Symbol File
This is the path to the file with debugging symbols on the local machine, which can be an unstripped copy of the executable running on the target or an ELF file containing only debug information.
If you are debugging a shared object library, avoid specifying the .so file as the symbol file. When .so is specified as the symbol file, the debugger resolves the source location to two places: one is the actual address in memory, and the other is the file address within the .so file, which is not a valid memory address. As a result, stepping and other debugging actions cannot be performed correctly.
New versions of GDB and LLDB clients can automatically transfer symbols from gdbserver, so leaving this field blank may also work well if the executable running on the target is an unstripped binary.
-
Path Mapping
Use this panel to provide path mappings from the target machine (remote column) to local paths on the host (local column).
-
Sysroot
Sysroot is used by GDB/LLDB clients to access the local system copy of target libraries with debugging symbols (to set breakpoints in library code and find source lines).
Most new versions of GDB and LLDB can automatically download files, so you are not required to specify this field. However, note that automatic downloading may significantly slow down the debugging process.
If you choose to manually copy libraries to a non-default local directory and want GDB to use them, set the path in this field.
Remotely Start Programs Under gdbserver/lldb-server
-
To start your application on the target, you can use a remote terminal or invoke CLion’s built-in SSH terminal (run Tools | Start SSH session and provide credentials).
GDB and LLDB:
Run gdbserver with two parameters:
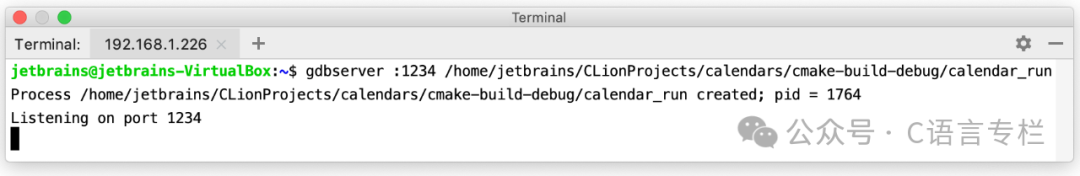
-
Device name (for serial line connection) or TCP hostname with port number (e.g., below :1234).
-
Path and filename of the executable to be debugged, followed by program input parameters (if any).
gdbserver/lldb-server will then pause the program at the entry point and wait for the client debugger to connect.
Start Remote Debugging Session
-
In CLion, set breakpoints in your code and start debugging the newly created remote debugging configuration
 session.
 -
The debugger in CLion will connect to the running remote process. The terminal will display the message Remote debugging from host.., and you can also check the Debugger connected to.. message in the debugger console.
-
Now you can inspect your code as if it were running locally (e.g., stepping through and checking variables, etc.):
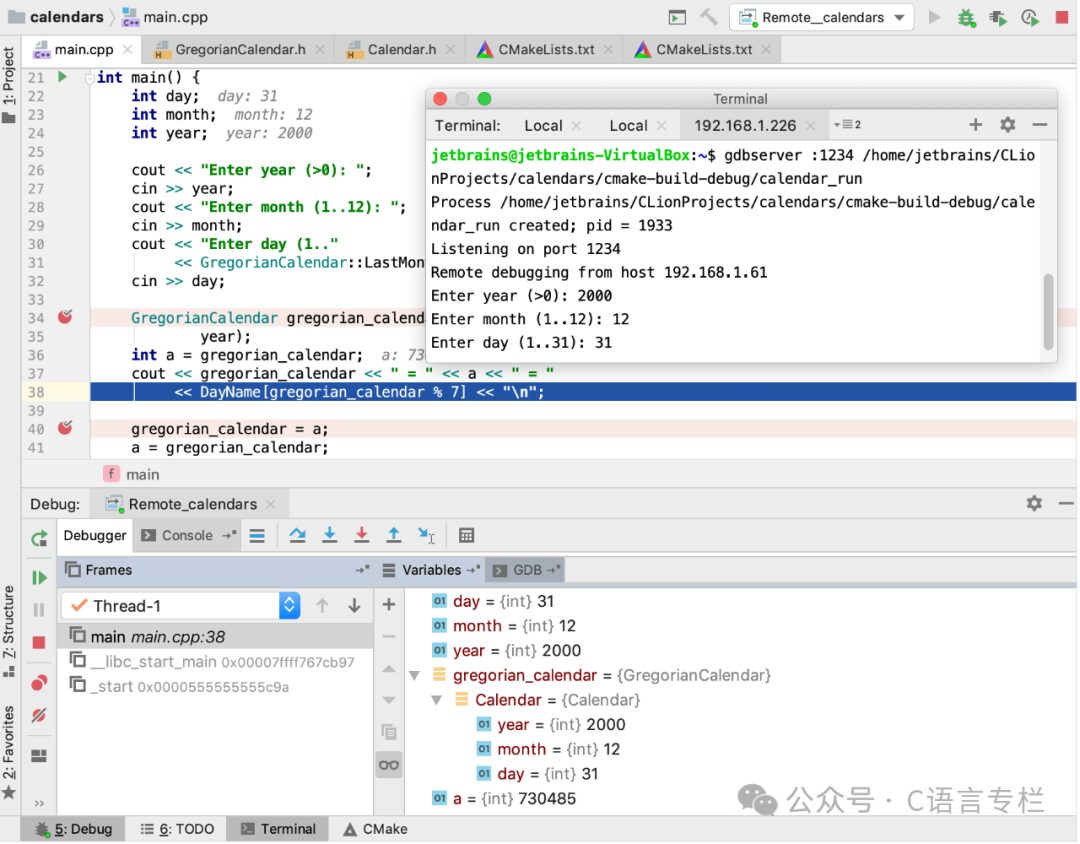
Typically, your program should stop at the breakpoints set in the IDE. If not, carefully check if the symbol file and path mappings are correctly specified in the run/debug configuration settings.
Debugging Shared Libraries
To debug shared libraries, add the following commands in ~/.gdbinit or .lldbinit on the local machine. For more information on accessing and editing scripts, refer to Using .gdbinit/.lldbinit Configuration Files.
-
Set solib-search-paths for GDB
However, by default, this command executes before the debugger starts and connects to the remote target. As a workaround, you can use GDB hooks:
define target hookpost-remoteset solib-search-path /path/to/my.so:/path/to/sysroot:/path/to/vendorlibsbreak main # If you also need the debugging session to pause at the startendThis way, GDB will execute the set solib-search-path specified in the hooks each time it connects to the remote target.
-
Set settings set target.exec-search-paths /path/to/libs for LLDB
Popular Recommendations
-
Aesthetic and powerful Typora alternative software, now open source~
-
In this day and age, does being a driver require knowing Linux?
-
The strongest free open source music software, supports PC and mobile~