When debugging microcontroller programs, serial printing is a common method. Sometimes, when the hardware does not reserve a serial port, other methods are needed for printing and debugging.1. Jlink SEGGER RTTJlink SEGGER RTT is a very useful method that allows you to achieve printf-like functionality simply by using the SWD or JTAG interface of Jlink, and the usage is quite simple.First, download the RTT code from the Jlink official website, or you can find it in the MDK installation directory. Add these four files to your project and include the SEGGER_RTT.h file in your main program.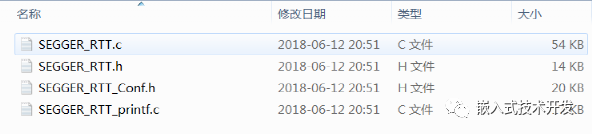 Initialize it first:SEGGER_RTT_Init();Then you can use SEGGER_RTT_printf(0,”I = %d\r\n”,i); to print debugging information. Open the J-Link RTT Client in the Jlink installation directory to see the debugging information.
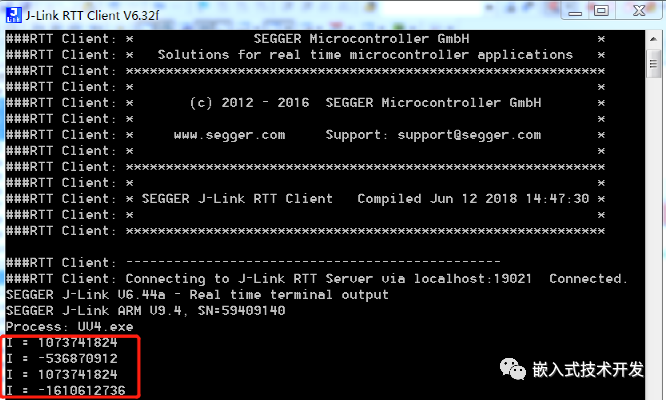 SEGGER RTT also supports some other functions, such as input detection, etc. Friends who are interested can explore it themselves.2. J-ScopeJ-Scope is another debugging tool software launched by SEGGER, which can analyze data in real-time and display it graphically while the target MCU is running. It does not require SWO or any additional pins on the target, but uses the available standard debugging port. J-Scope can display the values of multiple variables in a manner similar to an oscilloscope. The installer can be downloaded from the SEGGER official website. It is best to upgrade Jlink to the latest version before use.Here is a simple example,First, create a new empty project, add a piece of code, compile it, download it to the microcontroller, and run it.
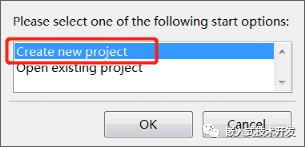
while (1){ i += 0.01; if(i >= 100) { i = 0; } sin_buf = sin(i); cos_buf = cos(i);}After J-Scope is installed, open the software and select to create a new project.
 Then configure the interfaces, as shown in the figure below:
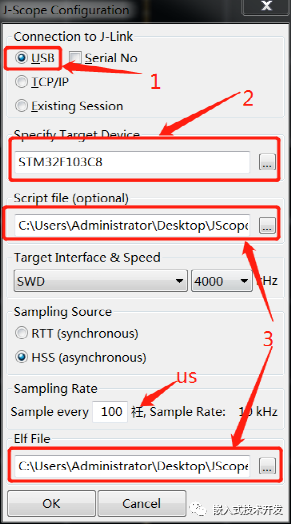 1) Select USB interface2) Select chip model3) Select the axf file generated by the MDK project4) Choose the interface type based on your actual situation, either SWD or JTAG5) The sampling source defaults to HSS6) The character “衽” in the image is actually a garbled character and should be “us”.
Click OK, then check the variables you want to view:
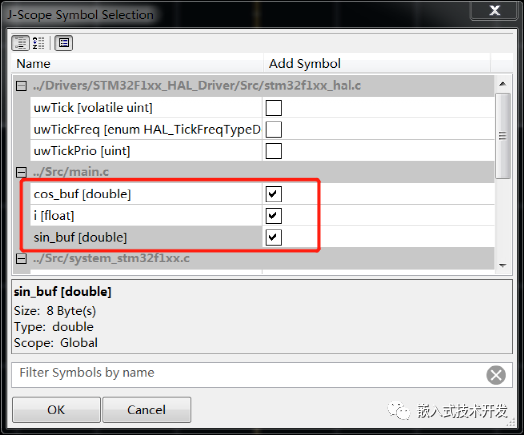 After clicking OK, click the run button, and after the program starts running, you can see the corresponding variable waveforms. You can also pause, stop, or zoom in and out of the waveforms.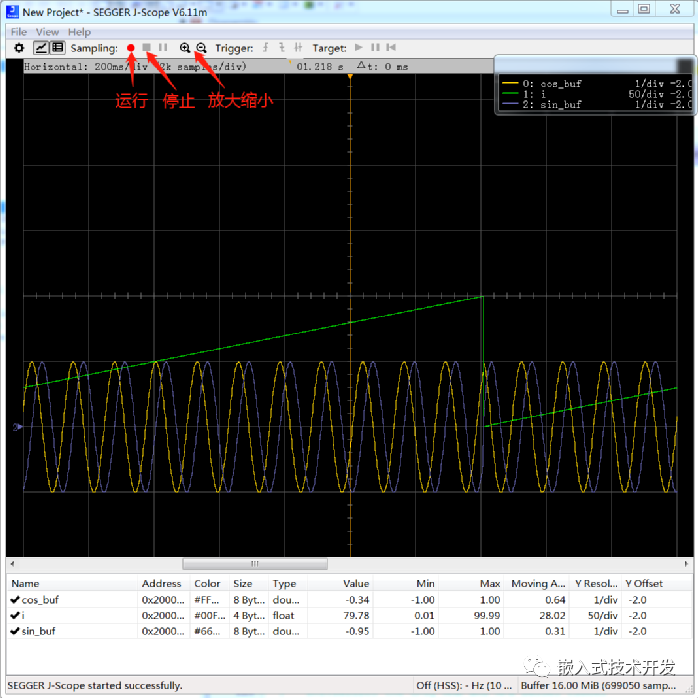
This software also has the function of importing and exporting data, and interested friends can explore it themselves.

END
Source: Embedded Technology DevelopmentCopyright belongs to the original author. If there is any infringement, please contact for deletion.▍Recommended ReadingThe Japanese Operating System That Almost Dominated the World…Understanding the Differences Between hex, bin, and axf Files in One ArticleNo Foreign Authorization Needed! A Milestone in Fully Self-Designed Domestic CPUs is Here~
→ Follow for Updates ←