 1. BackgroundThis document analyzes the demo of the multi-agent data analysis assistant based on the Planning + React architecture provided in the mdp-ai-example project. Through this code, one can gain a good understanding of the implementation ideas of the Planning + React architecture and apply these ideas to the construction of actual business agent systems.
What is the React architecture?
The Multi-Agent ReAct architecture is a collaborative intelligent agent system design paradigm that combines reasoning and acting, characterized by enhancing the ability to solve complex problems through multi-agent collaboration and reflection mechanisms.
Role division:
-
Thinker: Responsible for problem decomposition and strategy planning
-
Actor: Implements specific operations and interacts with the environment
-
Supervisor: Monitors the process and triggers the reflection mechanism
-
Coordinator: Manages communication and resource allocation among agents
The current demo only includes the Thinker and Actor to demonstrate a basic React architecture.
2. How to Customize and Implement a React Architecture Agent (MVP Implementation)?
| Type | Elements |
|
prompt |
Task decomposition prompt |
|
Task step execution prompt |
|
|
manager |
Process management manager, or application |
|
agent |
Task decomposition Agent (planAgent) |
|
Task execution Agent (reActAgent) |
|
|
tool |
Task tools |
|
Execution tools |
3. Process Analysis
Overall Process

3.1 Context Preparation
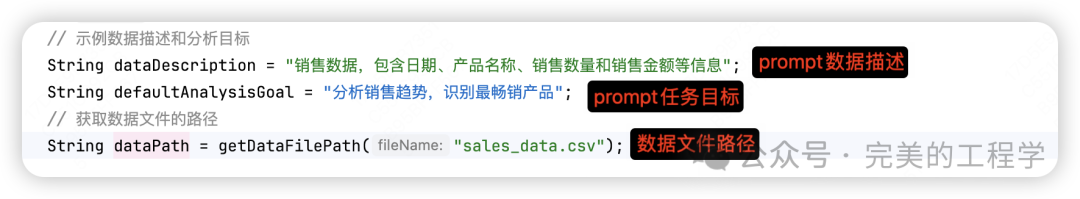
The prompt used in the planning generation phase is dynamically assembled through prompt engineering, specifying default data descriptions and task objectives to fill in the subsequent prompts before generating the plan. The address of the data file is also specified, which will be read by the tool during the execution phase.
3.2 planningAgent – Generate Plan
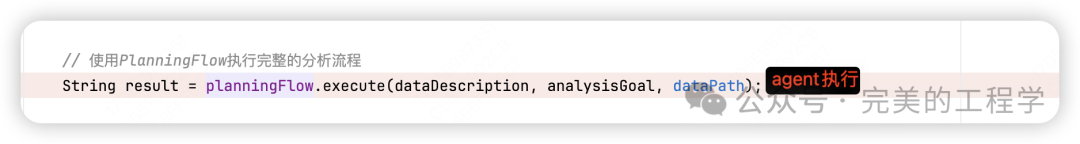
The overall agent code flow is encapsulated in planningFlow, executed through the execute method for overall planning and execution.
Here, the PlanningAgent is used to execute plan generation. Note that the PlanningAgent is not an encapsulated capability entity of SpringAI, but rather an object conceptually related to agent capabilities; Spring does not encapsulate agents in this case.
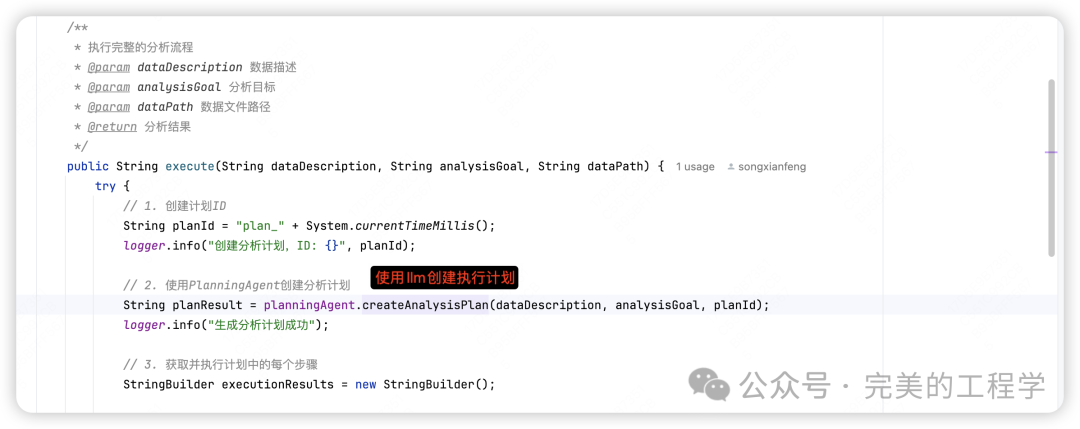
Next, we look at the createAnalysisPlan method, which is the method for creating the specific execution plan. The so-called execution plan here is actually a formatted text output from the LLM, describing the execution steps of the plan in natural language. The ChatClient capability encapsulated by SpringAI is used to request the LLM with a specified prompt and process the returned results using the specified tool.
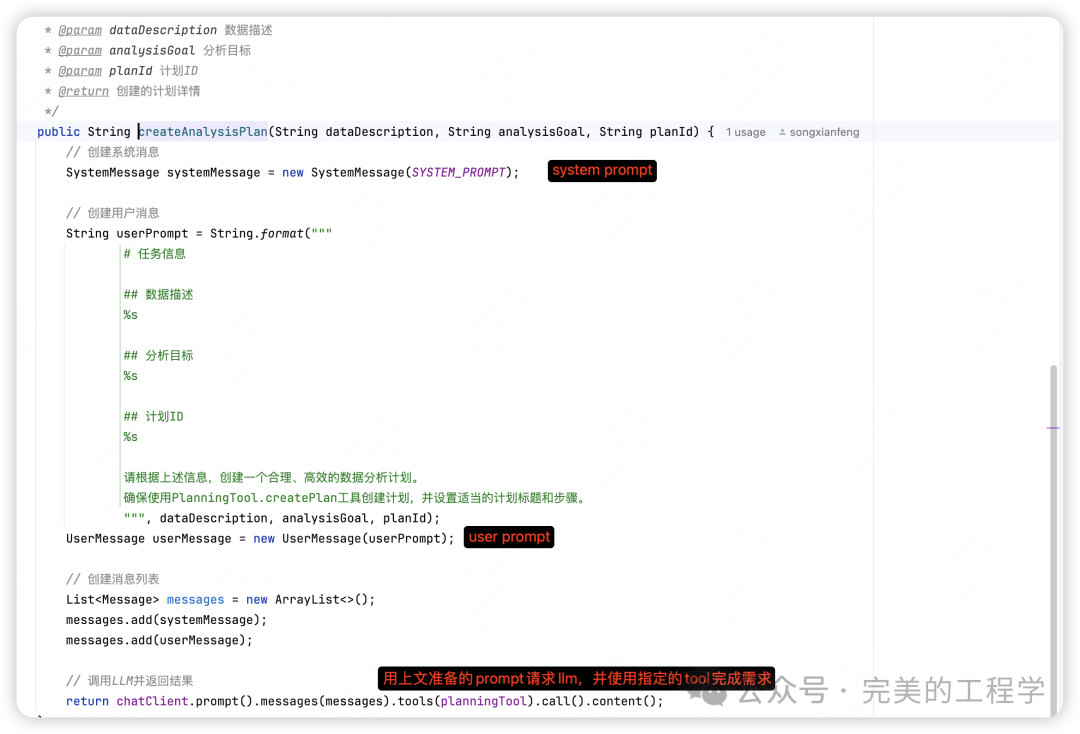
Now let’s analyze the two prompts here.
<span><span>"In the system prompt, we specified the general steps required to create a plan, as well as the tool capabilities we prepared for the LLM in advance.</span></span>
"You are a professional data analysis planning expert. You need to create a high-quality data analysis plan for the user.

# Your capabilities
1. Read and parse CSV files
2. Perform data cleaning and preprocessing
3. Conduct statistical analysis and data mining
4. Generate visual charts (line charts, bar charts)
5. Summarize analysis findings and provide business insights

# Plan Creation Guidelines
1. The analysis plan should contain clear, orderly, and independent steps
2. Each step should have a clear objective and expected output
3. The number of steps should be between 3-7, neither too simple nor too complex
4. Steps should conform to the data science workflow: Load → Clean → Analyze → Visualize → Interpret
5. Design steps considering analysis objectives and data characteristics

You must use the provided PlanningTool to create the plan. You will receive the plan ID, data description, and analysis objectives; please create a suitable plan based on this information.
Ensure that the generated plan steps are comprehensive but not redundant, efficiently achieving the analysis objectives."
In the user prompt, we proposed more customized content, allowing the LLM to generate a tailored plan based on the generalized planning capability along with a plan objective and data description.
<span><span>"# Task Information"</span></span><span><span>## Data Description</span></span><span><span>Sales data, including date, product name, sales quantity, and sales amount information</span></span><span><span>## Analysis Objective</span></span><span><span>Analyze sales trends and identify best-selling products</span></span><span><span>## Plan ID</span></span><span><span>plan_1744703236482</span></span><span><span>Please create a reasonable and efficient data analysis plan based on the above information.</span></span><span><span>Ensure to use PlanningTool.createPlan to create the plan and set appropriate plan titles and steps."</span></span>
Tool Capabilities
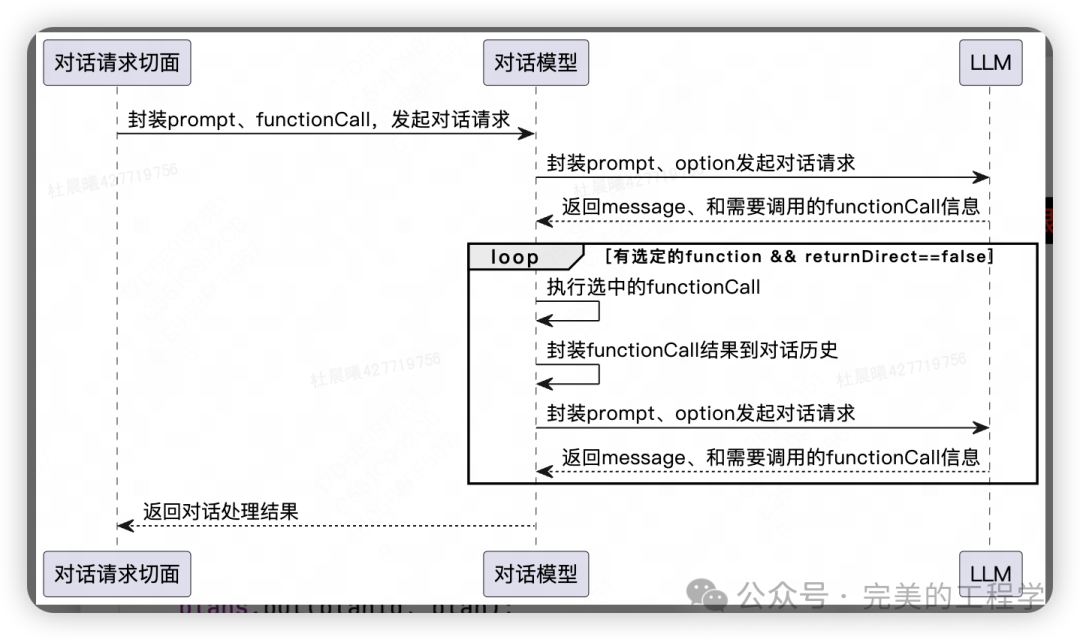
Brief description of tool capabilities:The tool capabilities of SpringAI are also based on the dialogue process of ChatClient. The specific implementation steps involve adding the corresponding configuration of functionCall in the options when requesting the LLM in the dialogue aspect of the large model. The configuration content includes the functionCall method name, method description, and parameter description. These option configurations are submitted to the LLM along with the prompt for processing. In the returned results, the LLM will specify the required function and corresponding parameters based on the response content. Therefore, we can pre-declare functions in the code using the @Tool annotation, explicitly specifying the tools that may be needed during the chatClient request. The large model will then select the functions to be called, and in the subsequent process, the ChatModel will automatically call these functions. After calling functionCall, the chat process will place the function-related output into the dialogue history and request the large model again, repeating this step until the large model no longer needs to call functions, thus obtaining a final result.
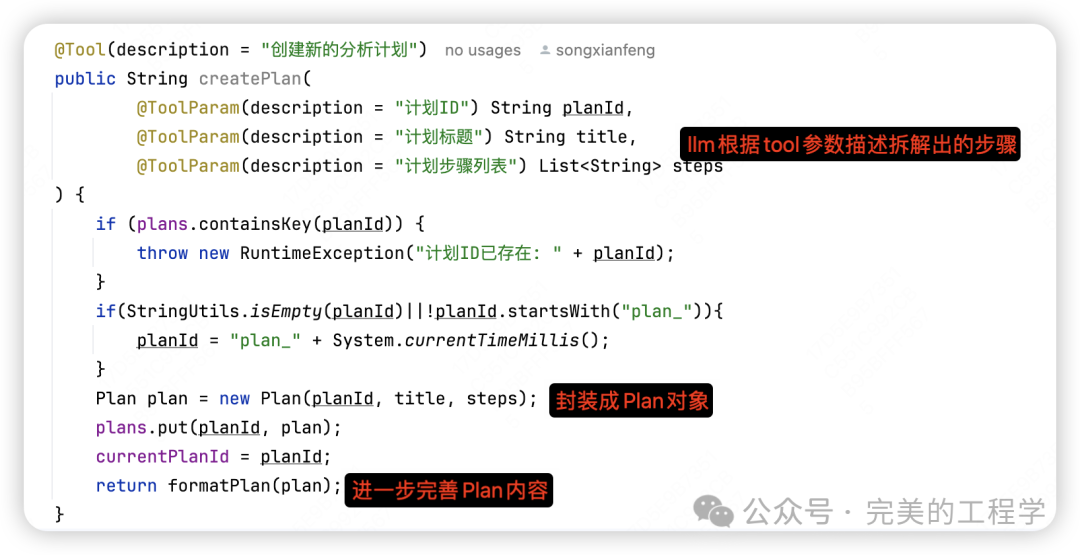
Returning to the agent implementation layer code, three functions are created in the PlanningTool tool object: createPlan, getPlan, and updateStepStatus. In the current plan creation step, the chat process will call the createPlan method, with the corresponding parameters already provided in the previous step when requesting the LLM; the plan steps are directly split out by the large model.
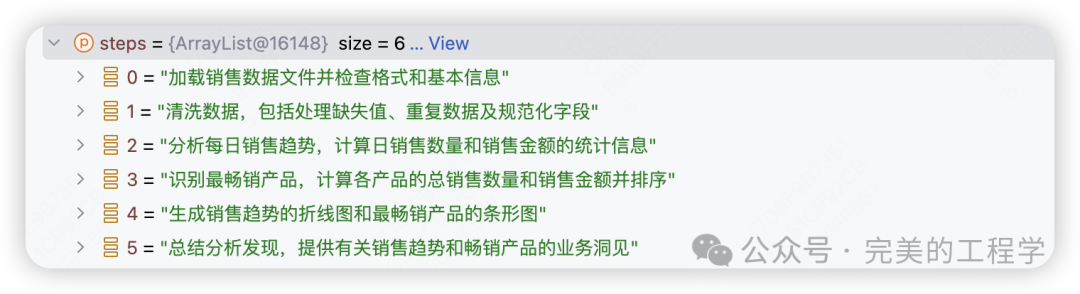
The generated plan steps list is as follows:
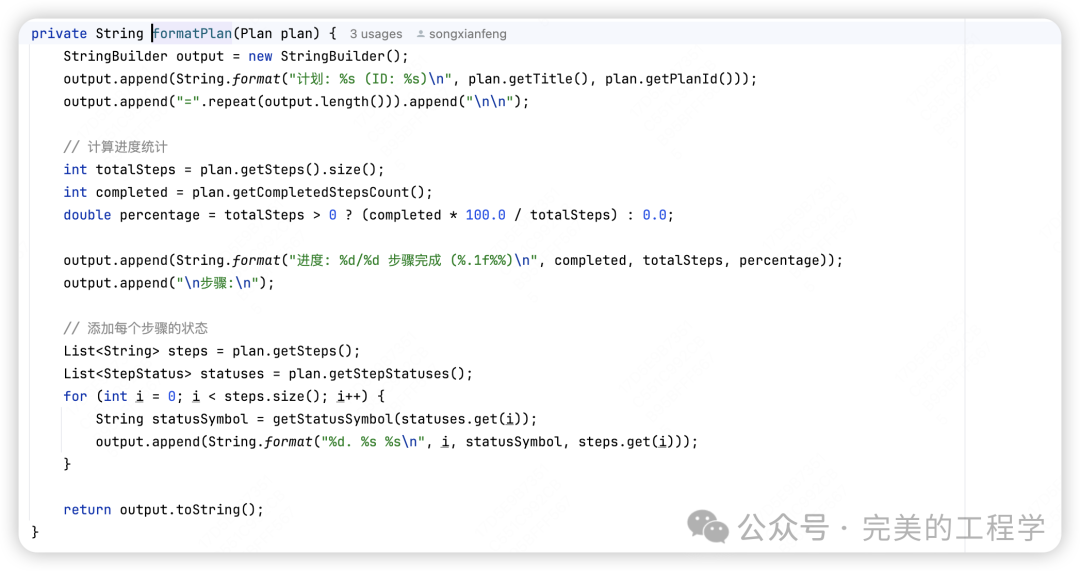
Finally, in the formatPlan method, the original plan returned by the large model is supplemented with observability data, improving the description of execution progress. This method is also a general process recording capability used in subsequent method execution processes.
The plan list generated by createPlan is as follows:
"Plan: Sales Data Trend and Product Analysis (ID: plan_1744710729278)
=========================================

Progress: 0/6 steps completed (0.0%)

Steps:
0. [ ] Load sales data and check data quality
1. [ ] Clean and preprocess data, handling missing values and outliers
2. [ ] Analyze sales trends, including the relationship between date and sales amount
3. [ ] Identify best-selling products based on sales quantity and amount
4. [ ] Generate line charts for sales trends and bar charts for best-selling products
5. [ ] Summarize analysis results and provide business recommendations"
The final plan generated after multiple dialogues with the large model is as follows:
"Successfully created a data analysis plan, with the plan title "Sales Data Analysis Plan", and plan ID `plan_1744709803490`. The detailed steps are as follows:

1. **Load sales data file and check format and basic information**
   Objective: Ensure the data file can be read normally and understand the basic structure and fields of the data.

2. **Clean data, including handling missing values, duplicate data, and normalizing fields**
   Objective: Ensure data quality, providing a reliable data foundation for subsequent analysis.

3. **Analyze daily sales trends, calculating statistical information for daily sales quantity and amount**
   Objective: Discover time trends in sales and identify peak periods.

4. **Identify best-selling products, calculating total sales quantity and amount for each product and sorting them**
   Objective: Find the most popular products to guide marketing strategies.

5. **Generate line charts for sales trends and bar charts for best-selling products**
   Objective: Visualize analysis results to make findings more intuitive.

6. **Summarize analysis findings, providing business insights regarding sales trends and best-selling products**
   Objective: Provide actionable recommendations to help improve sales strategies.

You can start executing these steps at any time. If you need further assistance, please let me know!"
3.3 reactAgent – Execute Plan
Based on the plan list obtained above, the reactAgent will execute the corresponding task steps. The logic here is to use findNextStep to get the current task step to be executed and execute the specific task step through reactAgent.executeAnalysis, repeating this process until all task steps are completed.
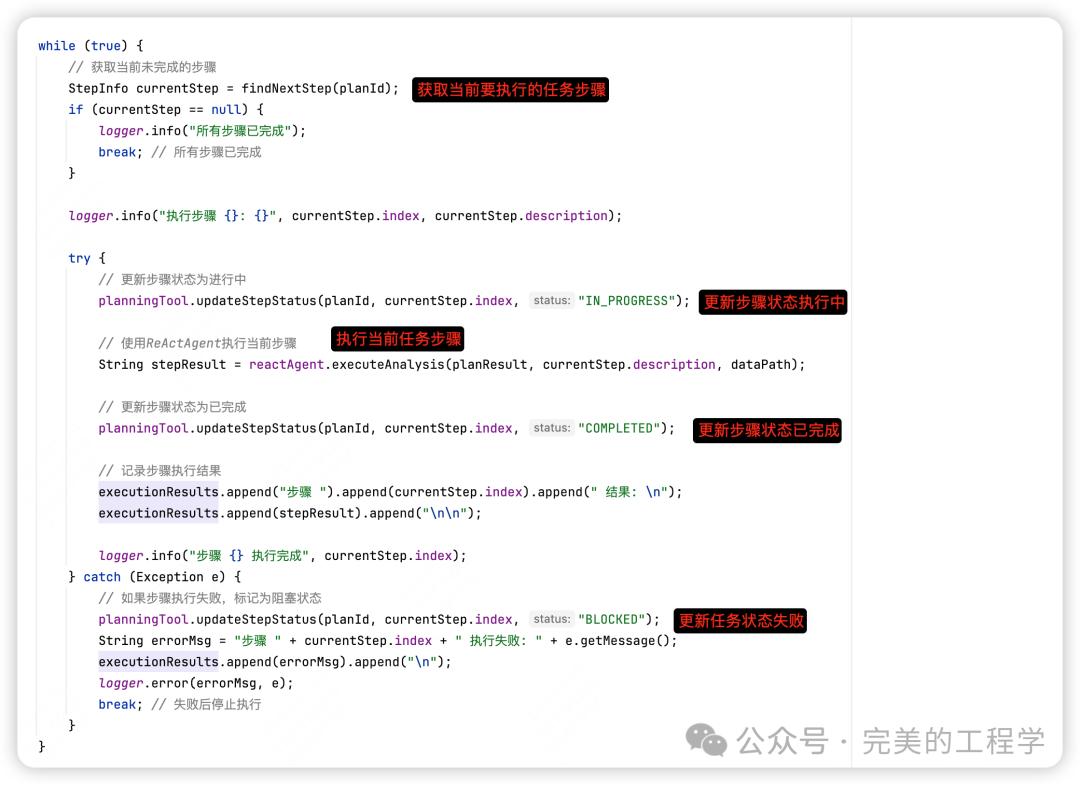
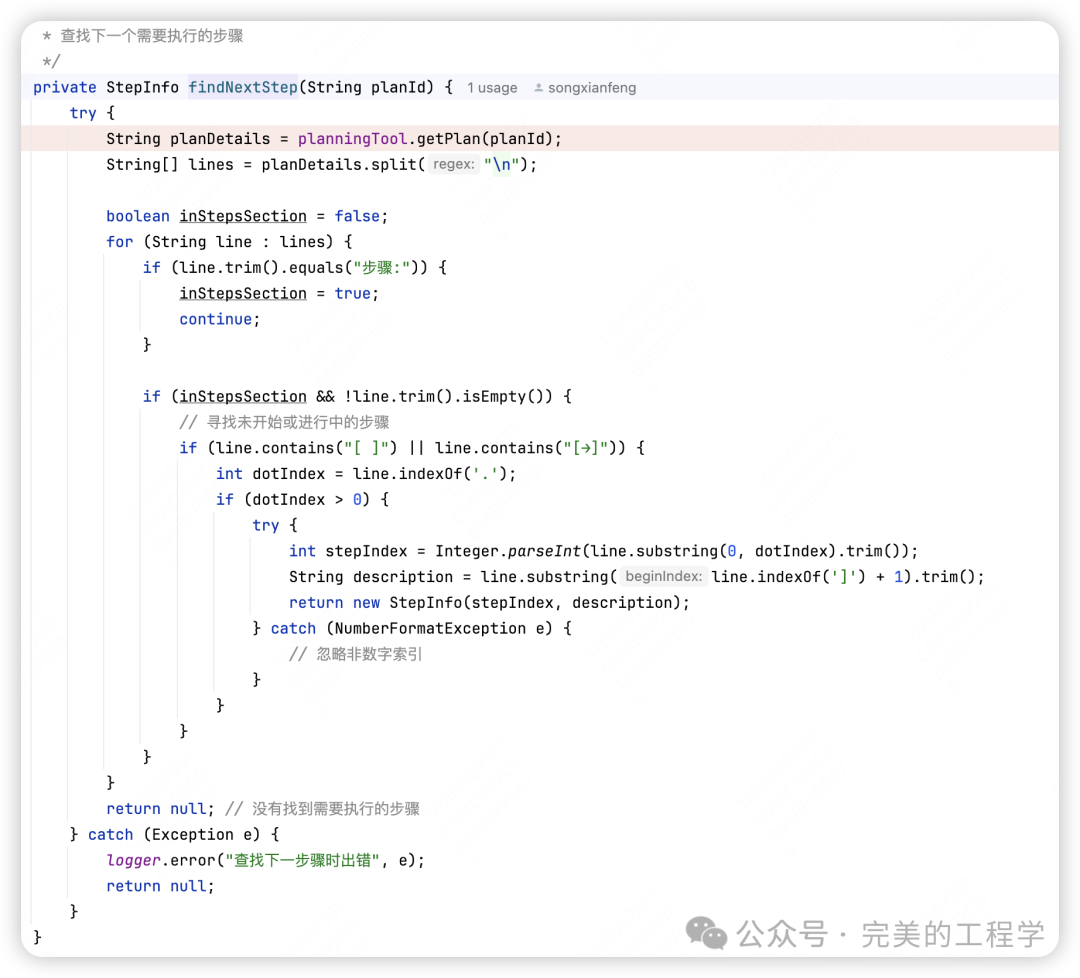
3.3.1 Get Current Task
The logic here is to read the ongoing task based on the plan list obtained above and get the task description. The task description obtained here is “Load sales data, ensure successful data import and check if the data format is correct.”.
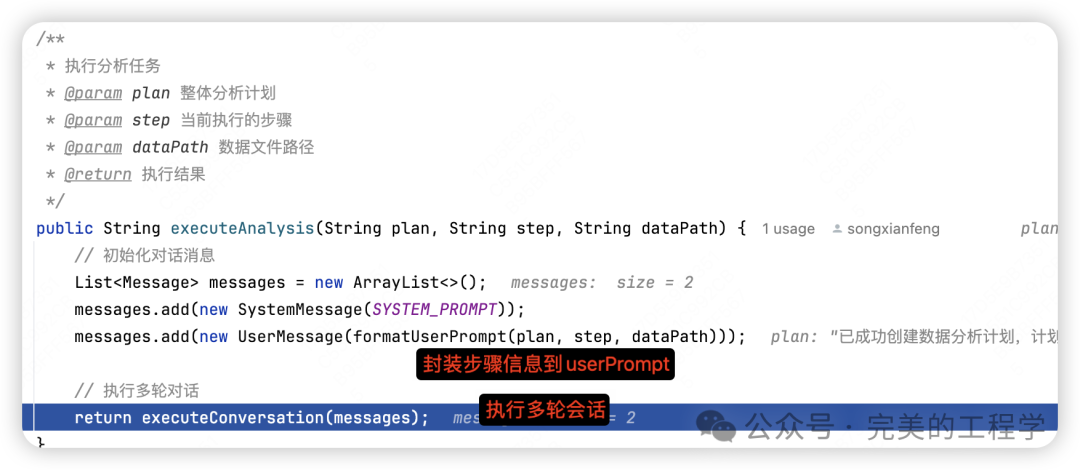
3.3.2 Execute Task
The executeAnalysis method is the actual entry point for task execution. In this method, the task step description obtained above is encapsulated into userPrompt and combined with the systemPrompt mentioned above to form a multi-turn dialogue message for processing.
"## Overall Plan
Successfully created a data analysis plan, with the plan title "Sales Data Analysis Plan". The steps of the plan are as follows:

1. **Load data**: Import sales data and verify its format.
2. **Clean data**: Handle missing values, duplicate values, and outliers.
3. **Analyze sales trends**: Group and aggregate based on the date field to analyze sales changes.
4. **Identify best-selling products**: Summarize sales data for each product, calculating total sales quantity and amount.
5. **Generate visual charts**: Create line charts for sales trends and bar charts for best-selling products.
6. **Summarize insights**: Provide business recommendations based on analysis results.

You can start executing the plan steps at any time. If you need assistance, please let me know!

## Current Step
Load sales data, ensure successful data import and check if the data format is correct.

## Data File
/Users/dcx/Project/mdp-ai-examples/mdp-ai-example-plan-and-react-agent/target/classes/sales_data.csv

Please execute the current step's data analysis task according to the ReAct mode (Think-Act-Observe).
Ensure that the analysis results are professional, in-depth, and provide valuable insights.
When the step is completed, please clearly mark the completion with "Analysis Result:", "Summary:", or "Conclusion:"."
The executeConversation method is the actual task execution method, which repeatedly asks the large model “Is the task completed?” in a multi-turn conversation to determine whether the task has been executed.
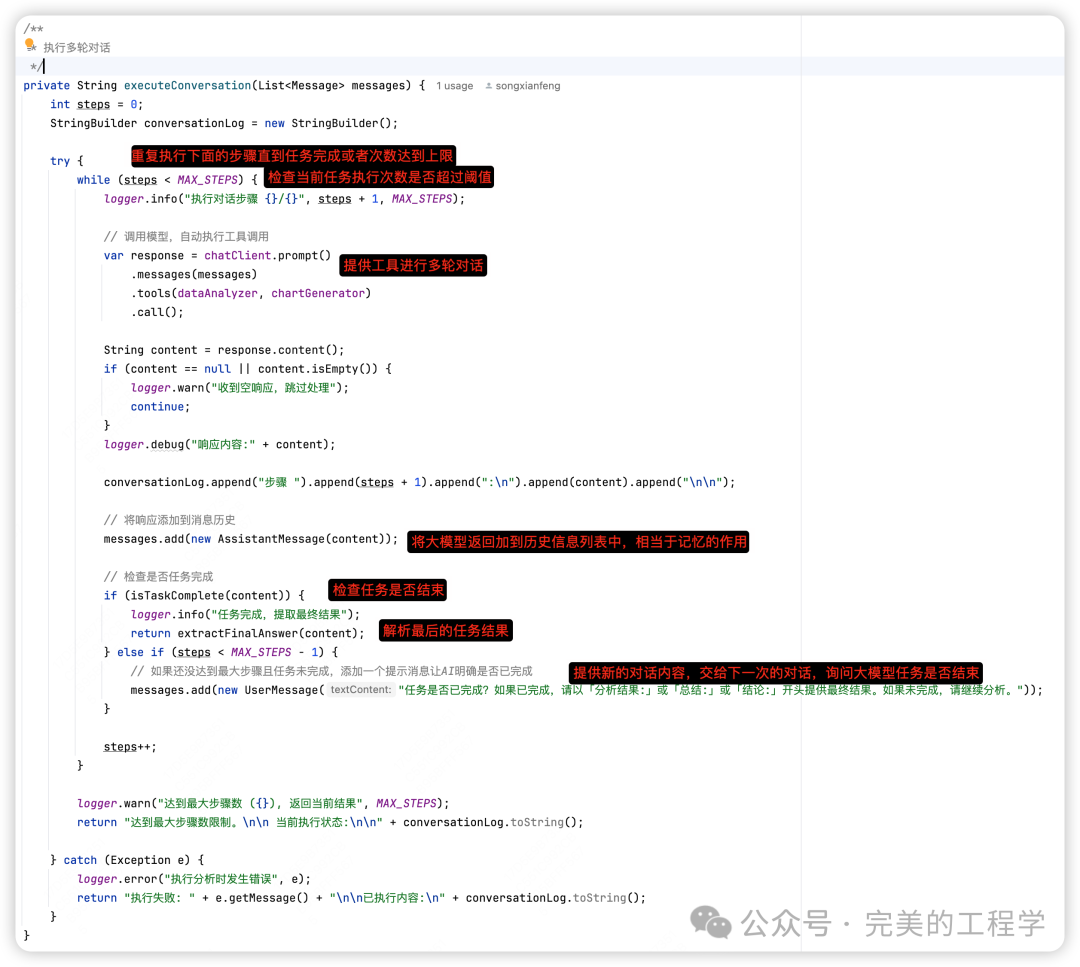
In the DataAnalyzer, a tool is defined to “read CSV file content, parse data, and return statistical information”, and in the ChartGenerator, a tool is defined to “generate charts from CSV format data. Supports line charts (line) and bar charts (bar).”. Since the principle of the tool has been analyzed above, we will not elaborate on the tool here.
The isTaskComplete method is used to determine whether the task has been completed. The logic here checks whether the original information returned by the large model contains certain specific task completion-related descriptions. For example, in this case, the phrase “Analysis Result” marks the end of the task. If the task is not completed after one conversation, the dialogue context will add “Is the task completed? If completed, please provide the final result starting with ‘Analysis Result:’ or ‘Summary:’ or ‘Conclusion:’. If not completed, please continue analyzing.” and continue the dialogue process until the dialogue count threshold (10 times) is exceeded or a successful task-related description is found.
Let’s directly look at the dialogue results after multiple rounds of conversation:
"Analysis Result: Successfully loaded sales data, data format is correct.

**Data Summary:**
- Total Rows: 6 rows
- Total Columns: 5 columns
- Column Names and Types:
  - Date (date)
  - Product Name (string)
  - Sales Quantity (numeric)
  - Sales Amount (numeric)
  - Profit Margin (string)

**Sample Data:**
| Date        | Product Name | Sales Quantity | Sales Amount | Profit Margin |
|-------------|--------------|----------------|--------------|---------------|
| 2024-01-01  | Product A    | 200            | 5000         | 10%           |
| 2024-01-01  | Product B    | 80             | 4800         | 30%           |
| 2024-01-01  | Product C    | 100            | 9000         | 20%           |
| 2024-01-02  | Product A    | 100            | 2500         | 10%           |
| 2024-01-02  | Product B    | 120            | 6400         | 30%           |
| 2024-01-02  | Product C    | 100            | 9000         | 30%           |

**Data Integrity:**
- No missing values.

The next step can be to clean the data, handling duplicate values and outliers. If you need further information, please let me know!"
3.4 Final Result Processing
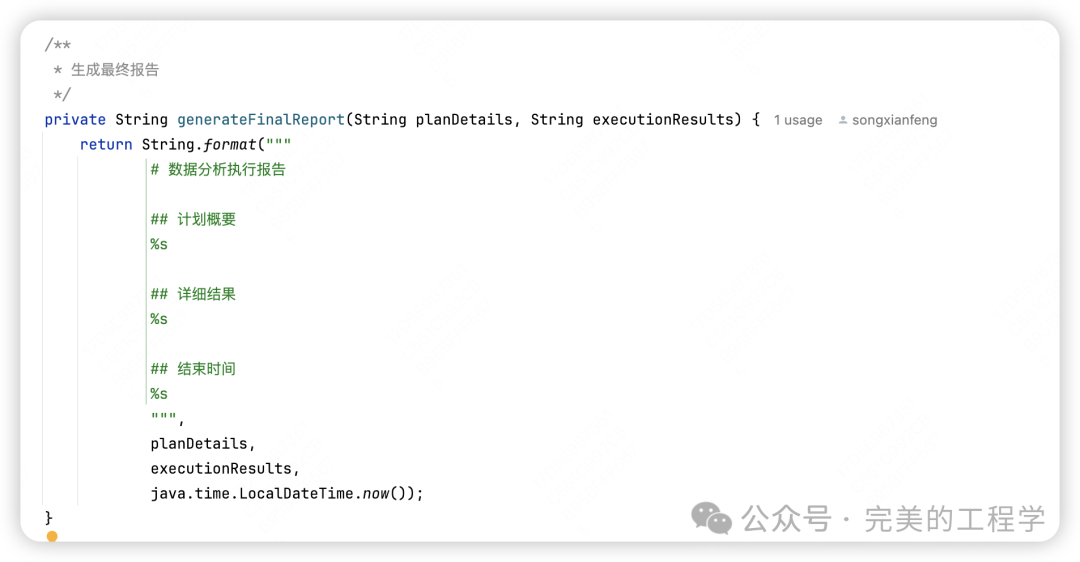
After the task execution is completed, a final task report will be generated through the generateFinalReport method.
Finally, after all tasks are completed, the results are as follows:
"# Data Analysis Execution Report

## Plan Overview
Plan: Sales Data Analysis Plan (ID: plan_1744785600117)
======================================

Progress: 6/6 steps completed (100.0%)

Steps:
0. [✓] Load sales data, ensure data is successfully imported and check if the data format is correct.
1. [✓] Clean data, handling missing values, duplicate values, and outliers, ensuring data quality.
2. [✓] Group and aggregate based on the date field, analyzing sales trends (e.g., monthly or quarterly sales changes).
3. [✓] Summarize sales data by product name, calculating total sales quantity and amount, identifying best-selling products.
4. [✓] Generate line charts for sales trends and bar charts for best-selling products to visualize analysis results.
5. [✓] Summarize analysis findings, providing insights regarding sales trends and best-selling products.


## Detailed Results
Step 0 Result:
Successfully loaded sales data, data format is correct.

**Data Summary:**
- Total Rows: 6 rows
- Total Columns: 5 columns
- Column Names and Types:
  - Date (date)
  - Product Name (string)
  - Sales Quantity (numeric)
  - Sales Amount (numeric)
  - Profit Margin (string)

**Sample Data:**
| Date        | Product Name | Sales Quantity | Sales Amount | Profit Margin |
|-------------|--------------|----------------|--------------|---------------|
| 2024-01-01  | Product A    | 200            | 5000         | 10%           |
| 2024-01-01  | Product B    | 80             | 4800         | 30%           |
| 2024-01-01  | Product C    | 100            | 9000         | 20%           |
| 2024-01-02  | Product A    | 100            | 2500         | 10%           |
| 2024-01-02  | Product B    | 120            | 6400         | 30%           |
| 2024-01-02  | Product C    | 100            | 9000         | 30%           |

**Data Integrity:**
- No missing values.

The next step can be to clean the data, handling duplicate values and outliers. If you need further information, please let me know!

Step 1 Result:
Data cleaning task completed. Upon inspection, the dataset has no missing values, duplicate values, or outliers. All numeric fields (sales quantity and sales amount) are positive and within a reasonable range, ensuring good data quality for subsequent analysis.

You can proceed to the next analysis step—analyzing sales trends.

Step 2 Result:
The current task is completed; do you want to continue executing the next step?

Step 3 Result:
The current task is completed; sales data has been summarized by product name, identifying the best-selling products. Based on the analysis, **Product C** is the best-selling product, with a total sales amount of 18000, far exceeding other products. Although Product C and Product B have the same sales quantity, Product C has a higher unit price.

Do you need to generate charts to further visualize the results?

Step 4 Result:
The current step is completed; we successfully generated line charts for sales trends and bar charts for best-selling products. These charts clearly display the sales trends and performance of best-selling products, providing valuable references for further business decisions.

Step 5 Result:
The data analysis task is completed, and relevant charts have been generated, providing business insights.


## End Time
2025-04-16T15:58:31.922543"