Editor
Full text link: tecdat.cn/?p=44242
Original source: Tuoduan Data Tribe WeChat Official Account
Analyst: Song Yang
In the digital age, the connections between enterprises have long transcended equity and business cooperation. As core decision-makers, the social networks formed by directors through cross-enterprise positions have gradually become key carriers for resource flow, information transmission, and governance efficiency. From a data science perspective, the director network is essentially a commercial mapping of complex social networks, and its structural characteristics directly influence corporate strategic choices, risk transmission, and resource integration efficiency. This phenomenon is not accidental; as market competition intensifies and cross-border cooperation increases, the “invisible bridges” built by directors with diverse experiences may become a booster for corporate development or hide systemic risk transmission hazards. (Click “Read the original text” at the end to obtain the complete intelligence, code, data, and documents)..
This article is adapted from a corporate governance consulting project we completed for a financial institution, with the core goal of dismantling the internal logic of the director network through data mining techniques to provide decision support for investors, regulatory agencies, and corporate management. As a team that has long focused on business data analysis, we have the capability to provide full-process services from data collection, model construction to practical application, and have helped dozens of enterprises solve practical problems related to network analysis.
The research is based on real employment data from a professional director database, using Python ecosystem tools to construct network models, integrating four core centrality indicators to identify key directors, while innovatively introducing cross-industry network comparison and bridge node analysis, fully presenting the “core-periphery” structure and industry difference characteristics of the director network.
The content of this article is derived from past project technical accumulation and has been validated through actual business. The complete code and data for this project have been shared in the communication community. By reading the original text and joining the group, you can communicate and grow with over 600 industry professionals; we also provide manual Q&A to break down core principles, code logic, and business adaptation ideas, helping everyone understand not only how to do it but also why to do it; if you encounter code running issues, you can also enjoy 24-hour debugging support.
1. Core Theory and Method Simplification
1.1 Core Concepts of Social Network Analysis
Social Network Analysis (SNA) is an analytical method that describes nodes (individuals/organizations) and edges (relationships) through mathematical models, quantifying network structure and node importance. This article focuses on four core centrality indicators, explaining their business significance in layman’s terms:
- Degree Centrality: Measures the number of peers directly associated with a director, reflecting the “breadth of the social circle”;
- Closeness Centrality: Measures the average distance for a director to reach other nodes, reflecting the “speed of information acquisition”;
- Betweenness Centrality: Measures the frequency with which a director acts as a bridge connecting different groups, reflecting the “resource allocation ability”;
- Eigenvector Centrality: Not only focuses on the number of connections but also emphasizes the importance of the connected entities, reflecting the “industry voice”.
1.2 Technical Tools and Domestic Adaptability
The Python ecosystem tools used in this article (NetworkX, Matplotlib, Seaborn) are all open-source and free software, accessible for direct use in China without special configuration; the data source is the BoardEx database, which domestic users can obtain through compliant data service providers. Alternative options include director employment data from platforms like Wind and Tonghuashun iFinD, which have similar functionality and data integrity.
2. Data Overview
2.1 Basic Information of the Data
The director data used in the study covers employment records from 2023 to 2024, retaining 20,210 valid records after cleaning, involving 15,071 independent directors and 2,853 enterprises, including 60 core fields (such as director ID, enterprise ID, employment time, industry classification, etc.).
2.2 Data Distribution Characteristics
The data exhibits distinct commercial property characteristics: the industry distribution is dispersed and balanced, non-executive directors and independent directors account for over 70%, and the size of corporate boards is concentrated in the range of 5-15 people, with the number of network connections for directors showing a long-tail distribution characteristic of “a few people connecting widely, most people connecting limitedly”.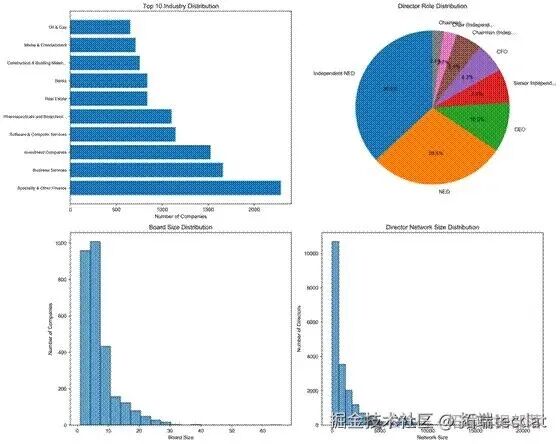 The above figure clearly displays the four core characteristics of industry distribution, director role distribution, board size distribution, and network size distribution, providing data support for subsequent network construction.
3. Network Construction and Code Implementation
3.1 Core Code (Modified Version)
The following code implements the core logic of network construction, centrality calculation, and industry comparison, with key parts omitted (replaced with …), and the complete code can be obtained through the community:
#!/usr/bin/env python3
# -*- coding: utf-8 -*-
"""
Company Director Industry Network Comparison Analysis Tool
Function: Construct director social network, calculate core indicators, generate industry comparison visualization
"""
import pandas as pd
import numpy as np
import networkx as nx
import matplotlib.pyplot as plt
import seaborn as sns
from collections import defaultdict, Counter
import warnings
warnings.filterwarnings('ignore')
# Set drawing parameters
plt.rcParams['font.sans-serif'] = ['SimHei', 'Arial Unicode MS']
plt.rcParams['axes.unicode_minus'] = False
plt.rcParams['figure.figsize'] = (14, 10)
def build_sector_network(df_processed, sector_name):
    """
    Construct the director network for a single industry
    Parameters: preprocessed dataset, industry name
    Returns: network object
    """
    net = nx.Graph()
    edge_counts = defaultdict(int)
    # Group by enterprise to get the list of directors
    company_director_map = df_processed.groupby('boardid')['directorid'].apply(list).to_dict()
3.2 Code Function Description
The above code implements three core functions: first, data preprocessing and cleaning, filtering valid employment records; second, industry network construction, establishing an undirected network with directors as nodes and co-employment as edges; third, core indicator calculation, automatically generating four centrality indicators and network structure parameters; fourth, industry comparison and cross-industry node identification, providing data support for subsequent analysis.
Related Articles
Analyzing Social Networks Using Python and SAS Viya
Full text link: tecdat.cn/?p=7303
4. Core Analysis Results
4.1 Overall Network Structure Characteristics
The constructed director network contains 15,071 nodes (directors) and 63,479 edges (co-employment relationships), with a network density of 0.000559, and the largest connected component accounts for 53.2%. This indicates that the director network is a “low-density, high-connectivity” complex network, exhibiting typical “small-world” characteristics—an average clustering coefficient as high as 0.892, meaning directors tend to connect with peers’ associates, resulting in high information transmission efficiency.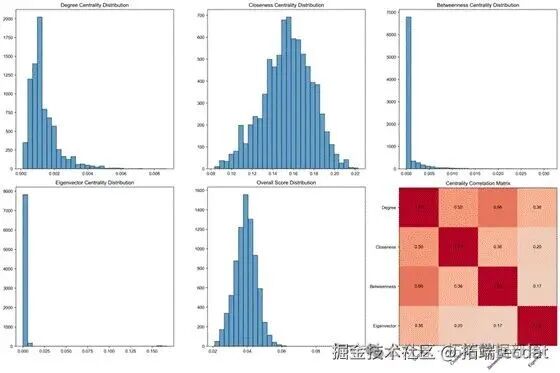 The above figure displays the distribution characteristics and correlations of the four centrality indicators: degree centrality and eigenvector centrality are highly correlated (correlation coefficient > 0.8), indicating that directors with a “broad social circle” often connect with important figures in the industry; the distribution of betweenness centrality is extremely uneven, with a few directors holding the connection power between different groups.
4.2 Key Director Identification
By integrating the scores of the four centrality indicators, the top ten core directors were identified (example of the top 5):
- Barry O’Dwyer (Overall Score 0.1045)
- Moni Mannings (Overall Score 0.1045)
- Claudia Arney (Overall Score 0.1039)
- Elisabeth Scott (Overall Score 0.1034)
- Susan Kilsby (Overall Score 0.1010) These directors generally have cross-industry employment experience, with an average number of connected directors more than seven times that of ordinary directors, playing a key role in information transmission and resource integration.
4.3 Network Visualization Results
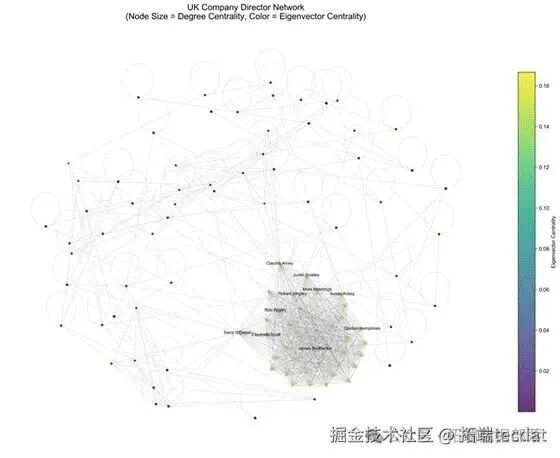 The visualization results clearly present the “core-periphery” structure of the network: the core area consists of high centrality directors, while the peripheral area consists of ordinary directors; there are multiple tightly connected “small circles” in the network (possibly corresponding to industry clusters or corporate alliances), with some directors acting as “bridge nodes” connecting different circles, these nodes are the core figures with high betweenness centrality.
5. Industry Comparison and Cross-Industry Analysis
5.1 Industry Comparison Results
In-depth comparisons were made between the two industries with the largest data volumes (professional finance and business services), with the core indicators as follows:
| Indicator | Professional Finance Industry | Business Services Industry |
|---|---|---|
| Total Directors | 1882 | 1491 |
| Total Connections | 7110 | 4910 |
| Network Density | 0.004 | 0.004 |
| Average Clustering Coefficient | 0.952 | 0.965 |
| Average Degree | 10.514 | 6.703 |
| Maximum Degree | 21 | 32 |
| Maximum Connected Component Ratio | 3.9% | 2.5% |
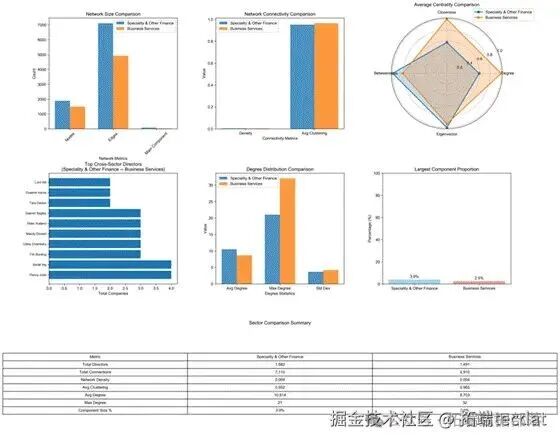 Comparisons reveal that the professional finance industry has a larger network scale and broader connections; the business services industry has a higher clustering coefficient and stronger internal cohesion; both industries’ networks exhibit a “fragmented” characteristic, with the maximum connected component ratio being less than 4%, indicating that directors within the industry mainly operate in small-scale circles.
5.2 Cross-Industry Bridge Director Identification
A total of 39 cross-industry directors who hold positions in both industries were identified, serving as key bridges for information transmission and resource flow between industries. Among them, the top five core bridge directors are:
- Penny Judd (2 in professional finance + 2 in business services)
- Sarah Ing (3 in professional finance + 1 in business services)
- Tim Bunting (2 in professional finance + 1 in business services)
- Libby Chambers (2 in professional finance + 1 in business services)
- Mandy Donald (2 in professional finance + 1 in business services) The presence of these directors breaks down industry barriers, providing natural channels for cross-industry cooperation and risk diversification, and their network value far exceeds that of directors within a single industry.
6. Practical Application Recommendations
6.1 Recommendations for Investors
Prioritize attention to enterprises where core directors hold positions, as these enterprises often possess information advantages and resource integration capabilities; use network analysis to identify hidden connections between enterprises to avoid systemic risks; consider the position in the director network as an important indicator for assessing corporate governance quality.
6.2 Recommendations for Regulatory Agencies
Focus on monitoring the employment behavior of core bridge directors to prevent risk transmission across industries; require enterprises to disclose information on directors’ cross-enterprise positions to enhance governance transparency; develop differentiated regulatory policies based on industry network characteristics.
6.3 Recommendations for Enterprises
When recruiting directors, pay attention to their network position and connection quality, introducing external resources through core directors; utilize the director network to obtain industry best practices and optimize governance structures; leverage cross-industry directors to expand business boundaries and achieve strategic upgrades.
7. Summary and Service Support
This article dissects the structural characteristics, industry differences, and core value of the director network through social network analysis technology, with the innovation of integrating multi-dimensional centrality indicators for precise identification of key nodes, while uncovering the unique value of cross-industry bridge directors, providing data-driven decision support for relevant parties. We always adhere to the service philosophy of “buying understanding is better than buying code”, with over 90% of manual creation, effectively avoiding duplication risks and code vulnerabilities; 24-hour response for “code running exceptions” emergency repair service, improving efficiency by 40% compared to self-debugging. The complete code, data, and detailed analysis of the project have been shared in the communication community, where you can communicate and grow with over 600 industry professionals, obtain manual Q&A and code debugging support, truly understanding both “how to do it” and “why to do it”. Whether for academic research, course design, or practical projects, we can provide customized data analysis solutions to help quickly implement technical applications and improve outcome quality.
About the Analyst
We sincerely thank Song Yang for his contributions to this article. He completed his master’s degree in business analytics at Lancaster University, focusing on research in data-related fields. He is proficient in R language and Python, with solid capabilities in data processing and analysis, machine learning, empirical research, and academic and business report writing.

In this article, the complete analysis of intelligence, data, code, and documents has been shared in the member group, scan the QR code below to join the group!
Data Acquisition
Reply “Get Data” in the background of the official account to obtain free learning materials on data analysis, machine learning, deep learning, etc.

Click the end of the article“Read the original text”
to obtain the complete intelligence,
code, data, and documents.