Free sharing of indicators. Do not blindly trust indicators, but use them for my own purposes.


Tongdaxin Indicator Installation Tips:
1. On the computer, open the Tongdaxin software; click “Function” – “Formula System” – “Formula Manager”; select “Technical Indicator Formula” – “New”; fill in the name and copy-paste the formula, filling in the required parameters (if any);
2. Click the “Test Formula” button in the upper right corner to test your newly added indicator. The test results will be displayed at the bottom. If the test passes, be sure to click the “OK” button in the upper right corner, so your new indicator is completed.

Friendly Reminder (Indicators are only auxiliary, not advice)
This Python Capital Flow Indicator: Learning Quantitative Indicator Source Code Based on 【Tongdaxin】 KDJ Enhancement provides important convenience for our judgment from multiple aspects.
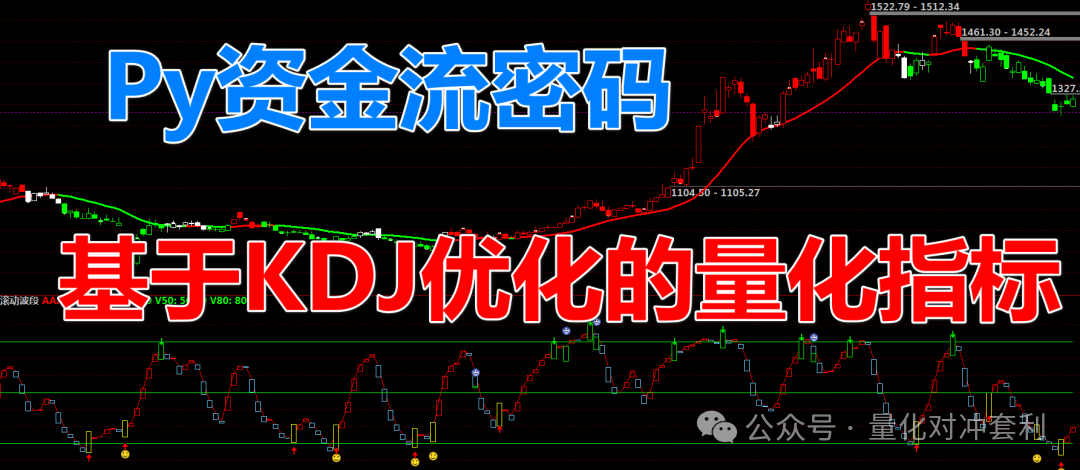 Figure 1: Global Analysis Chart of the Indicator
1. Core Usage of the Indicator
Risk Warning: This indicator is for technical research and learning exchange only. The market has a high degree of uncertainty, and any decisions based on this indicator must be made with caution and at your own risk, and do not constitute any investment advice. Note: The source code of this indicator is for Tongdaxin. Friendly reminder: there is a lot of code. This account does not recommend stocks, does not promise returns, does not engage in business cooperation, and does not have any profit-sharing principles with any institutions or individuals. It purely shares investment concepts, market analysis, and knowledge, and all content is for reference only. The models and algorithms described in this article are for academic discussion only, and the indicator formulas are shared as knowledge for free, “based on theoretical deductions from open-source datasets,” and are for learning and exchange only. Academic Exchange: We focus on academic exchanges and research in the market, including self-use indicators with zero lag moving averages and automated program quantitative learning. Knowledge Sharing: Grateful to Santian for the guidance, with Santian in mind, life will surely be sweet. Respect the divine, love others as oneself, I am for everyone, and be kind to others, sharing happiness!
2. Indicator Chart Display
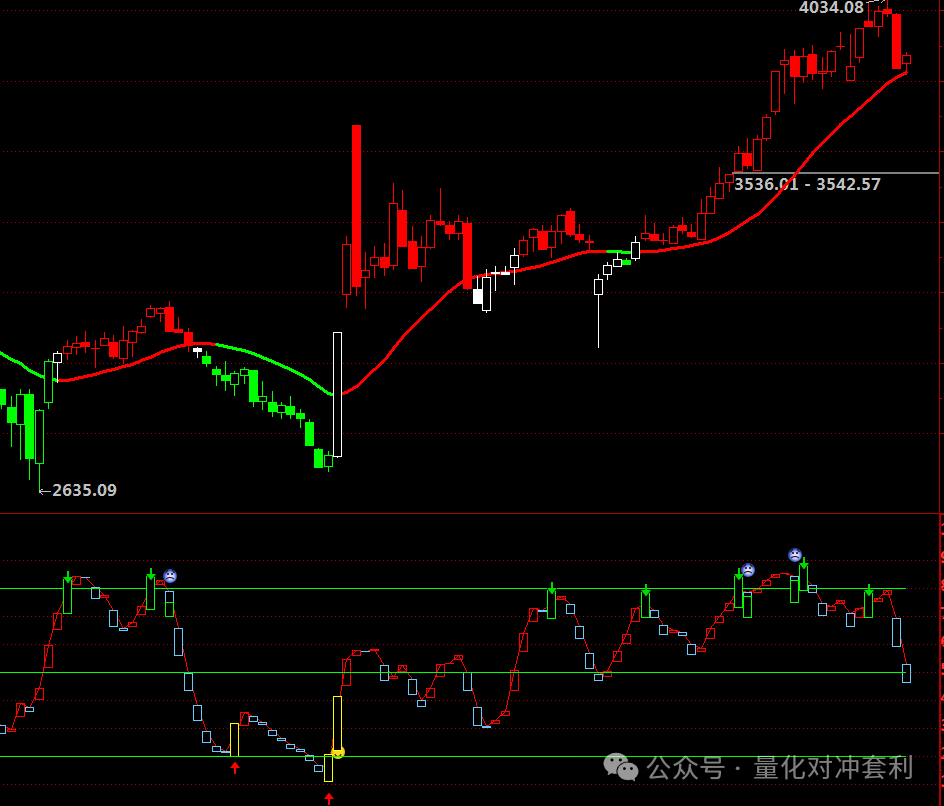 Figure 2: Indicator Single Variety Schematic
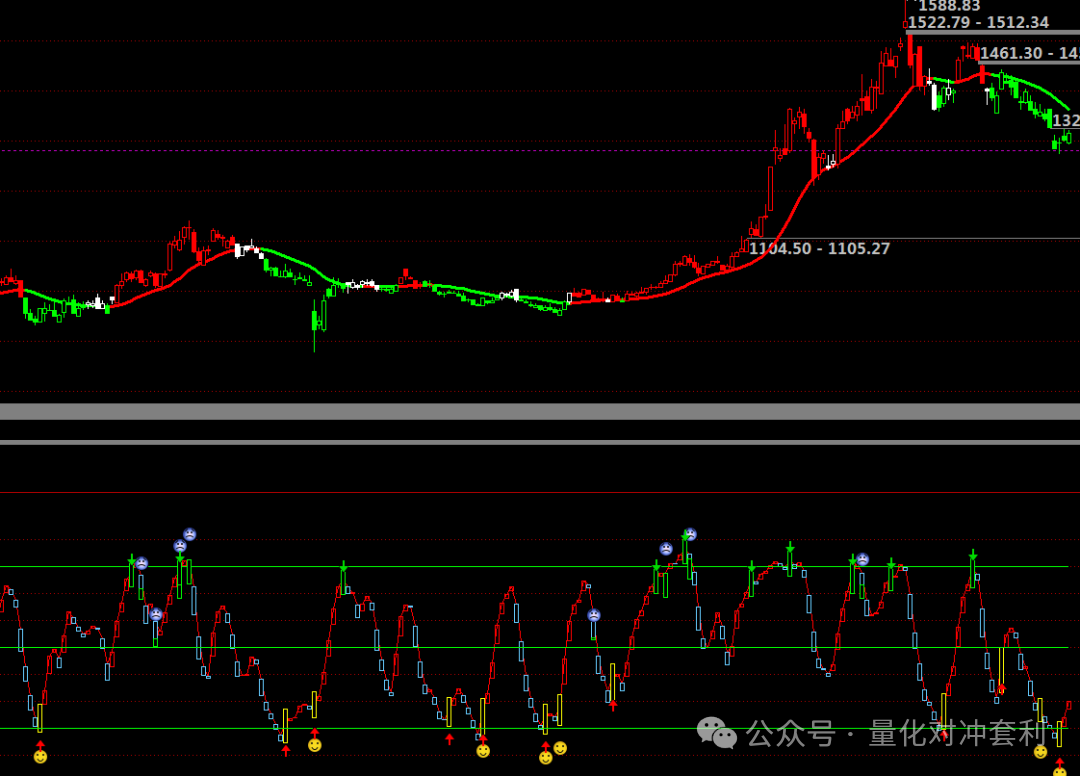 Figure 3: Indicator Index Demonstration
3. Indicator Python Code
Install dependencies pip install pandas numpy matplotlib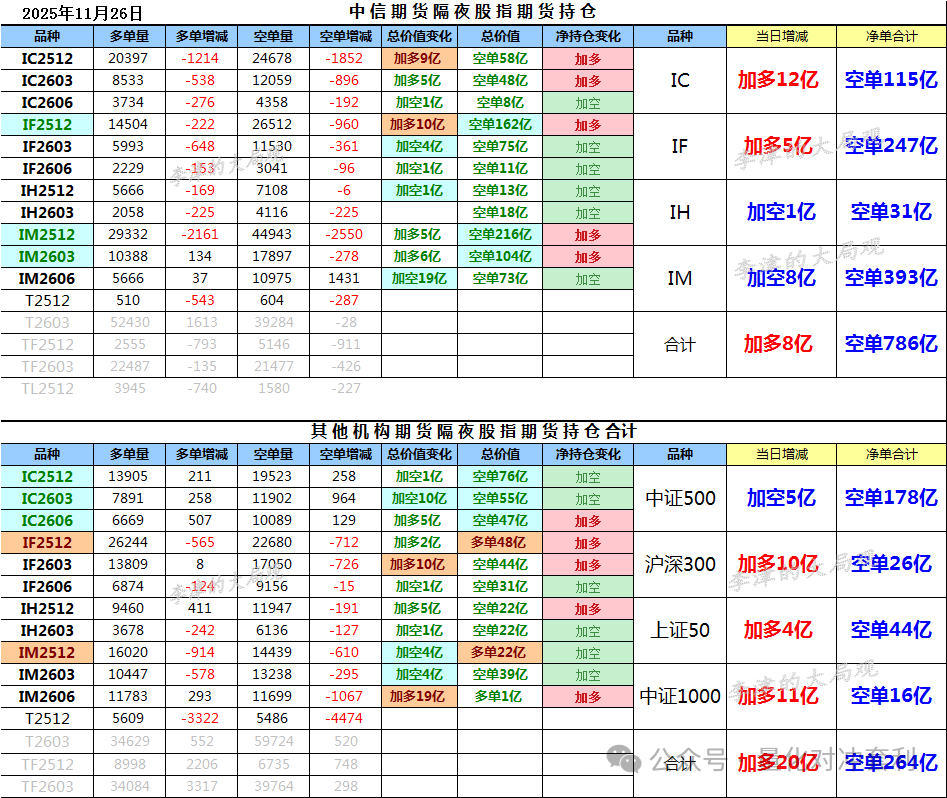
import pandas as pd
import numpy as np
import matplotlib.pyplot as plt
from matplotlib.patches import Rectangle
import warnings
warnings.filterwarnings('ignore')

class LIJIN_Indicator:
    def __init__(self, data):
        """
        Parameters:
        data: DataFrame, contains OHLCV data, column names need to be ['open', 'high', 'low', 'close', 'volume']
        """
        self.data = data.copy()
        self.calculate_indicators()

    def calculate_kdj(self, n=9, m=3, t=3):
        """Calculate KDJ indicator"""
        df = self.data.copy()

        # Calculate RSV
        low_list = df['low'].rolling(window=n).min()
        high_list = df['high'].rolling(window=n).max()
        rsv = (df['close'] - low_list) / (high_list - low_list) * 100

        # Calculate K, D, J
        df['K'] = rsv.ewm(com=m-1).mean()
        df['D'] = df['K'].ewm(com=m-1).mean()
        df['J'] = 3 * df['K'] - 2 * df['D']

        return df['K'], df['D'], df['J']

    def calculate_indicators(self):
        """Calculate all LIJIN indicators"""
        df = self.data

        # Calculate KDJ
        K, D, J = self.calculate_kdj(27, 3, 3)

        # LIJIN_1: If KDJ.J < 0 then 10, else 0
        df['LIJIN_1'] = np.where(J < 0, 10, 0)

        # LIJIN_2: 9.9 crosses LIJIN_1
        df['LIJIN_2'] = (df['LIJIN_1'].shift(1) > 9.9) & (df['LIJIN_1'] <= 9.9)

        # LIJIN_3: (2*close price + high price + low price) / 4
        df['LIJIN_3'] = (2 * df['close'] + df['high'] + df['low']) / 4

        # LIJIN_4: 5-day lowest price
        df['LIJIN_4'] = df['low'].rolling(window=5).min()

        # LIJIN_5: 5-day highest price
        df['LIJIN_5'] = df['high'].rolling(window=5).max()

        # LIJIN_6: Standardized EMA
        numerator = df['LIJIN_3'] - df['LIJIN_4']
        denominator = df['LIJIN_5'] - df['LIJIN_4']
        # Avoid division by zero
        denominator = np.where(denominator == 0, 1, denominator)
        df['LIJIN_6'] = (numerator / denominator * 100).ewm(span=5).mean()

        # LIJIN_7, LIJIN_9: Constants
        df['LIJIN_7'] = 1
        df['LIJIN_9'] = 1

        # LIJIN_8: 2-day moving average of LIJIN_6
        df['LIJIN_8'] = df['LIJIN_6'].rolling(window=2).mean() * df['LIJIN_7']

        # AAA: If LIJIN_6 > LIJIN_8 then take LIJIN_6, else take LIJIN_8
        df['AAA'] = np.where(df['LIJIN_6'] > df['LIJIN_8'], df['LIJIN_6'], df['LIJIN_8'])

        # LIJIN_10: LIJIN_6 > LIJIN_8 and previous day's LIJIN_6 < 30
        df['LIJIN_10'] = (df['LIJIN_6'] > df['LIJIN_8']) & (df['LIJIN_6'].shift(1) < 30)

        # LIJIN_11: Filtering condition
        df['LIJIN_11'] = df['LIJIN_10']

        # LIJIN_12: If KDJ.J > 100 then 90, else 100
        df['LIJIN_12'] = np.where(J > 100, 90, 100)

        # LIJIN_13: LIJIN_6 > LIJIN_8 and previous day's LIJIN_6 > 70
        df['LIJIN_13'] = (df['LIJIN_6'] > df['LIJIN_8']) & (df['LIJIN_6'].shift(1) > 70)

        # LIJIN_14: LIJIN_13 condition
        df['LIJIN_14'] = df['LIJIN_13']

        self.data = df

    def plot_indicator(self, start_date=None, end_date=None, figsize=(12, 10)):
        """Plot LIJIN indicator chart"""
        df = self.data.copy()

        if start_date and end_date:
            df = df.loc[start_date:end_date]

        fig, (ax1, ax2) = plt.subplots(2, 1, figsize=figsize, height_ratios=[2, 1])

        # Plot price and LIJIN indicators
        ax1.plot(df.index, df['LIJIN_6'], label='LIJIN_6', color='blue', linewidth=1.5)
        ax1.plot(df.index, df['LIJIN_8'], label='LIJIN_8', color='orange', linewidth=1.5)
        ax1.plot(df.index, df['AAA'], label='AAA', color='red', linewidth=1)

        # Plot bar chart
        # Red bars: LIJIN_6 > LIJIN_8
        red_condition = df['LIJIN_6'] > df['LIJIN_8']
        for i, (idx, row) in enumerate(df.iterrows()):
            if red_condition.loc[idx]:
                ax1.bar(i, row['LIJIN_6'] - row['LIJIN_8'],
                       bottom=row['LIJIN_8'], color='red', alpha=0.6, width=0.8)

        yellow_condition1 = df['LIJIN_2']  # CROSS(9.9, LIJIN_1)
        yellow_condition2 = df['LIJIN_10']  # LIJIN_6 > LIJIN_8 and previous day < 30

        for i, (idx, row) in enumerate(df.iterrows()):
            if yellow_condition1.loc[idx]:
                ax1.bar(i, 5, bottom=row['LIJIN_6'], color='yellow', alpha=0.8, width=0.8)
            if yellow_condition2.loc[idx]:
                ax1.bar(i, 5, bottom=row['LIJIN_6'], color='yellow', alpha=0.8, width=0.8)

        green_condition1 = (df['LIJIN_12'] > 99.9)  # CROSS(LIJIN_12, 99.9)
        green_condition2 = df['LIJIN_13']  # LIJIN_6 > LIJIN_8 and previous day > 70

        for i, (idx, row) in enumerate(df.iterrows()):
            if green_condition1.loc[idx]:
                ax1.bar(i, -5, bottom=row['LIJIN_6'], color='green', alpha=0.8, width=0.8)
            if green_condition2.loc[idx]:
                ax1.bar(i, -5, bottom=row['LIJIN_6'], color='green', alpha=0.8, width=0.8)

        # Draw horizontal lines
        ax1.axhline(y=20, color='green', linestyle='--', alpha=0.7, label='20 Level')
        ax1.axhline(y=50, color='green', linestyle='--', alpha=0.7, label='50 Level')
        ax1.axhline(y=80, color='green', linestyle='--', alpha=0.7, label='80 Level')

        ax1.set_title('LIJIN Indicator', fontsize=14, fontweight='bold')
        ax1.set_ylabel('LIJIN Value')
        ax1.legend()
        ax1.grid(True, alpha=0.3)

        # Plot price chart
        ax2.plot(df.index, df['close'], label='Close Price', color='black', linewidth=1.5)

        buy_signals = df[df['buy_signal']]
        sell_signals = df[df['sell_signal']]

        ax2.scatter(buy_signals.index, buy_signals['close'],
                   color='red', marker='^', s=100, label='Buy Signal', zorder=5)
        ax2.scatter(sell_signals.index, sell_signals['close'],
                   color='green', marker='v', s=100, label='Sell Signal', zorder=5)

        ax2.set_title('Price with Trading Signals', fontsize=14, fontweight='bold')
        ax2.set_ylabel('Price')
        ax2.set_xlabel('Date')
        ax2.legend()
        ax2.grid(True, alpha=0.3)

        plt.tight_layout()
        plt.show()

        return fig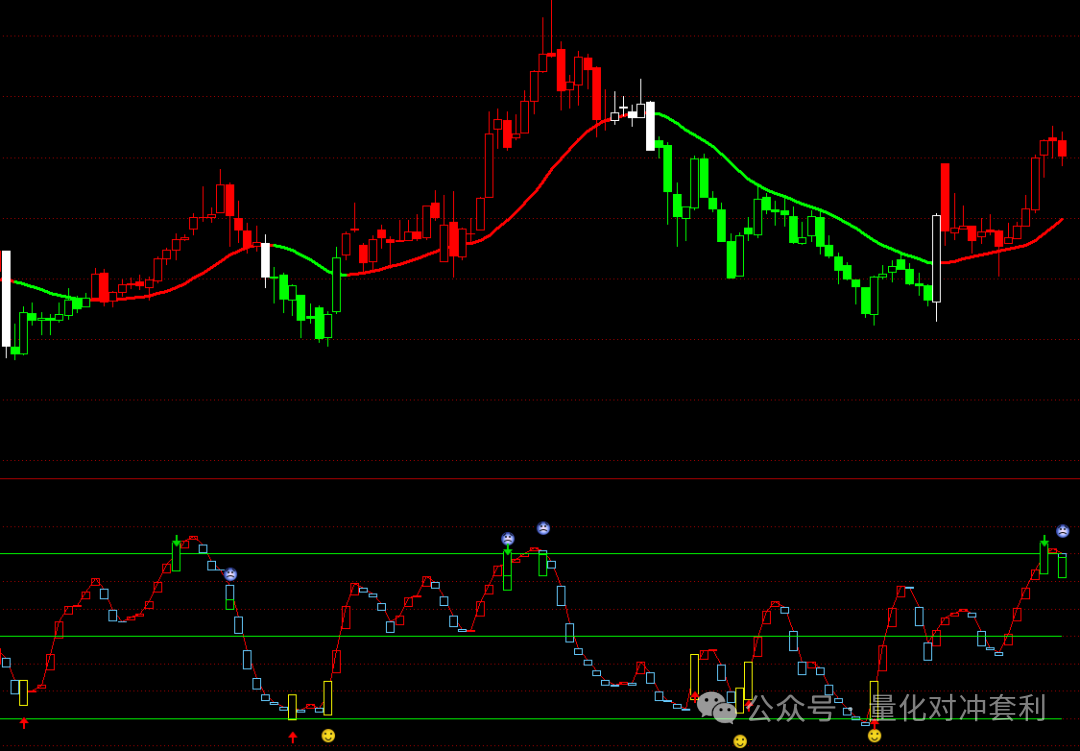
4. Indicator Formula Source Code
LIJIN_1:=IF(KDJ.J(27,3,3)<0,10,0);LIJIN_2:=CROSS(9.9,LIJIN_1);LIJIN_3:=(2*CLOSE+HIGH+LOW)/4;LIJIN_4:=LLV(LOW,5);LIJIN_5:=HHV(HIGH,5);LIJIN_6:=EMA((LIJIN_3-LIJIN_4)/(LIJIN_5-LIJIN_4)*100,5);LIJIN_7:=1;LIJIN_8:=MA(LIJIN_6,2)*LIJIN_7;AA:STICKLINE(LIJIN_6>LIJIN_8,LIJIN_6,LIJIN_8,3,1)*LIJIN_7,COLORRED;LIJIN_9:=1;AAA:IF(LIJIN_6>LIJIN_8,LIJIN_6,LIJIN_8),COLORRED;LIJIN_10:=STICKLINE(LIJIN_6>LIJIN_8&&REF(LIJIN_6,1)<30,LIJIN_6,LIJIN_8,3,1);STICKLINE(LIJIN_6<=LIJIN_8,LIJIN_6,LIJIN_8,3,1)*LIJIN_9,COLORFFCC66;DRAWICON(CROSS(9.9,LIJIN_1),LIJIN_6-12,5)*LIJIN_9;STICKLINE(CROSS(9.9,LIJIN_1),LIJIN_6+5,LIJIN_8-4,3,1)*LIJIN_9,COLORYELLOW;LIJIN_11:=STICKLINE(LIJIN_10,LIJIN_6+5,LIJIN_8-4,3,1)*LIJIN_7;STICKLINE(FILTER(LIJIN_11,5),LIJIN_6+5,LIJIN_8-4,3,1)*LIJIN_9,COLORYELLOW;V20:20,COLORGREEN;V50:50,COLORGREEN;V80:80,COLORGREEN;LIJIN_12:=IF(KDJ.J(27,3,3)>100,90,100);DRAWICON(CROSS(LIJIN_12,99.900002),LIJIN_6+12,6)*LIJIN_7;LIJIN_13:=LIJIN_6>LIJIN_8&&REF(LIJIN_6,1)>70;STICKLINE(CROSS(LIJIN_12,99.900002),LIJIN_6,LIJIN_8-9,3,1)*LIJIN_7,COLORGREEN;LIJIN_14:=STICKLINE(LIJIN_13,LIJIN_6+5,LIJIN_8-4,3,1);STICKLINE(FILTER(LIJIN_14,5),LIJIN_6+5,LIJIN_8-4,3,1),COLORGREEN;DRAWICON(FILTER(LIJIN_10,5),LIJIN_6-8,1);DRAWICON(FILTER(LIJIN_13,5),LIJIN_6+8,2);Risk Warning: This indicator is for technical research and learning exchange only. The market has a high degree of uncertainty, and any decisions based on the indicator must be made with caution and at your own risk, and do not constitute any investment advice.

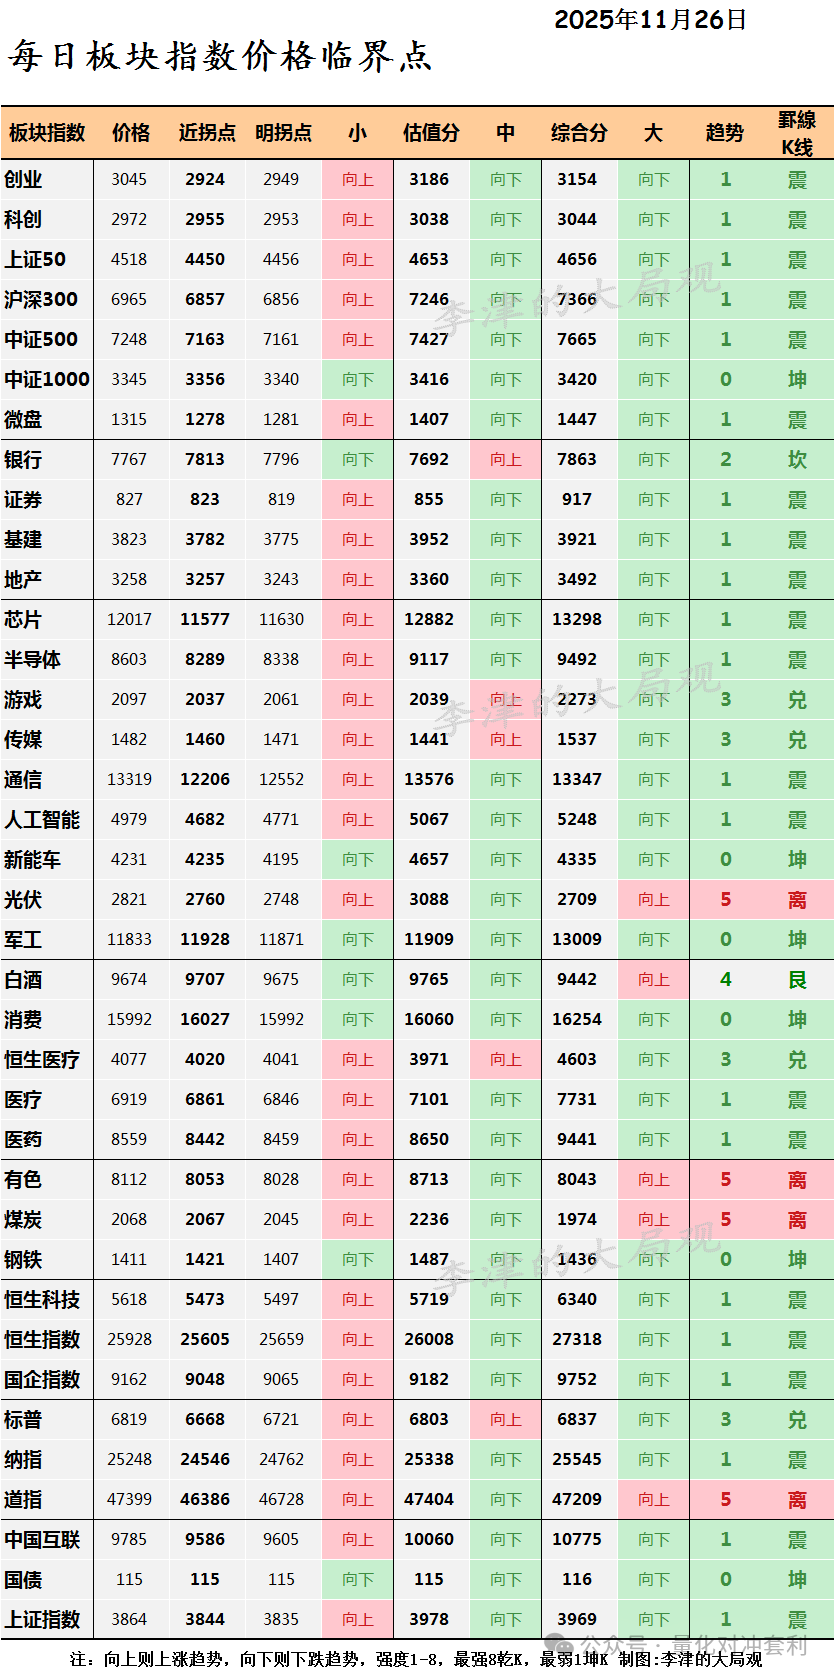
Open the image – long press – translate (Chinese)
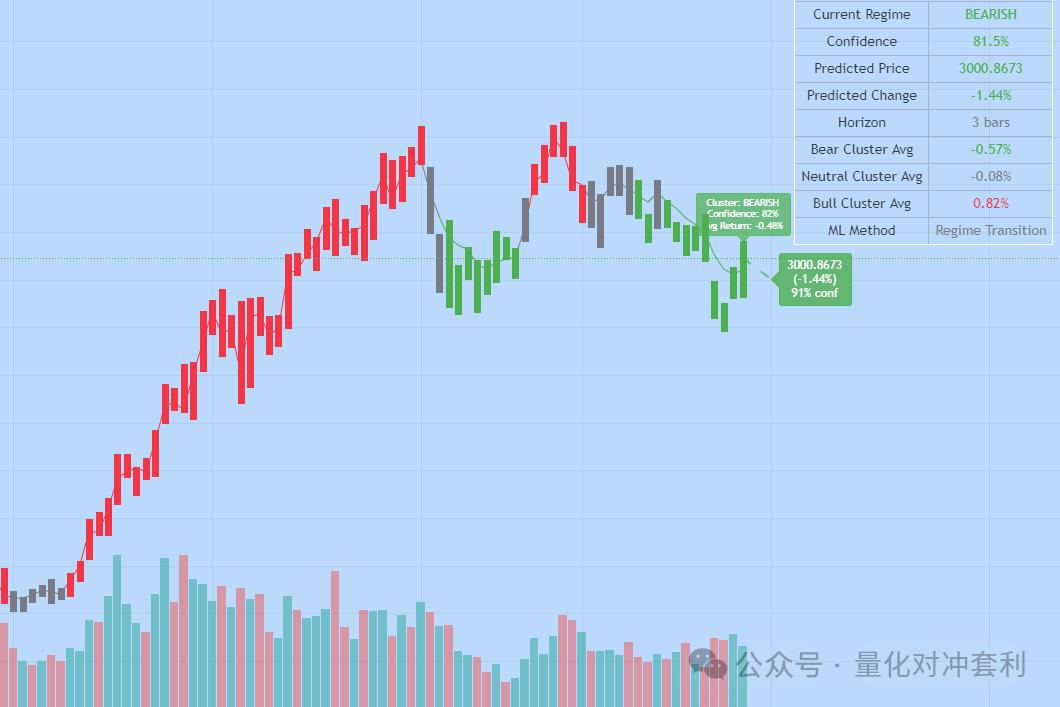
Shenzhen Index Daily Artificial Intelligence/Machine Learning
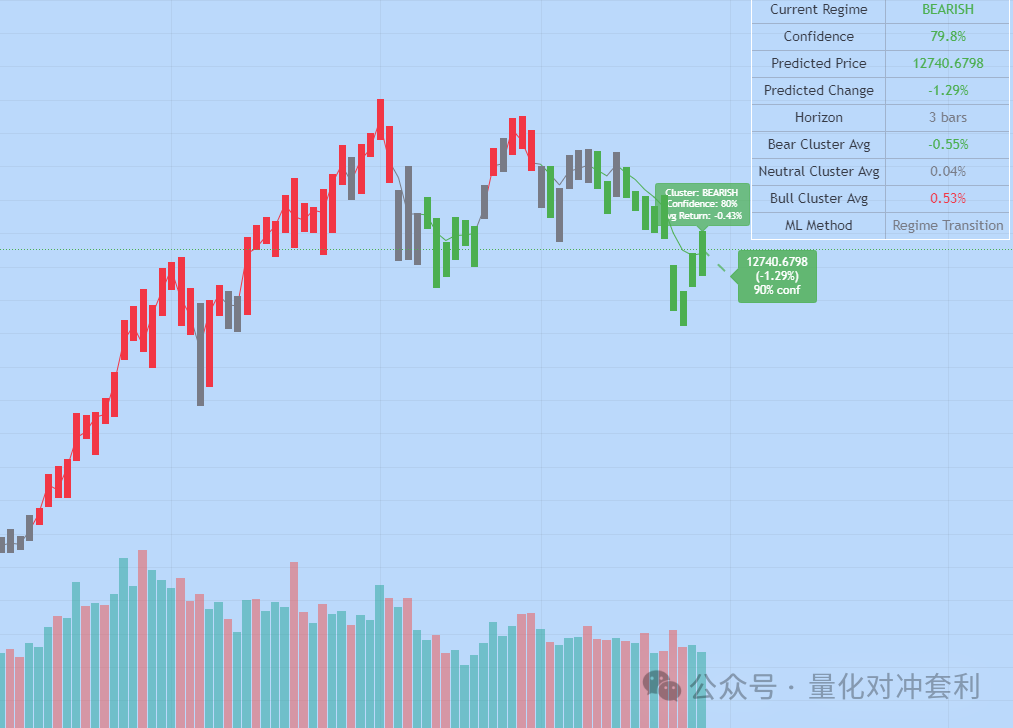
Shanghai Composite Index Daily Artificial Intelligence/Machine Learning
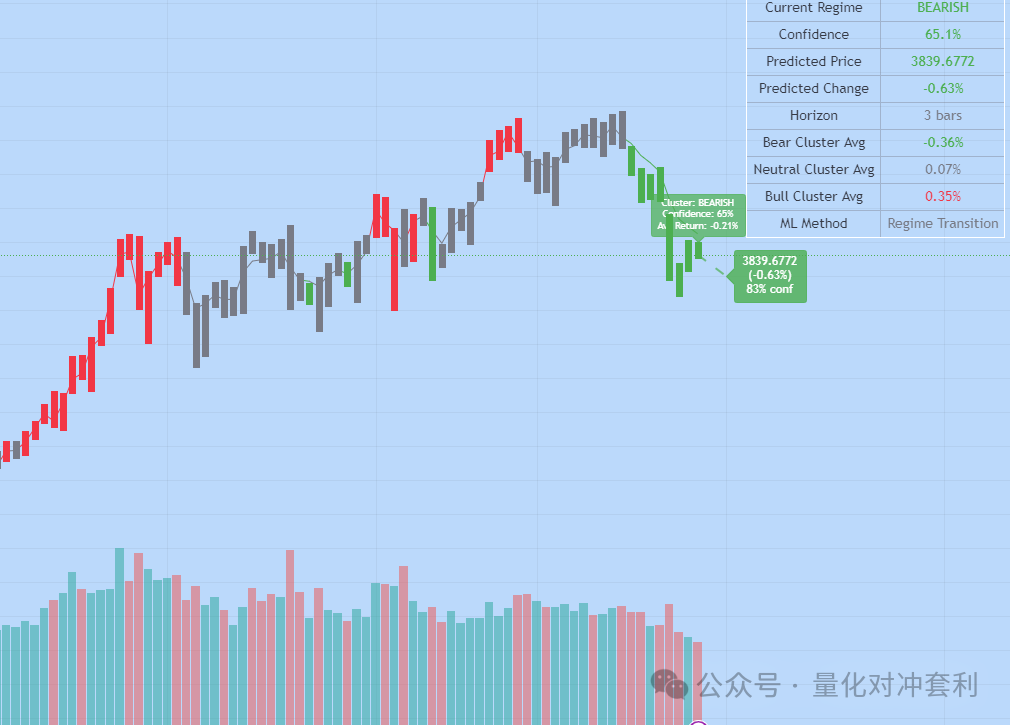
STAR Market Index Daily Artificial Intelligence/Machine Learning
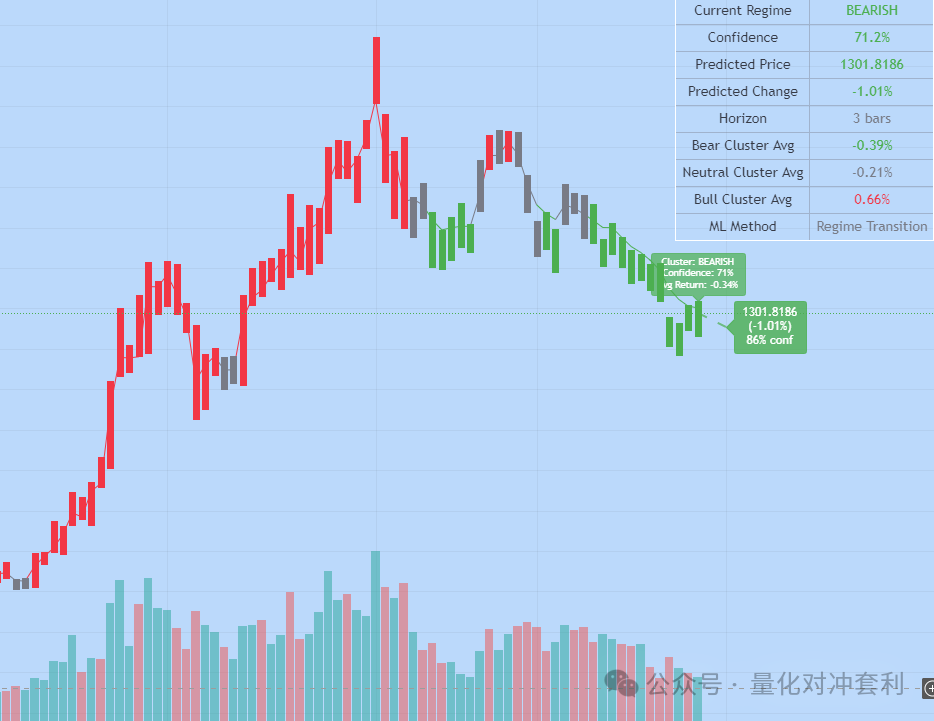
ChiNext Index Daily Artificial Intelligence/Machine Learning