Note: This is a practical machine learning project (including data + code + documentation), if you need data + code + documentation you can directly obtain it at the end of the article

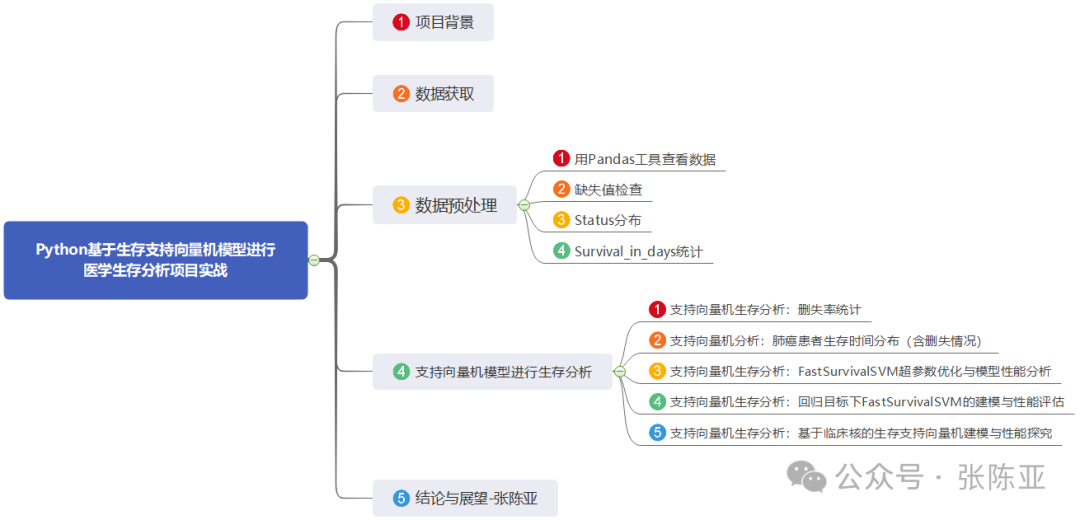
1. Project Background
This project is based on the Survival Support Vector Machine (Survival SVM) model, conducting medical survival analysis on clinical data of lung cancer patients. By using the Veteran’s lung cancer dataset and combining linear and kernel methods from the scikit-survival library, we construct a predictive model capable of handling censored data to assess the risk of survival time for patients under different treatment conditions. The project focuses on comparing the performance of the standard FastSurvivalSVM with the FastKernelSurvivalSVM based on clinical mixed kernels in terms of the concordance index (C-index), and optimizes the regularization parameter α using grid search and cross-validation. The research results help improve the accuracy of clinical prognosis assessment and provide data-driven support for personalized treatment decisions.
This project is a practical implementation of medical survival analysis using the Survival Support Vector Machine model in Python.
2. Data Acquisition
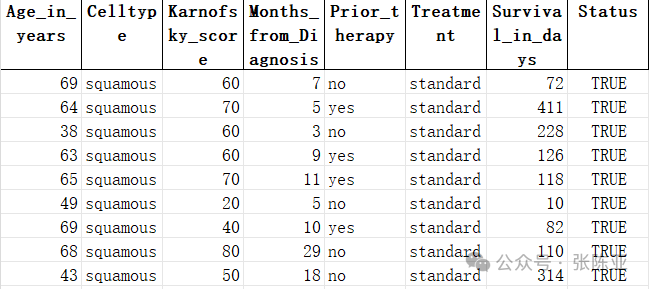
The modeling data is sourced from the internet (compiled by the author of this project), with the following data items:
|
Number |
Variable Name |
Description |
|
1 |
Age_in_years |
Age of the patient at enrollment (in years) |
|
2 |
Celltype |
Type of lung cancer cells (e.g., squamous cell carcinoma, small cell carcinoma, etc.), classified as a categorical variable |
|
3 |
Karnofsky_score |
Karnofsky Performance Status (KPS) score, used to assess the patient’s ability to perform daily activities and health status, with higher scores indicating better physical condition (typically ranging from 0 to 100) |
|
4 |
Months_from_Diagnosis |
Months from initial diagnosis of lung cancer to enrollment in this study |
|
5 |
Prior_therapy |
Whether prior treatment (e.g., chemotherapy or radiotherapy) was received, typically a binary variable (“Yes” or “No”) |
|
6 |
Treatment |
Treatment regimen received by the patient in this study (e.g., standard treatment vs. experimental treatment) |
|
7 |
Survival_in_days |
Time from enrollment to event occurrence (death) or censoring, measured in days |
|
8 |
Status |
Event indicator variable, True (or 1) indicates an observed death event, while False (or 0) indicates data was censored (i.e., patient lost to follow-up or still alive at the end of the study) |
Data details are as follows (partial display):
3. Data Preprocessing
3.1 Viewing Data with Pandas
Use the head() method of the Pandas library to view the first five rows of data:
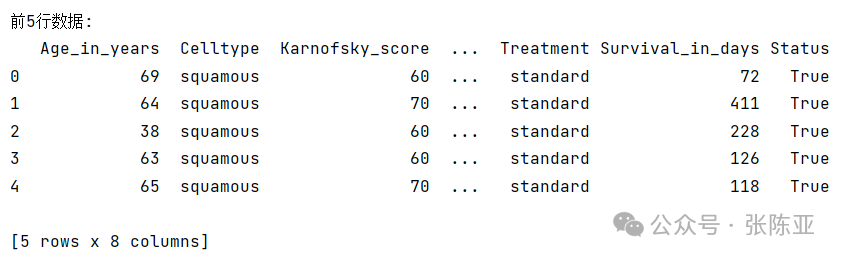
Key code:
3.2 Missing Value Check
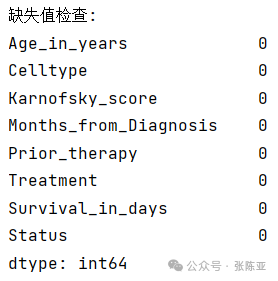
As shown in the figure above, there are no missing values.
3.3 Status Distribution
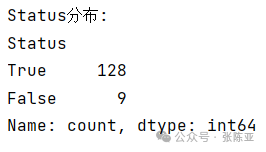
Status distribution shows: 128 patients died during the study (True), and 9 cases were censored (False). This indicates that the vast majority of samples in this dataset observed the occurrence of events, with a low censoring rate (approximately 6.5%), making it suitable for survival analysis. The data integrity is high, enhancing the reliability of model training.
3.4 Statistics of Survival_in_days
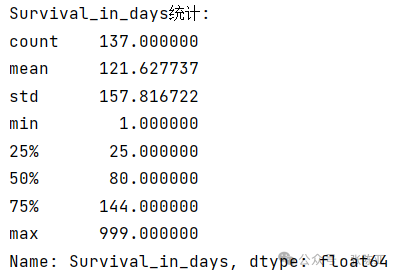
The statistics of Survival_in_days show that among 137 patients, the average survival time is 121.63 days, with a standard deviation of 157.82 days, indicating significant variability in survival times among individuals. The minimum survival time is 1 day, and the maximum is 999 days, indicating the presence of both short and long survival periods. The median is 80 days, which is lower than the mean, suggesting that the data is right-skewed (positively skewed), meaning that a few patients with longer survival times raise the average. The 25th percentile is 25 days, and the 75th percentile is 144 days, showing that most patients’ survival times are concentrated between 25 and 144 days. The overall distribution exhibits a significant skewness, which needs to be considered in modeling due to its non-normality effects.
4. Survival Analysis Using Support Vector Machine
4.1 Survival Analysis with Support Vector Machine: Censoring Rate Statistics

In this dataset, 6.6% of the records are censored data, meaning some patients were still alive or lost to follow-up at the end of the study and did not observe a death event. The low censoring rate indicates that the survival outcomes of most patients have been fully observed, which is beneficial for training and evaluating survival analysis models. The low censoring rate enhances the reliability of the results, but it is still necessary to correctly handle censoring information in modeling to avoid bias.
4.2 Survival Analysis with Support Vector Machine: Distribution of Survival Times for Lung Cancer Patients (Including Censoring)
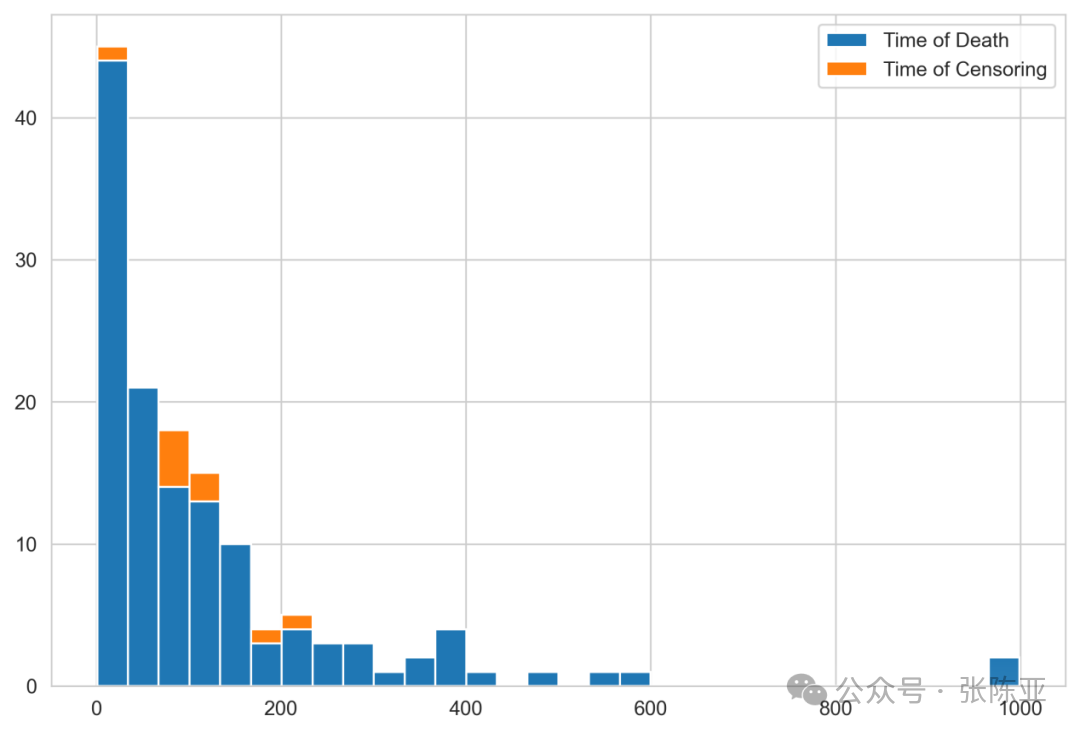
This histogram shows the distribution of patient survival times, with blue bars representing the time of death events and orange representing the time of censoring. From the figure, it can be seen that most death events are concentrated within 0–100 days, especially with a peak in the first 30 days, indicating a high early mortality rate. As survival time extends, the number of deaths decreases rapidly, indicating that most patients have poor prognosis in the short term. Censored data is mainly distributed within 100 days and is relatively few, consistent with the low censoring rate (6.6%). A few patients survived beyond 400 days, even close to 1000 days, indicating that some individuals have longer survival periods. The overall distribution shows a right-skewed pattern, suggesting a long-tail effect. This distribution characteristic is of significant guiding importance for the selection and evaluation of survival models, necessitating a focus on early risk prediction and the identification of long-term survivors.
4.3 Survival Analysis with Support Vector Machine: Hyperparameter Optimization and Model Performance Analysis of FastSurvivalSVM
|
Number |
Model Name |
Parameters |
|
1 |
Support Vector Machine Survival Analysis Model |
max_iter=1000 |
|
2 |
tol=1e-5 |
|
|
3 |
random_state=0 |
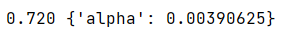
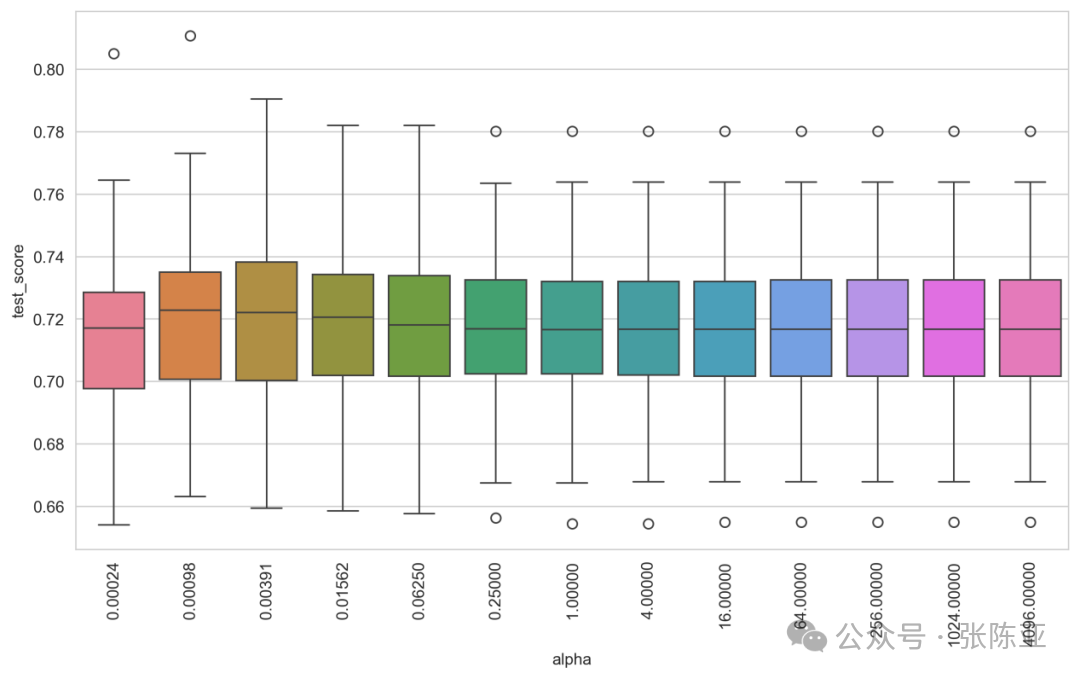
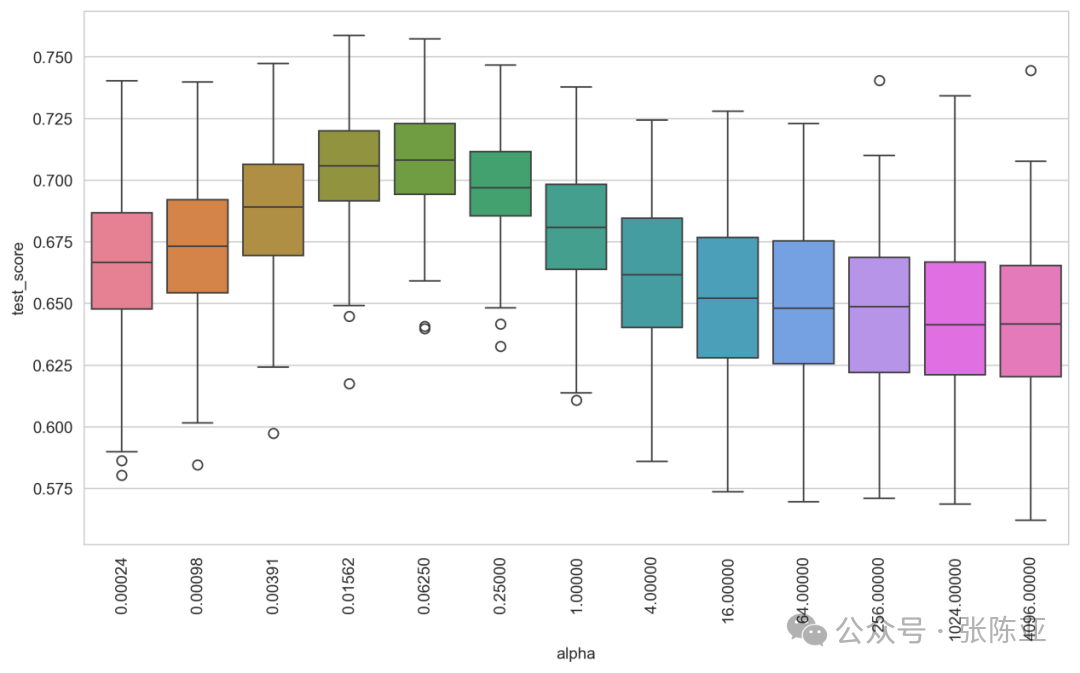
This analysis process demonstrates the hyperparameter optimization process based on the FastSurvivalSVM model, focusing on the impact of the regularization parameter α on model performance. First, the model is initialized with default parameters, and a scoring function is defined using the Harrell concordance index (C-index) as the evaluation metric to ensure the model has good predictive capability in survival analysis tasks. Then, GridSearchCV is used for grid search, setting 13 different α values (from 2⁻¹² to 2¹²), and employing 100 random training/testing splits (ShuffleSplit) for cross-validation, executing a total of 1300 model fittings to thoroughly assess the stability and generalization ability of each parameter combination. The final results show that the best average C-index is 0.720, corresponding to an optimal α value of approximately 0.0039, indicating that the model performs better at a lower regularization strength. The box plot shows that the test score distribution across different α values is relatively concentrated with small fluctuations, indicating that the model is robust to the choice of α, with little performance variation. This suggests that even without precise parameter tuning, the model can maintain relatively stable predictive performance, enhancing its reliability and practicality in clinical applications.
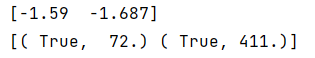
This analysis shows the prediction results after training the FastSurvivalSVM model with optimal hyperparameters (α ≈ 0.0039). After refitting the model with the best parameters, the survival risks for the first two samples are predicted, yielding negative values (-1.59 and -1.687), indicating risk scores. Since the model operates under a ranking objective (r=1), higher predicted values represent greater risk and shorter survival times; conversely, lower predicted values indicate lower risk and longer survival periods. The results show that the first sample has a higher predicted value (-1.59 > -1.687), indicating slightly higher risk, but the actual survival time is 72 days, while the second sample has a survival time of 411 days, indicating that the predictions align with the actual survival time trends, validating that the model has good consistency. This indicates that the model can effectively capture survival differences among patients, possessing certain clinical predictive value.
4.4 Survival Analysis with Support Vector Machine: Modeling and Performance Evaluation of FastSurvivalSVM under Regression Objective
|
Number |
Model Name |
Parameters |
|
1 |
Support Vector Machine Survival Analysis Model |
rank_ratio=0.0 |
|
2 |
max_iter=1000 |
|
|
3 |
tol=1e-5 |
|
|
4 |
random_state=0 |
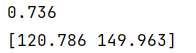
This analysis demonstrates the modeling process and performance evaluation of FastSurvivalSVM under the regression objective (rank_ratio=0.0). Unlike the ranking objective, the regression objective interprets predicted values as estimates of survival time rather than risk scores: higher predicted values indicate longer expected survival times, and vice versa. Since the concordance_index_censored function requires input as risk scores (i.e., high values represent high risk and short survival), the predicted results of the regression model need to be negated to convert them into risk score format for consistency index calculation. In the experiment, after training the model using ref_estimator = FastSurvivalSVM(rank_ratio=0.0), the predicted survival times for the first two samples are 120.786 days and 149.963 days, indicating that the second patient is predicted to have a longer survival period, consistent with the actual data (72 days vs. 411 days). The final model’s concordance index is 0.736, slightly higher than the ranking model’s 0.720, indicating that the regression objective performs better on this dataset. Additionally, the model internally applies a logarithmic transformation to the skewed survival times to enhance regression stability. This indicates that under appropriate settings, regression-based survival SVM can effectively capture survival time patterns, demonstrating good clinical predictive potential.
4.5 Survival Analysis with Support Vector Machine: Modeling and Performance Exploration of Kernel Survival Support Vector Machine Based on Clinical Kernel
|
Number |
Model Name |
Parameters |
|
1 |
Support Vector Machine Survival Analysis Model |
optimizer=”rbtree” |
|
2 |
kernel=”precomputed” |
|
|
3 |
random_state=0 |

This analysis focuses on the modeling process and performance evaluation of Kernel Survival Support Vector Machine (KSSVM) in the survival prediction task for lung cancer patients. Compared to linear survival SVM, KSSVM can capture more complex nonlinear relationships between features and survival times by introducing kernel functions (such as clinical kernels), making it particularly suitable for clinical data that includes continuous, ordinal, and categorical variables. In this case, the clinical_kernel is used as a custom kernel function, which can effectively distinguish different data types and construct similarity measures suitable for medical data, thereby enhancing the model’s expressive power.
First, the clinical_kernel is used to preprocess the original feature matrix, generating a precomputed kernel matrix, which is then input into the FastKernelSurvivalSVM model instead of the raw data, which is a key step in using precomputed kernels. To optimize model performance, GridSearchCV is employed to perform a grid search on the regularization parameter α, combined with 100 random splits for cross-validation to comprehensively assess model performance under different α values. The results show that the best average concordance index (C-index) is 0.709, corresponding to an optimal α value of approximately 0.015625, slightly lower than the linear model’s 0.720, indicating that while the current kernel function enhances model flexibility, it has not fully realized its advantages.
From the box plot, it can be seen that different α values significantly impact model performance, showing greater sensitivity compared to the linear model, indicating that kernel parameter selection is crucial. However, the performance not exceeding that of the linear model also reflects that despite kernel methods theoretically being more expressive, the design and tuning of kernel functions are challenging; if they do not adequately match the data structure, they may introduce overfitting or information loss. Therefore, selecting an appropriate kernel function is not only key to improving performance but also a complex and non-trivial task. This experiment emphasizes the need to balance model complexity and interpretability in practical applications and suggests exploring other kernel functions or combining feature engineering to further uncover potential patterns.
5. Conclusion and Outlook
This study compares the performance of linear and kernel survival support vector machines in predicting survival for lung cancer patients, verifying that FastSurvivalSVM has a superior concordance index (C-index ≈ 0.720) under linear settings, while the KSSVM with clinical kernel, although possessing the potential to model nonlinear relationships, performs slightly lower (C-index ≈ 0.709), indicating that the choice and adaptation of kernel functions are crucial for model effectiveness. Future explorations could focus on more efficient kernel designs, feature engineering, or ensemble methods, combined with advanced architectures like deep learning, to further enhance survival prediction accuracy. Additionally, applying the model to more clinical scenarios and conducting prospective validations is expected to promote the development of personalized prognosis assessment and precision medicine.
Project practical collection navigation:
https://docs.qq.com/sheet/DTVd0Y2NNQUlWcmd6?tab=BB08J2 | Python Project Collection |
| Thesis System |
| MATLAB Project Collection |
| Special Training Camp |
| Full and Partial Paper Services |
| Data Collection |
| Free Material Access |
| R Project Collection |
——Welcome to follow our public account——