Classification number: TP274 Document identification code: A
Article number: 2095-1302 (2022) 09-0013-04
0 Introduction
Water quality hygiene and safety are closely related to human health, making water quality monitoring of great significance. With the advancement of technology, many research results have been achieved in the field of water quality monitoring. Currently, most water quality monitoring systems have realized wireless data transmission and real-time monitoring, but still suffer from issues of poor stability and reliability, difficult maintenance, and inability to accurately analyze water quality conditions. To address these issues, a multi-sensor data fusion water quality monitoring system based on the Harmony operating system has been designed, which can achieve real-time monitoring and analysis of water quality, accurately and intuitively obtaining water quality conditions.
1 System Overall Design
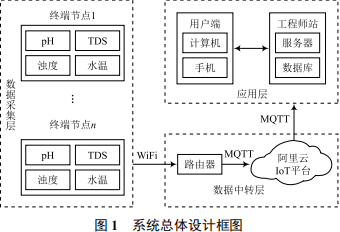
The structure of the water quality monitoring system is shown in Figure 1. The system is divided into three parts:
(1) Data acquisition layer: Harmony OS is the core of the entire terminal, mainly responsible for receiving the analog signals from the sensors, converting them through AD conversion, and uploading to the data transfer layer via the internally integrated WiFi module; (2) Data transfer layer: An information transmission platform based on the WiFi protocol, where terminal nodes connect to the WiFi hotspot and then use the MQTT protocol to connect to the Alibaba Cloud IoT platform and human-computer interaction software; (3) Human-computer interaction layer: The user and engineer stations together form the human-computer interaction layer, enabling business management of terminal devices.
2 System Hardware Design
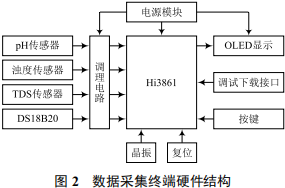
The microcontroller unit uses the Hi3861V100 (referred to as Hi3861) chip, which is a highly integrated 2.4 GHz WiFi system-on-chip that integrates IEEE802.11b/g/n baseband and radio frequency (RF) circuits. The Hi3861 chip can simply, quickly, and cost-effectively implement device control and network connectivity functions, suitable for IoT terminal fields such as smart home appliances.
To convert the analog signals measured by pH, TDS (Total Dissolved Solids), and turbidity sensitive components into signals suitable for ADC and microcontroller acquisition, conditioning circuits for the three detection parameters were designed, where pH and turbidity used ADS1118 as an external ADC, enhancing detection accuracy. Since pH and TDS are greatly affected by temperature, the DS18B20 was used for precise temperature measurement, allowing for temperature compensation for pH and TDS. After signal processing by the Hi3861 chip for the four detection parameters, the detection values are obtained and displayed in real-time on an OLED screen. The power supply part uses a 220 V to 5 V adapter for power supply. The button part can implement power on/off, data hold, and calibration functions. The hardware structure of the data acquisition terminal is shown in Figure 2.
2.1 pH Conditioning Circuit Design
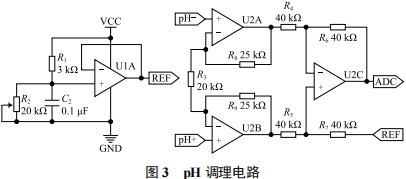
pH refers to the concentration index of hydrogen ions in a solution, often used to indicate the acidity or alkalinity of a solution. At a pressure of 100 kPa, a solution with pH=7 is neutral, pH>7 is alkaline, and pH<7 is acidic. The system uses the Leici E-201-C composite pH electrode, where changes in the hydrogen ion concentration of the measured solution cause changes in the electromotive force of the internal reference electrode, which forms a linear function relationship. The pH conditioning circuit is shown in Figure 3, where the U2 part is a differential amplifier circuit, and the output of U2 is the amplified differential signal. To ensure that the amplified signal is within the input range of the ADC chip, the U1 part is used for voltage elevation.
2.2 TDS Conditioning Circuit
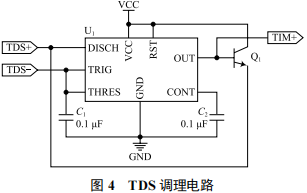
TDS refers to the total dissolved solids, indicating the total amount of various ions, molecules, and compounds dissolved in water, excluding suspended solids and dissolved gases. This article uses the frequency method to measure TDS, constructing a multi-resonant oscillation circuit with the 555 chip as the core, which can continuously output frequency signals. Based on the relationship between frequency and TDS, the value of TDS can be obtained. The TDS conditioning circuit is shown in Figure 4.
2.3 Turbidity Conditioning Circuit
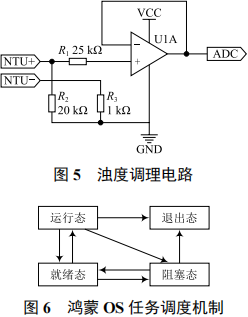
Turbidity refers to the degree of obstruction that the sample water quality solution produces against emitted light, including the scattering of light by suspended solids and the absorption of light by solute molecules. Turbidity is related not only to the content of suspended solids in water but also to their size, shape, and refractive index. The system uses the TS-300B scattering turbidity sensor, which consists of a photodiode and a light-emitting diode that transmit and receive infrared light, ultimately outputting an electrical signal. The turbidity conditioning circuit is shown in Figure 5, using the U1 operational amplifier to buffer the output voltage, enhancing signal driving capability.
3 System Software Design
3.1 Lower Computer Software Design
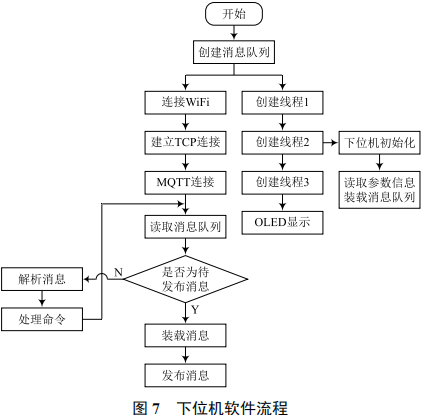
The task module of Harmony OS has 32 priorities, enabling communication and switching between tasks. The tasks in Harmony OS use a preemptive scheduling mechanism, where high-priority tasks can interrupt low-priority tasks, and low-priority tasks can only be scheduled after high-priority tasks are blocked or completed. The task scheduling mechanism of Harmony OS is shown in Figure 6.
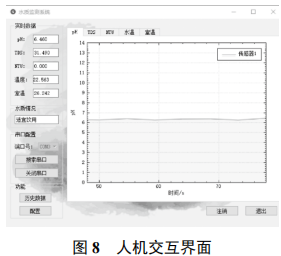
Based on the characteristics of Harmony OS and actual needs, three tasks with different priorities were set: (1) Water quality detection task: used to obtain pH, TDS, turbidity, and other water quality detection parameters and calculate them, then display in real-time on the OLED screen; (2) Data loading task: used to read and load data from the water quality detection task, preparing for the network communication task; (3) Network communication task: connects the detection terminal to the WiFi hotspot and then connects to the Alibaba Cloud IoT platform via MQTT protocol. After powering on the system, the peripheral initialization and Harmony OS system initialization are completed, and new tasks are established in the main function to start the program. The lower computer software flow of Harmony OS is shown in Figure 7.
3.2 Upper Computer Software Design
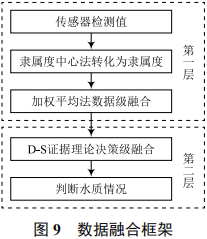
The PC upper computer software was written using Qt, with C++ as the programming language for software development. The upper computer can connect to the Alibaba Cloud IoT platform via MQTT protocol and subscribe to the messages published by the Alibaba Cloud IoT platform, ultimately sending the detection data from the data acquisition terminal to the upper computer software using the data flow function of the Alibaba Cloud platform, which can process the received data and display dynamic curves. The detection data from multiple sensors can be displayed in real-time on the upper computer, and data fusion can be performed using the membership center method, weighted average method, and D-S evidence theory, obtaining scientific water quality analysis. The upper computer software, combined with the MySQL database, can achieve user management, data storage, and historical record query functions. Some interfaces of the upper computer software are shown in Figure 8.
4 Data Fusion
Data fusion is an important technology for analyzing and processing water quality monitoring data, integrating local observations provided by multiple similar or different sensors distributed in different locations, eliminating possible information redundancy and contradictions between multiple sensors, forming a relatively complete perception description of water quality conditions.
The data fusion framework of this system consists of two layers, as shown in Figure 9. The first layer of the fusion framework converts the received pH, TDS, and turbidity into membership degrees through the membership center method, integrating the membership degrees of multiple sensors through adaptive weighting. The second layer of the fusion framework uses the fused membership degrees as basic probability assignments and performs decision-level fusion processing using the D-S evidence theory algorithm.
4.1 Membership Center Method
To intuitively and scientifically understand water quality conditions, taking the drinking water quality standards as an example, three water quality levels were set according to the “Sanitary Standards for Drinking Water” (GB5749-2006) and expert experience: suitable for drinking (Class I), can be drunk (Class II), and not suitable for drinking (Class III). Based on the characteristics of drinking water samples and fuzzy rules, the Gaussian membership function was used to calculate the membership values corresponding to different parameters in the water samples. The expression of the membership function is:
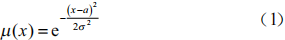
Where: x is the detected water quality parameter value; a is the characteristic parameter of the water quality level; σ is the maximum deviation of the characteristic of the water quality level.
4.2 Adaptive Weighted Average Method
The weighted average method can assign weights to each sensor’s measurement value according to a certain principle, obtaining an overall estimate of a target event. The adaptive weighted average method can adaptively change the weights based on the sensor’s status, making weight distribution more accurate. This method can effectively handle data redundancy while considering each sensor, demonstrating strong robustness. The following formula can be used to adaptively weight the membership:
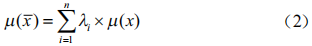
Where n is the number of sensors; λ is the corresponding weight of the sensor, which can be obtained as follows:
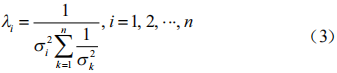
Where σ is the variance of the sensor detection values over a certain period.
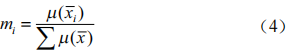
To prevent membership degrees from being less than or equal to 1, normalization correction of the membership degrees is required, as follows:
4.3 D-S Evidence Theory
D-S evidence theory is a fuzzy reasoning theory that can fuse the basic probability assignments (BPA) of multiple pieces of evidence, possessing the capability to handle multi-source uncertain information, thus widely applied in the field of multi-sensor information fusion.
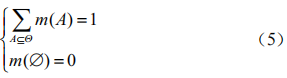
The recognition framework in D-S evidence theory, Θ, contains N mutually exclusive and exhaustive propositions. For any proposition A, it belongs to the power set 2Θ. The BPA defined in 2Θ satisfies the following:
The corresponding synthesis rule is:
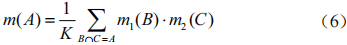
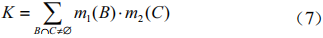
Where K is the normalization constant, expressed as:
5 Simulation and Experiment
5.1 Simulation
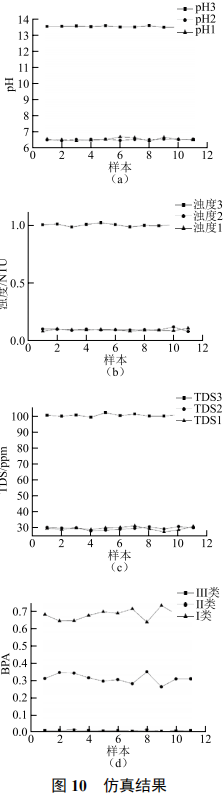
Simulations of the pH, TDS, and turbidity parameters of terminals 1 to 3 over a certain period of time. Among them, terminals 1 and 2 simulated detection data under Class I water quality conditions, while terminal 3 served as a high-conflict evidence design to verify the scientificity of data fusion decisions in the presence of high-conflict evidence. The simulation data and fusion results are shown in Figure 10. According to the simulation results in Figure 10 (d), the BPA for Class I water quality is around 0.7, indicating that the data fusion algorithm remains logical even in the presence of high-conflict evidence. This indicates that the algorithm addresses the defects of high-conflict evidence fusion, solving the problem of data fusion results contradicting reality due to sensor failures during water quality monitoring.
5.2 Experiment
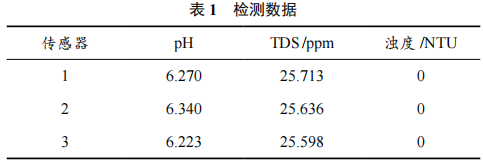
Using purified water as the experimental water, three data acquisition terminals were used to monitor the quality of purified water in real-time, and the detection results are shown in Table 1.
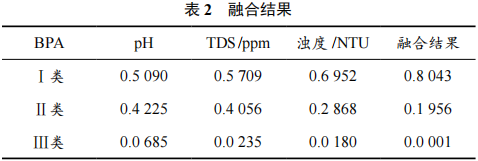
Based on the data fusion algorithm presented in this article, the data in Table 1 was fused.
As seen in Table 2: before fusion, the BPA for Class I water quality among the three water quality indicators was larger than the others; after fusion, the BPA for Class I water quality reached 0.8043, larger than the others and also greater than the BPA before fusion. This shows that the data fusion algorithm presented in this article is more scientific and effective.
6 Conclusion
Based on the advantages of Harmony OS and the needs of water quality monitoring, a system for multi-parameter water quality monitoring and water quality type analysis has been designed. This system utilizes multiple sensors to obtain water quality information in real-time, uploading the information to the Alibaba Cloud IoT platform via WiFi technology, and finally sending the data to the upper computer software for real-time display and water quality analysis. This system is developed based on Harmony OS, with multi-end deployment, strong scalability, and easy maintenance. Simulation and experimental results show that the system operates stably, has good real-time performance, and strong robustness, solving the problem of results contradicting reality due to sensor failures in data fusion, with broad application prospects.
Note: The corresponding author of this article is Ding Qing’an.
References
[1] Li Zhaojie. The significance of water quality monitoring in water resource protection and monitoring links [J]. Smart City, 2021, 7(5): 123-124.
[2] Wei Ruihua, Xu Lihong. Design and implementation of a water quality monitoring system for all water bodies [J]. Laboratory Research and Exploration, 2016, 35(1): 34-38.
[3] HAKIMI I M, JAMIL Z. Development of water quality monitoring device using Arduino UNO [C]// IOP Conference Series: Materials Science and Engineering. Batu Pahat, Johor, Malaysia: IOP Publishing Ltd, 2021: 012064.
[4] Luan Minghui, Li Songsong, Yang Ying, et al. Research on intelligent aquaculture technology based on STM32 [J]. IoT Technology, 2021, 11(6): 50-54.
[5] Qi Hao, Guan Hua, Gong Wanlin. Design of an IoT-based fish pond environmental monitoring system [J]. IoT Technology, 2018, 8(11): 72-73.
[6] Fan Xiaojiao, Ma Yahong, Xing Zhuo. Monitoring system for industrial wastewater pH based on cloud platform and LoRa [J]. IoT Technology, 2019, 9(3): 18-20.
[7] Yang Lei, Xiong Weihua, Jiang Ming. Household water quality detection system based on NB-IoT technology [J]. Computer System Applications, 2019, 28(12): 129-133.
[8] Qi Shengbo, Yin Baoan, Yu Jingdong. Design of turbidity detection system based on scattering and transmission methods [J]. Electromechanical Engineering, 2019, 36(8): 771-776.
[9] Xu Ziwen, Yue Xueting. Design and implementation of a home air quality monitoring and adjustment system based on HUAWEI LiteOS [J]. Electronic Production, 2020, 27(7): 31-34.
[10] Sun Yujie, Zhao Liqiang, Zheng Huize, et al. Design and implementation of integrated circuit testing software based on Qt [J]. Computer Measurement and Control, 2021, 29(5): 150-153.
[11] Zhang Yi, Yan Yixuan, Li Jing. Overview of traffic data collection systems based on multi-sensor fusion [J]. IoT Technology, 2021, 11(2): 15-18.