Introduction
In our work, we may encounter scenarios where we need to monitor the availability of APIs. Although the official blackbox-exporter supports HTTP status checks, its flexibility is limited, making it difficult to effectively monitor interfaces that require specific request headers or bodies. A tool similar to Postman is needed to periodically check the status of these interfaces and expose the results as metrics to Prometheus.
Applicable scenarios: Monitoring various interfaces called between application systems through the exporter, integrating the results into Prometheus, and visualizing them using Grafana. When failures or system lags occur, abnormal alerts and monitoring dashboards can quickly pinpoint the problematic interfaces, ensuring business availability.
Project Address: https://github.com/hzbb2221/services-status-exporter.git
Project Background
This tool is used to monitor the availability and response performance of critical business websites/services. By exposing Prometheus-compatible metrics, it can be integrated with visualization tools like Grafana for real-time monitoring and alerting of service status. It is suitable for health check scenarios of third-party dependent services in microservice architectures.
✨ Features
- 🔧 Multi-Configuration Support: Supports automatic loading of all YAML configuration files from the
<span>web</span>directory (supports<span>.yaml</span>and<span>.yml</span>extensions) - 🌐 Flexible Requests: Supports HTTP methods like GET/POST (automatically determined based on whether a
<span>body</span>is configured), allowing custom request headers/bodies - 📊 Accurate Monitoring: Provides dual-dimensional metrics for response time (histogram) and request status (counter), supporting grouping by site/status code
- 🚀 Lightweight Deployment: Supports three deployment methods: direct binary execution, Docker containerization, and Docker Compose orchestration
- 🔒 Secure Authentication: Supports TLS encryption and Basic Auth authentication
- ⚡ High Performance: Written in Go, with low memory usage and excellent concurrency performance
- 📈 Prometheus Compatible: Fully compatible with Prometheus metric formats, can be directly integrated into existing monitoring systems
🚀 Quick Start
Method 1: Docker Compose (Recommended)
# Start using docker-compose (recommended method)
docker-compose up -d
Method 2: Docker
# Run using Docker
docker run -d \
  --name services-status-exporter \
  -p 9112:9112 \
  -v $(pwd)/web:/app/web \
  services-status-exporter
Method 3: Direct Execution
# Download and run
./services-status-exporter
Monitoring Metrics Explained
| Metric Name | Type | Description | Labels |
|---|---|---|---|
<span>site_request_duration_seconds</span> |
Gauge | HTTP request response time (in seconds) | <span>site</span> (site URL), <span>method</span> (request method), <span>env</span> (environment), <span>service</span> (service name), <span>type</span> (type) |
<span>site_status_code</span> |
Gauge | HTTP response status code | <span>site</span> (site URL), <span>method</span> (request method), <span>env</span> (environment), <span>service</span> (service name), <span>type</span> (type) |
<span>site_request_total</span> |
Counter | Total number of requests (classified by request status) | <span>site</span> (site URL), <span>method</span> (request method), <span>status</span> (request status: success/error), <span>env</span> (environment), <span>service</span> (service name), <span>type</span> (type) |
<span>site_up</span> |
Gauge | Site availability status (1=available, 0=unavailable) | <span>site</span> (site URL), <span>method</span> (request method), <span>env</span> (environment), <span>service</span> (service name), <span>type</span> (type) |
<span>services_status_exporter_info</span> |
Gauge | Application information (version, build time, etc.) | <span>version</span> (version number), <span>build_time</span> (build time) |
<span>services_status_exporter_up</span> |
Gauge | Application running status (1=running, 0=stopped) | None |
📋 Configuration Instructions
Command Line Parameters
./services-status-exporter [options]

Options:
  -port int
        HTTP service port (default: 9112)
  -web-dir string
        Configuration file directory (default: "web")
  -web-config string
        Web server configuration file path (optional)
  -version
        Display version information
  -help
        Display help information
Monitoring Configuration File Specification
- The configuration file must be placed in the
<span>web</span>directory (modifiable via the<span>-web-dir</span>parameter) - Each file corresponds to a monitoring site, recommended to name in the format
<span>[site-name].yaml</span>(e.g.,<span>api-service.yaml</span>) - Multiple configuration files can exist simultaneously, and the program will automatically load all
<span>.yaml</span>and<span>.yml</span>files
Monitoring Configuration Parameters Explained
| Parameter Name | Type | Required | Default Value | Description |
|---|---|---|---|---|
<span>url</span> |
string | ✅ | – | The target URL to monitor |
<span>method</span> |
string | ❌ | GET | HTTP request method (GET/POST/PUT, etc.) |
<span>headers</span> |
map | ❌ | {} | Custom request headers |
<span>body</span> |
string | ❌ | “” | Request body content (automatically set to POST if present) |
<span>interval_seconds</span> |
int | ❌ | 60 | Monitoring interval time (seconds) |
<span>timeout_seconds</span> |
int | ❌ | 30 | Request timeout (seconds) |
<span>skip_verify</span> |
bool | ❌ | false | Whether to skip HTTPS certificate verification |
<span>labels</span> |
map | ❌ | {} | Custom labels, supporting fields: <span>env</span> (environment), <span>service</span> (service name), <span>type</span> (type) |
Configuration Examples
1. Simple GET Request Monitoring
# web/website.yaml
url:"https://example.com"
interval_seconds:60
timeout_seconds:5
labels:
service:"Official Website"
env:"Production"
type:"web"
2. API Monitoring with Authentication
# web/api-service.yaml
url:"https://api.example.com/health"
headers:
Authorization:"Bearer your-token-here"
User-Agent:"Services-Status-Exporter/1.0"
interval_seconds:30
timeout_seconds:10
labels:
service:"User API"
env:"Production"
type:"api"
3. POST Request Monitoring
# web/auth-api.yaml
url:"https://auth.example.com/login"
method:POST
headers:
Content-Type:"application/json"
X-API-Key:"your-api-key"
body:'{"username": "monitor", "password": "secret"}'
interval_seconds:120
timeout_seconds:15
labels:
service:"Authentication Service"
env:"Testing"
type:"api"
4. Monitoring with SSL Certificate Verification Skipped
# web/internal-service.yaml
url:"https://internal.example.com/health"
skip_verify:true
interval_seconds:30
timeout_seconds:10
labels:
service:"Internal Service"
env:"Development"
type:"internal"
Web Server Configuration (Optional)
If you need to enable TLS or basic authentication, you can create a <span>web-config.yml</span> file:
# TLS Configuration
tls_server_config:
  cert_file: server.crt
  key_file: server.key

# Basic Authentication Configuration
basic_auth_users:
  admin: $2y$12$JlRtb8Gb/W0I0cp6VCdztuEOIvbKAJ6C6jXIt1h.PTaUoNrHiIBa2  # Password: admin
Then start using the <span>-web-config</span> parameter:
./services-status-exporter -web.config.file=web-config.yml
🔧 Usage Instructions
1. Start the Service
# Basic start
./services-status-exporter

# Custom port and configuration directory
./services-status-exporter -addr=:19115 -web-dir=./web

# Enable TLS and authentication
./services-status-exporter -web.config.file=web-config.yml
2. Access Metrics
After starting, you can access the following endpoint:
- Metrics Endpoint:
<span>http://localhost:9112/metrics</span>– Prometheus metrics
❝
Note: The default listening port is
<span>9112</span>, which can be customized using the<span>-addr</span>parameter❞
3. Metric Examples
# Response time (seconds)
site_request_duration_seconds{site="https://example.com",method="GET",env="Production",service="Example Service",type="web"} 0.245

# HTTP response status code
site_status_code{site="https://example.com",method="GET",env="Production",service="Example Service",type="web"} 200

# Total request counter
site_request_total{site="https://example.com",method="GET",status="success",env="Production",service="Example Service",type="web"} 48
site_request_total{site="https://example.com",method="GET",status="error",env="Production",service="Example Service",type="web"} 2

# Site availability status
site_up{site="https://example.com",method="GET",env="Production",service="Example Service",type="web"} 1

# Application information and running status
services_status_exporter_info{version="1.0.0",build_time="2024-01-15T10:30:00Z"} 1
services_status_exporter_up 1
🐳 Deployment Guide
❝
Recommended to deploy using Docker Compose, simple and quick, no additional configuration for Prometheus required
❞
Docker Compose Deployment (Recommended)
# Clone the project
git clone <repository-url>
cd services-status-exporter

# Run
docker-compose up -d
Docker Deployment
1. Build the Image
# Clone the project
git clone <repository-url>
cd services-status-exporter

# Build the Docker image
docker build -t services-status-exporter .
2. Run the Container
# Basic run
docker run -d \
  --name status-exporter \
  -p 9112:9112 \
  -v $(pwd)/web:/app/web \
  services-status-exporter
📊 Prometheus Integration
Prometheus Configuration
Add the following configuration to <span>prometheus.yml</span>:
Basic Configuration
global:
  scrape_interval:15s

scrape_configs:
  -job_name:'services-status-exporter'
    static_configs:
      -targets:['localhost:9112']
    scrape_interval:30s
    metrics_path:/metrics
SSL Configuration Only (Skip Certificate Verification)
global:
  scrape_interval:15s

scrape_configs:
  -job_name:'services-status-exporter-ssl'
    static_configs:
      -targets:['your-domain.com:9112']
    scrape_interval:30s
    metrics_path:/metrics
    scheme:https
    tls_config:
      insecure_skip_verify:true
Basic Auth Configuration Only
global:
  scrape_interval:15s

scrape_configs:
  -job_name:'services-status-exporter-auth'
    static_configs:
      -targets:['localhost:9112']
    scrape_interval:30s
    metrics_path:/metrics
    basic_auth:
      username:'admin'
      password:'your-password'
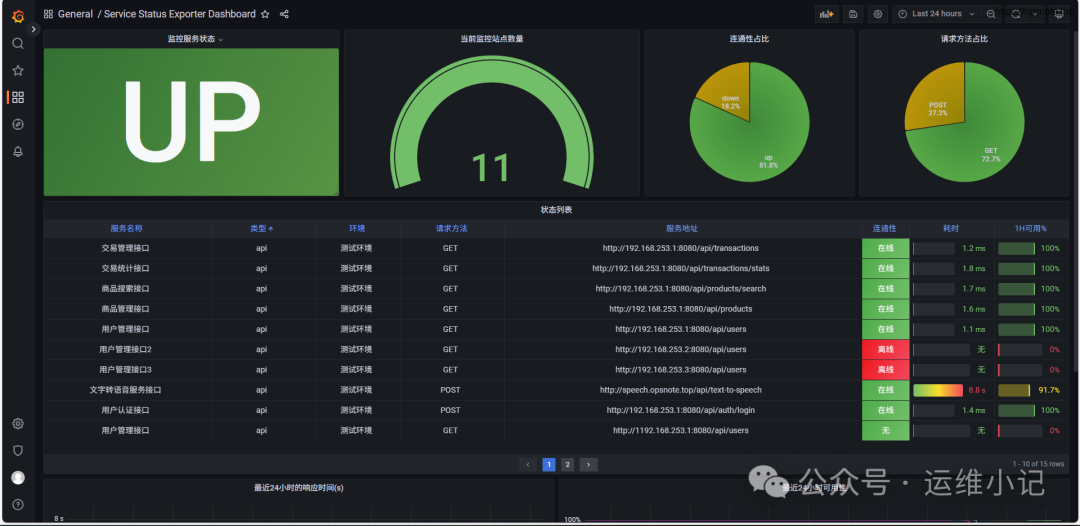
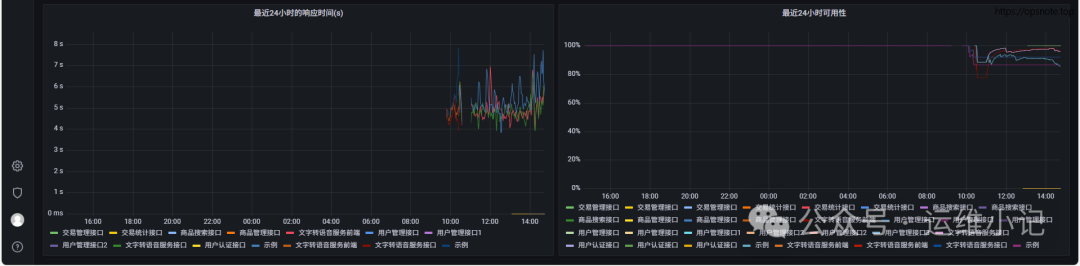
Grafana Dashboard
Template file: dashboard/dashboard.json
Import the template file to use
🔍 Troubleshooting
Common Issues
1. Configuration File Not Loaded
Problem: Configuration file is in the web directory but not effectiveSolution::
- Check if the file extension is
<span>.yaml</span>or<span>.yml</span> - Ensure the YAML format is correct, you can use an online YAML validator
- Check the startup logs to confirm the configuration loading status
2. Request Timeout
Problem: The monitored service is slow to respond or times outSolution::
- Increase the
<span>timeout_seconds</span>configuration value - Check network connectivity and the status of the target service
- Appropriately increase the
<span>interval_seconds</span>to reduce request frequency
3. Authentication Failure
Problem: API requiring authentication returns 401/403Solution::
- Check if the authentication information in
<span>headers</span>is correct - Ensure the API key or token is valid
- Verify that the request header format meets API requirements
4. High Memory Usage
Problem: Memory usage increases after long-term operationSolution::
- Reduce the number of monitored sites or increase the monitoring interval
- Check for configuration errors that may cause infinite retries
- Consider restarting the service to free up memory
Log Debugging
Enable detailed logging:
# Set log level
export LOG_LEVEL=debug
./services-status-exporter
View real-time logs:
# Docker container logs
docker logs -f services-status-exporter

# Docker Compose logs
docker-compose logs -f services-status-exporter
📄 License
This project is licensed under the Apache License 2.0. For more details, please refer to the LICENSE file.
Copyright 2024

Licensed under the Apache License, Version 2.0 (the "License");
you may not use this file except in compliance with the License.
You may obtain a copy of the License at

    http://www.apache.org/licenses/LICENSE-2.0

Unless required by applicable law or agreed to in writing, software
distributed under the License is distributed on an "AS IS" BASIS,
WITHOUT WARRANTIES OR CONDITIONS OF ANY KIND, either express or implied.
See the License for the specific language governing permissions and
limitations under the License.