HomeExperiments | Is Your Living Environment Quiet?
HomeExperiments | Drawing 24 Hours Of Light
HomeExperiments | The Rate Of Cooling Of Water
MakerTechnology And Science Class | Double Scale Experiment
MakerTechnology And Science Class | Conductors And Insulators(1)
MakerTechnology And Science Class | Conductors And Insulators(2)
MakerTechnology And Science Class | Conductors And Insulators(3)
MakerTechnology Assisting Science Experiments | Heat Transfer
MakerTechnology Assisting Science Experiments | Daily Temperature Changes
MakerTechnology Assisting Science Experiments | Alcohol Before And After
MakerTechnology Assisting Science Experiments | Invisible Ultraviolet
Maker Technology Assisting Science Experiments | Electromagnetic Iron

Introduction
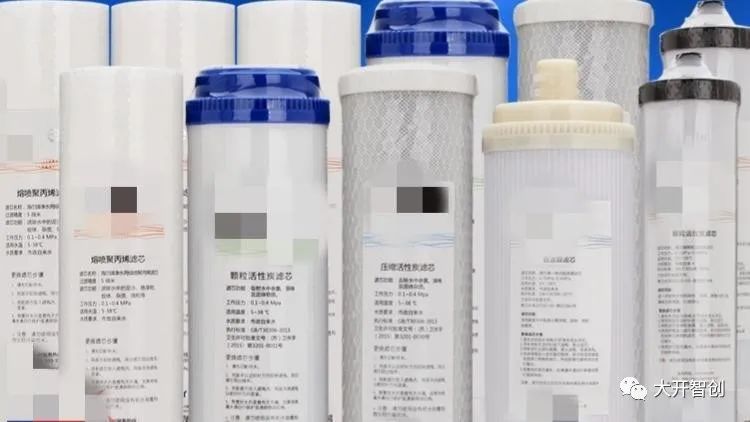
Figure 1
A few years ago, I installed a water purifier at home, which came with a filter that was supposed to last for two years. Whenever the reminder on the purifier went off, I would replace the filter with the specified model. Eventually, the filter ran out, and the reminder’s battery died, so I forgot about it over time. It wasn’t until this summer, when I had some free time, that I remembered I hadn’t changed the filter in a long time. It had already exceeded two years, so I replaced the entire set of filters.
I thought to myself, after spending several hundred yuan on a new filter set, can it really purify the water? So, I decided to test the purification effect. Fortunately, I had a simulated TDS sensor on hand, so I thought I would measure the TDS first. After using maker equipment to create a TDS detection device, I not only measured the TDS values of tap water before and after purification but also conducted some experiments related to TDS.
Demo Video

Knowledge Link
01
What is TDS?
“TDS” stands for “Total Dissolved Solids”. It refers to the concentration of dissolved solids in water, measured in milligrams per liter (mg/L), indicating how many milligrams of dissolved solids are present in one liter of water. A higher TDS value means more dissolved substances in the water, but these substances may include beneficial minerals for the human body, so TDS alone cannot determine water quality. However, a very high TDS value indicates poor water quality. The Chinese standard for drinking water (GB5749-2006) stipulates that TDS should not exceed 1000 mg/L. Figure 2 provides a comparison of various waters and their TDS values.

Figure 2
Generally, the TDS value of tap water decreases after passing through a water purifier, and this experiment aims to verify the purification effect of the water purifier I use at home.
02
About TDS Sensors

Figure 3
The TDS sensor used in this experiment (see Figure 3) is produced by DFRobot, suitable for Arduino and Micro:bit main control boards, and is very convenient to use with the graphical programming software Mind+, making it suitable for middle and primary school students. It supports a wide voltage range of 3.3-5.5V, with a measurement range of 0-1000ppm.
Note: ppm is a unit of concentration that indicates how many milliliters of solute are present in one million milliliters of solution or how many grams of solute are present in one million grams of solution. The conversion relationship is: 1ppm=1mg/L.
When using, the probe should not be used in water above 55°C, and it should not be too close to the edge of the container to avoid affecting the detection results. Since this is an entry-level product, this TDS sensor does not come with a temperature compensation function, so to achieve higher accuracy, a separate temperature sensor must be used along with a program that includes temperature compensation algorithms for automatic temperature compensation. However, this undoubtedly increases the difficulty of use, especially for those accustomed to using graphical programming software.
Is there any other simple way? I noticed that the precision of this sensor is calibrated at a water temperature of 25°C. Therefore, when using it, we just need to maintain the temperature of the water being tested at 25°C during the test.
Experimental Plan
First, use an Arduino Uno as the main control board, connect the TDS sensor, DS18B20 temperature sensor, and LED display to create a TDS detection device. To make the experiment more convenient, I added a robotic arm driven by three 180° servos to hold the two probes while also using a voice recognition module and a voice synthesis module to execute commands and report results. This can be considered a highly intelligent TDS detection device.
Then, using this detection device, a series of comparative experiments will be conducted to obtain the TDS values of water at different temperatures, the TDS values of tap water before and after purification, the TDS values of boiled and unboiled water, and the TDS values of commercially bottled water, etc.
Maker Equipment List

Figure 4
(1) Arduino Uno 1 piece
(2) IO Expansion Board 1 piece
(3) Analog TDS Sensor 1 piece
(4) DS18B20 Temperature Sensor 1 piece
(5) OLED Display 1 piece
(6) 180° Servo 3 pieces
(7) Voice Recognition Module 1 piece
(8) Voice Synthesis Module 1 piece
Experimental Process
01
Making the TDS Detection Device
NO.1
Hardware Setup

Figure 5
Insert the expansion board into the main control board, then connect various electronic modules to the pins on the expansion board. As shown in Figure 5, the voice synthesis module is connected to pins 0 and 1, the three servos are connected to pins 4, 6, and 8, the DS18B20 temperature sensor is connected to pin A0, the TDS sensor is connected to pin A2, and the OLED display and voice recognition module are connected to two IIC pins. Figure 6 shows the connected hardware diagram.

Figure 6
NO.2
Writing the Program

Figure 7
Using Mind+ software for programming, the complete program is shown in Figure 7. The functions to be achieved are: (1) when the command “start detection” is heard, the robotic arm operates to move the two probes to the designated position; when the command “detection complete” is heard, the robotic arm operates to move the two probes back to the initial position; (2) constantly detect the temperature and TDS value of the water and display the results on the screen; (3) when the temperature is above or below 25°C, a voice reminder to cool down or heat up is given; when the temperature is exactly 25°C, the detected TDS value is announced.
NO.3
Design Structure

Figure 8
Using LaserMaker software for modeling, the structure diagram of the robotic arm section has been modified using open-source drawings.

Figure 9
Using a laser cutter to process a linden wood board (3mm), the cut parts are shown in Figure 9.
NO.4
Assembly and Debugging

Figure 10
Assemble the base box and secure the electronic materials in the preset positions (see Figure 10).

Figure 11
Assemble the robotic arm (see Figure 11).

Figure 12
Install the robotic arm on the top panel of the base box (see Figure 12).

Figure 13
Connect the data cables and close the top panel (see Figure 13).

Figure 14
Secure the TDS sensor and temperature sensor probes at the end of the robotic arm (see Figure 14).

Figure 15
Power on for testing (see Figure 15) to check if there are changes in data before and after the probe is placed in water.
02
Conducting Experiments
Experiment 1
The Effect of Temperature on TDS Value
As mentioned earlier, TDS detection generally requires temperature compensation, indicating that water temperature affects TDS detection results. Therefore, the first step is to verify this.
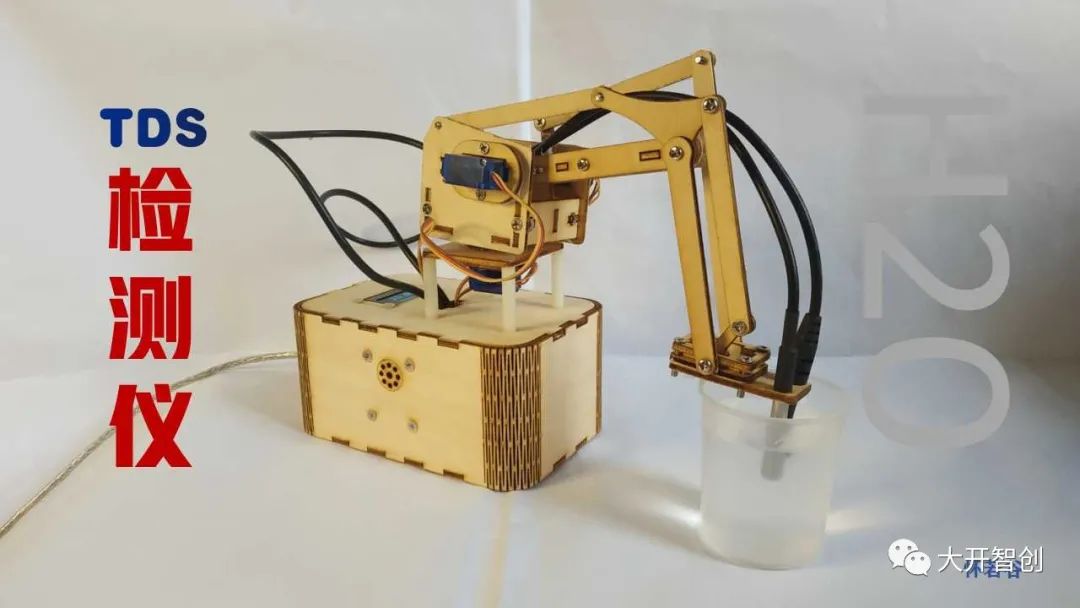
Figure 16
Prepare three cups of the same tap water (as shown in Figure 16), place one cup along with the cup into a sink filled with warm water for a while, place one cup in the refrigerator for a while, and keep one cup at room temperature. Then measure the temperature and TDS values of the three cups of water and record them.

Figure 17
The detection results are shown in Figure 17. From this result, it can be seen that for the same water, different temperatures yield different TDS data; the higher the temperature, the higher the TDS.
Thus, controlling the temperature of the tested water at 25°C in subsequent experiments is essential.
Experiment 2
Changes in TDS Values Before and After Water Purification

Figure 18
Prepare two cups of tap water, one cup of which is directly drawn tap water, and the other cup is purified tap water. Then measure the temperature and TDS values of the two cups of water. If the water temperature is not 25°C, use voice prompts to heat (place in a warm water sink) or cool (place in an ice water sink) as shown in Figure 19. When the temperature is 25°C, the detected TDS value is valid data, which should be recorded. (Note: The local seasonal natural temperature of tap water is around 20°C, which was heated for this experiment, and the same applies to subsequent experiments.)

Figure 19

Figure 20
The detection results are shown in Figure 20. From this result, it can be seen that the TDS value of my home tap water is relatively ideal, and after purification, although the value does not decrease significantly, it still shows that the water purifier has a certain effect.
Experiment 3
Comparison of TDS Values of Tap Water and Boiled Water
Prepare two cups of water, one cup of tap water and the other cup of boiled water that has cooled down. Measure the TDS values of the two cups of water at a temperature of 25°C and record the data.

Figure 21
The detection results are shown in Figure 21. From this result, it can be seen that the TDS of tap water did not change after boiling. However, this experiment is based on tap water with a TDS value of 30.74ppm, and whether the results are the same for different water qualities needs further verification.
Experiment 4
Comparison of TDS Values of Commercial Bottled Water

Figure 22
Prepare several types of bottled water, pour them into measuring cups (as shown in Figure 22), and conduct tests. Record the TDS values when the water temperature is 25°C.

Figure 23
The detection results are shown in Figure 23. From this result, it can be seen that mineral water has the highest TDS value, while purified water has the lowest TDS value. This result corresponds with the composition and production processes of these waters.
Expansion Suggestions
If we want to further utilize maker technology to assist in studying water quality issues, we can also use pH sensors, water turbidity sensors, and other electronic modules combined with the main control board to create detection devices for more experiments. We can also use relays, small pumps, and other equipment to create water sampling tools, go outdoors, and test the water quality of various natural waters.