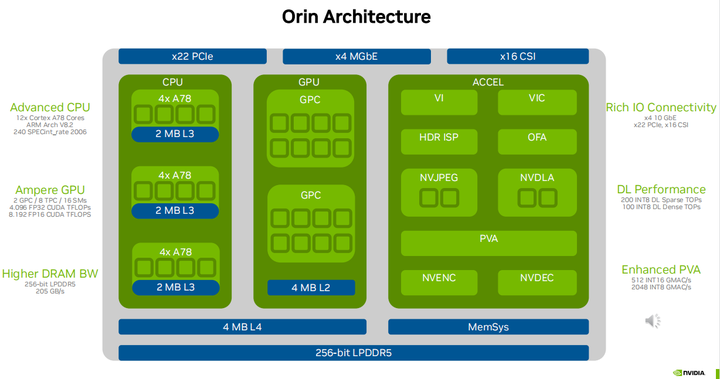
Orin architecture powers the next generation of edge AI systems with industry-leading performance, featuring 12 ARM Cortex A78 cores and 2MB of L3 cache, NVIDIA Ampere architecture GPU with 16 streaming multiprocessors, or 128 CUDA cores per SM. Orin also includes dedicated accelerators for workloads such as video scaling, image processing, Optical Flow Accelerator (OFA), 2 JPEG decoders, 2 Deep Learning Accelerator units supporting Tensor RT, programmable video accelerators (PVA), and video codec engines. Orin utilizes high-bandwidth LPDDR5 memory and offers a rich set of I/O connectivity options, including 22 PCI Express lanes, 4 Gigabit Ethernet connectors, and 16 CSI lanes. With all these powerful features, Jetson Orin is fully capable of tackling edge AI scenarios.
Now let’s discuss how to leverage the NVIDIA Nsight development tools to fully utilize this platform. Before we dive into the details of the development tools, I want to quickly overview the new features.
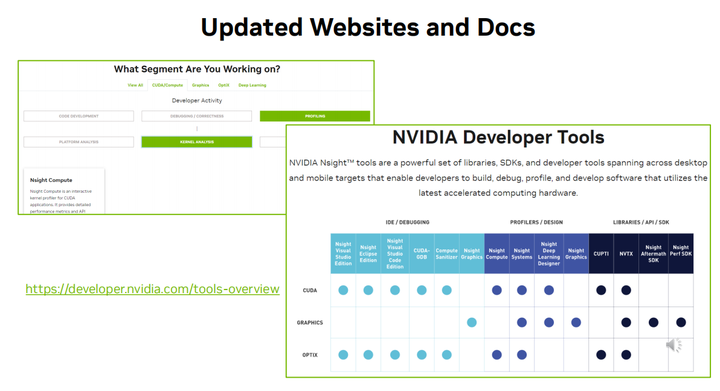
NVIDIA now has a completely revamped developer tools login page at http://nvidia.com. You can now visit this site for a comprehensive overview of all tools and their features to find the right tool for your work. You can also use a convenient guided interface to help narrow down specific tools for the problems you are working on.
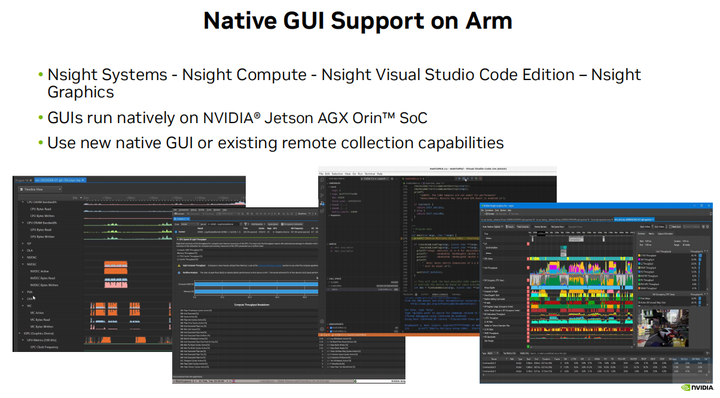
We now also support running the tool GUI locally on ARM. In addition to existing remote profiling and command-line interfaces, Nsight Systems, Nsight Compute, and Nsight Visual Studio Code versions can now run locally on the NVIDIA Jetson AGX Orin SOC.
Now let’s delve into a typical development workflow and the overall situation of NVIDIA Nsight tools related to these steps.
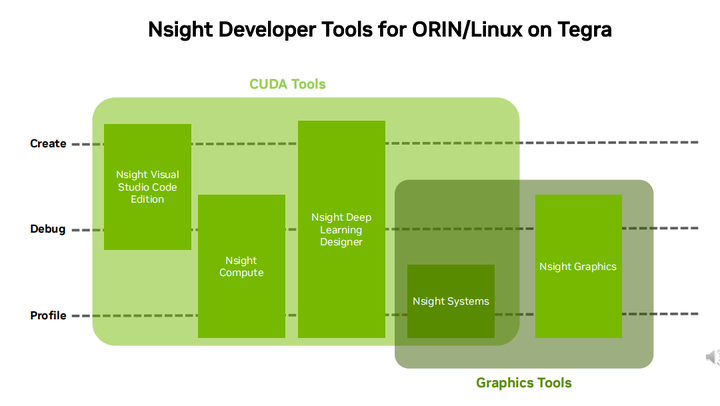
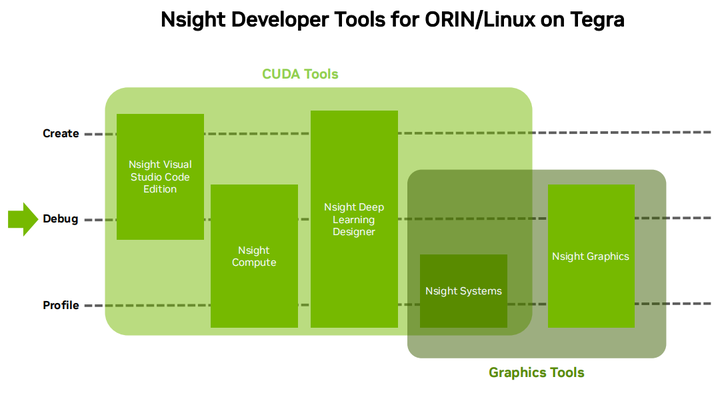
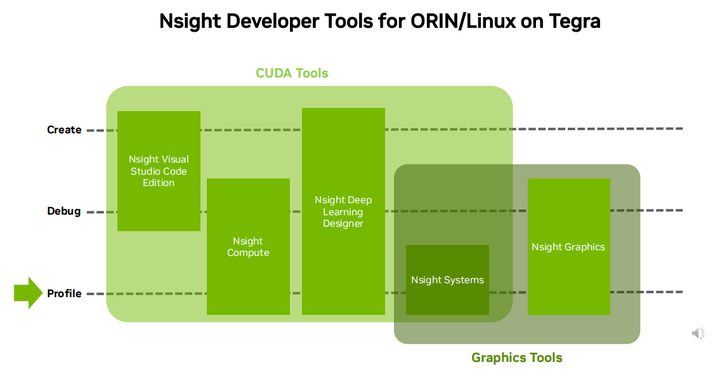
The development of an application goes through several stages:
Starting from creation, creating the application in an IDE or development environment,
then debugging to ensure its correctness and prove its functionality.
Finally, there is performance tuning or analysis, where the application or algorithm is adjusted to maximize platform utilization and optimize performance.
The NVIDIA Nsight tool suite can assist in completing each step while also providing solutions for workflows focused on compute or graphics workloads. Developing applications for Jetson has never been easier.
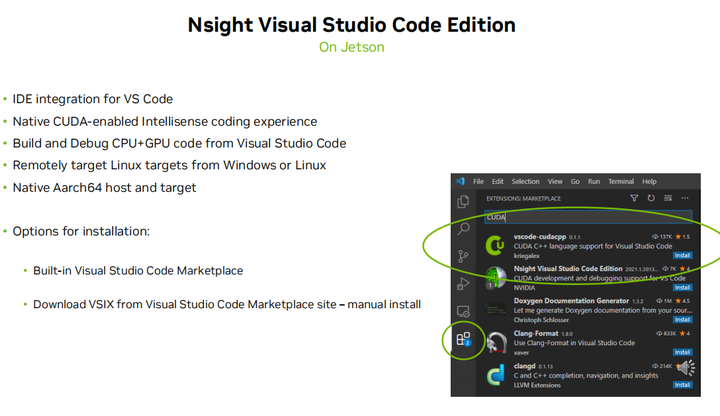
The Nsight Visual Studio Code version provides full IDE integration for VSC code and native IntelliSense support for CUDA. You can now build and debug CPU and GPU code directly in Visual Studio Code on Jetson or remotely from a Windows or Linux host. The Nsight Visual Studio Code version can be installed from the built-in Visual Studio Code marketplace or manually downloaded from the website.
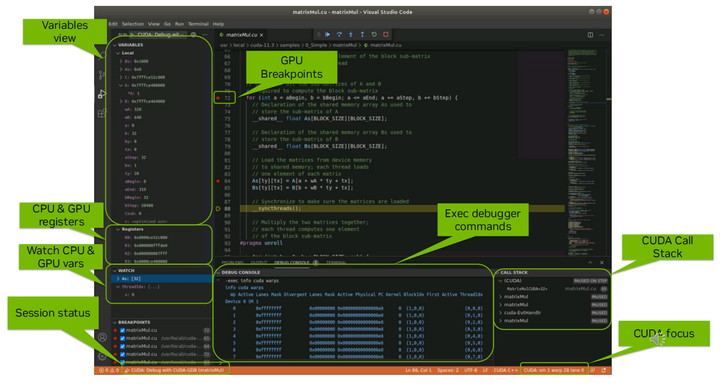
Once enabled, the Nsight Visual Studio Code version becomes a one-stop tool for CUDA programming and debugging. It allows you to set GPU breakpoints and device code. Use CUDA focus to view SM warp or Lane status. Find CUDA call stacks and check variables for interesting events. Monitor coverage and other states along with CPU and GPU register tracking. For advanced users, the debugging console is a convenient interface to execute debugger commands directly.
We just discussed the debugging features available in the Nsight Visual Studio Code version. But it doesn’t stop there. There is more.
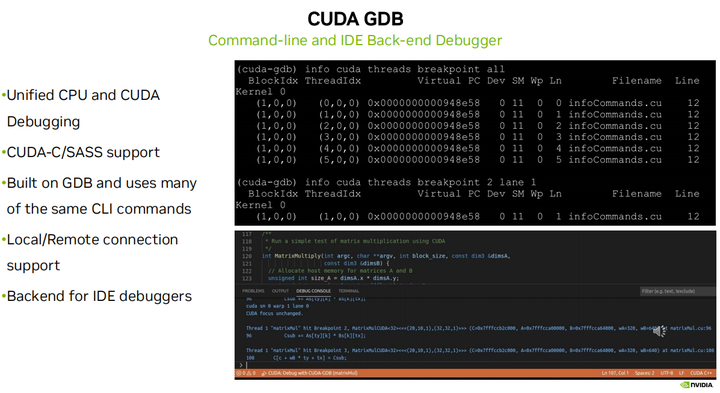
With CUDA gdb, you get a command-line and IDE backend debugger built on gdb and using many of the same CLI commands. CUDA gdb provides unified CPU and CUDA debugging, as well as CUDA C and SASS support.

Compute Sanitizer is a suite of tools used to check correctness and identify memory issues and errors. It consists of memcheck to identify memory leaks. Racecheck finds race conditions, Initcheck looks for uninitialized global memory accesses, and Synccheck flags thread synchronization issues.
Once an application passes the debugging stage, it is validated to run correctly and as designed. It now enters the analysis phase, where it will be optimized to run in the most efficient form while fully utilizing its runtime platform.
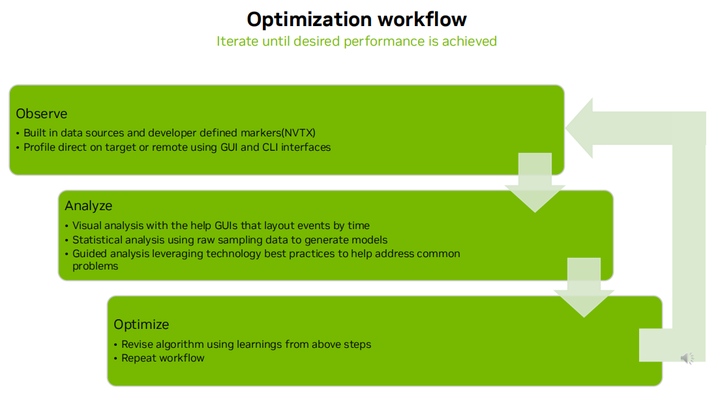
The art of optimizing performance is an iterative process. It typically involves three steps:
First, analyze or observe the running application, then analyze the analysis results. Once the analysis at hand is done, you now have hints for tuning and optimizing that you can apply to the algorithms or applications to improve and address design bottlenecks and errors discovered after making these changes. You repeat the process and run the profile again to see if the changes made have the expected effects and results.
Using NVIDIA Nsight tools for analysis is seamless and powerful. These tools provide a wide range of analysis options, such as using this GUI or CLI to analyze on-device or from a remote host. It also allows for in-depth insights into how the system works with the help of system built-in data sources. Using NVTX and developer-defined NVTX markers for the applications being developed. Once the trace is collected, it can be visualized on a GUI that arranges events in chronological order and highlights dependencies. A visual representation of application behavior is a very useful tool to highlight design considerations and algorithm behaviors that may have been misunderstood previously. Additionally, data profiling can be leveraged to create statistical models to help identify patterns and anomalies.
The Nsight tools also come with built-in analysis tools to help analyze traces and identify common issues and violations that can be resolved to enhance application performance. Leveraging lessons learned from the recently completed analysis, now modify the application to address identified issues and make necessary optimizations. Then, after a quick sanity check to rule out any functional errors, we return to the first step and analyze the application again, and repeat the process to ensure that the changes made yield the expected improvements. This iterative process is often driven by performance goals set for the application or scenario.
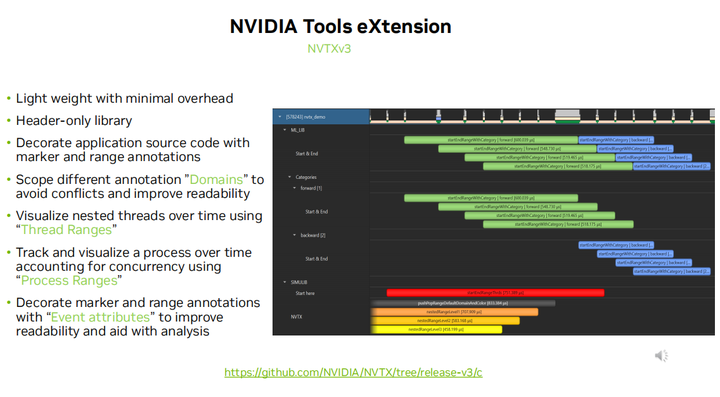
In the previous section, we discussed the analysis workflow and how analysis markers help us highlight and track application behavior. NVTX or NVIDIA Tools Extension Library is a lightweight header annotation library with minimal overhead. NVTX can be used to decorate application source code using markers and range annotations. It includes several features to further assist in analysis. NVTX annotations can be scoped within domains to avoid conflicts and enhance readability within traces. Nested threads can visualize over time using thread ranges. Process ranges can be used to track and visualize processes over time while considering arbitrary concurrency. Using event properties to decorate markers and range annotations provides additional information properties for events, such as color and/or category to guide tools visualization of data, thereby helping to improve readability and assist analysis.
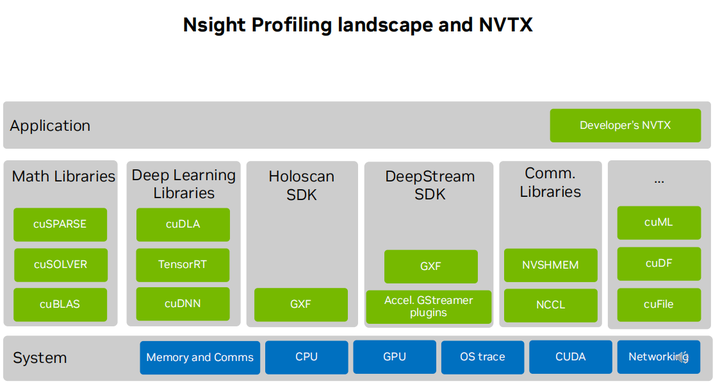
Using Nsight tools to run profile traces can leverage a wealth of built-in data sources that are ready to use. In addition to being able to observe CPU, GPU, memory, communication, network, CUDA, and OS activities on the system, SDKs and accelerated libraries like TensorRT, cuDLA, cuDNN, etc., are fully decorated with NVTX annotations, allowing them to show up in traces, freeing developers to only annotate the applications they are working on.
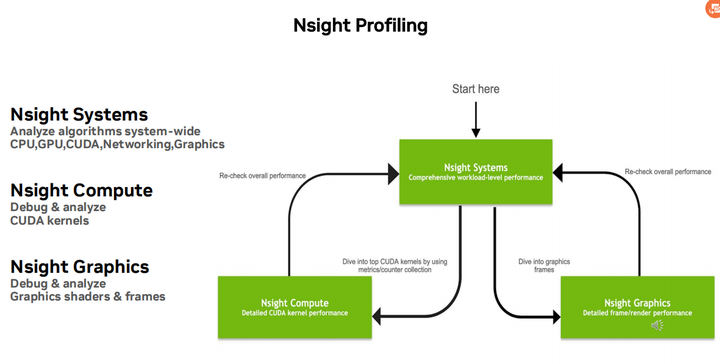
The Nsight analysis tool series can be used to support analysis scenarios for compute and graphics applications. Developers working on compute-centric applications combine Nsight Systems and Nsight Compute, while developers working on graphics ultimately use Nsight Systems and Nsight Graphics.
They typically start with Nsight Systems, which helps present a comprehensive system-wide view that aids in analysis and identifying bottlenecks and cold spots. If they are working on compute applications, they will use Nsight Compute for in-depth investigation to further investigate and resolve CUDA kernel performance issues.
Similarly, for graphics applications, they use Nsight Graphics to optimize shader and frame rendering performance issues. After validating fixes in Nsight Compute Graphics, they redo system-level profiling with Nsight Systems to ensure optimizations work as expected and, more importantly, rule out the possibility of regressions elsewhere. As we saw before, you flush and repeat the process.
A professional tip to consider when analyzing is not to skip collecting system-level views before continuing to investigate CUDA kernels or graphics shaders. When running Nsight Systems profiling, it is clear that it highlights memory bottlenecks, operating system and CPU scheduling issues, and PCI BAR1 subscription issues, to name a few. In some cases, these issues are severe enough to affect system performance by preventing the application from fully utilizing the available GPU accelerators on the system.
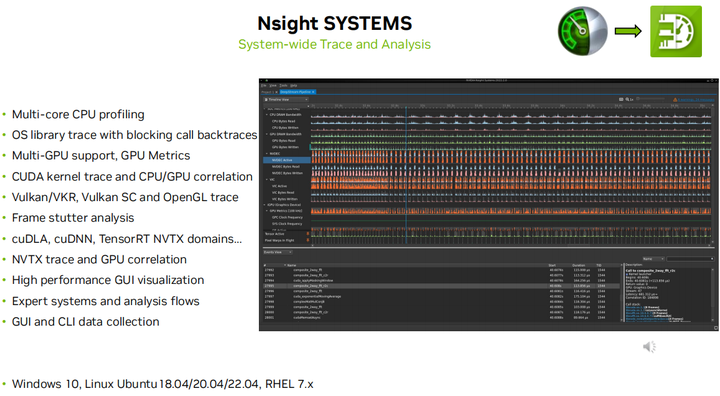
Now let’s delve deeper into the capabilities of Nsight Systems. Nsight Systems is a powerful system-wide analysis tool. It allows you to examine your CPU and GPU interactions to identify the maximum opportunities for optimizing and tuning your code. Using Nsight for analysis helps trace GPU workloads back to their CPU origins, providing deeper insights into GPU and accelerator unit utilization and the activities between the operating system and different APIs (such as Vulkan and CUDA).
Nsight supports device and remote analysis using either GUI or CLI and can support multi-GPU systems and out-of-the-box runtime profiling and accelerated cool libraries, all of which are NVTX out-of-the-box. By adding low overhead and NVTX to your application, you can gain deeper insights into your application in just a few steps. GPU metric sampling on Nsight helps provide visibility into low-level system metrics on a visual timeline. These provide an overview of system-wide workload efficiency. These include IO activity metrics such as throughput for PCIE, DRAM, etc. They also show some of the utilization metrics for Tensor Cores activity instructions, warp occupancy, and unallocated work slots. This information helps better understand system activity and assists in answering fundamental questions such as whether the GPU is active most of the time. Is the kernel grid large enough, and is the SM instruction rate high? Are Tensor Cores being utilized, etc.? An extensible analysis and expert system framework is also included, containing common optimization workflows that one might encounter.
All the tools we introduced today can run locally on Jetson.
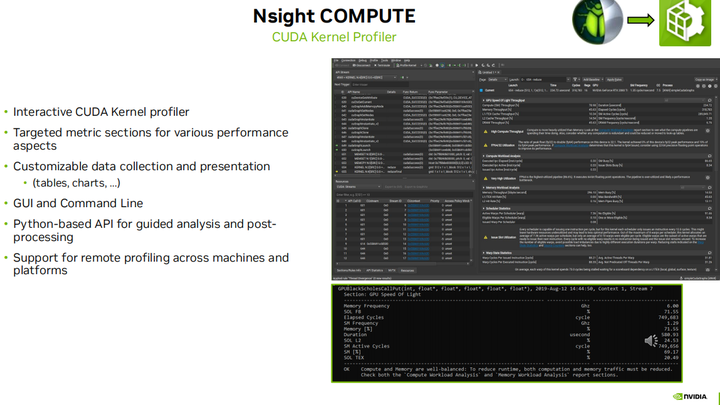
Nsight Compute is a kernel profiler for CUDA applications. It helps collect detailed low-level performance metrics and API information to assist in analyzing CUDA kernels running on the GPU. It allows you to interactively analyze CUDA kernels using either GUI or CLI while specifying specific instances of the selected kernel profiling. It is very powerful and can be used to track memory workloads to help fully utilize the GPU. It also includes an extensible Python-based guided analysis framework to help guide you through core optimizations.
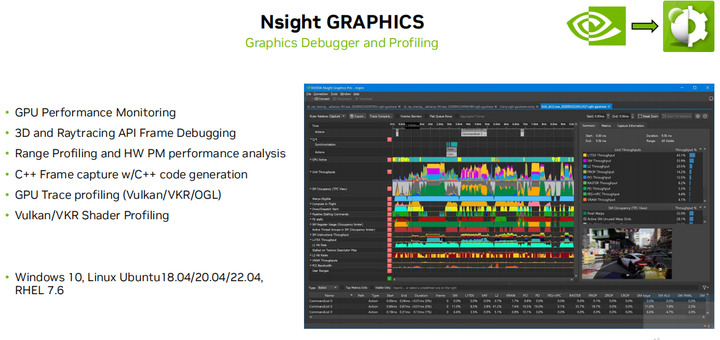
Nsight Compute is a GPU debugger and profiler. It can help you perform performance monitoring more economically, debug 3D and ray tracing APIs, and help optimize graphics application performance to eliminate stutters and stalls. GPU tracing providers support Vulkan and OpenGL on Jetson, allowing you to view low-level metrics during the process of one or multiple frames in graphics applications. These metrics can be used to identify areas of low GPU utilization within frames, helping drive optimization decisions. But it doesn’t stop there. Getting into steady state and starting free state may require deeper digging. Using range analyzers or shader analyzers, you can take a closer look at instruction scheduling and identify stalls that lead to low GPU utilization. Eliminating these stalls allows the GPU to execute multiple instructions simultaneously, increasing throughput and ensuring the fastest frame rates.
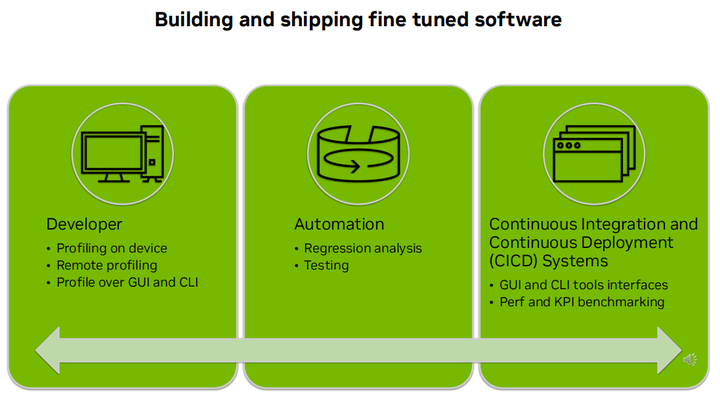
Building and delivering fine-tuned software can happen at many levels. At the micro level of the developer’s desk, developers use Pro Nsight analysis tools to analyze on-device or use remote host analysis targets. The available GUI and CLI interfaces allow developers to collect profiling data, which they can then visualize on the GUI to analyze and fine-tune their applications. Furthermore, they can run regression analysis and perform their test applications using the statistical output generated by the analyzer. Utilizing CI/CD, or Continuous Integration and Continuous Deployment systems in large systems and organizations, the profiler outputs can be used to monitor performance and benchmark applications against KPI targets.
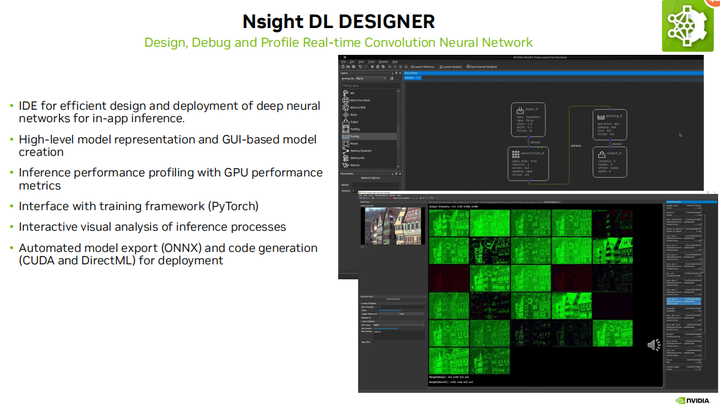
Now let’s talk about Nsight DL Designer, which is our tool for Convolutional Neural Networks or CNNs. It includes an IDE to help you create real-time inference CNNs, a GUI-based editor that provides a very intuitive model representation. It also includes an analyzer that utilizes GPU metrics to help identify layers that may be too costly, then helps drive optimizations such as reordering layers to help speed operations, and may even involve trade-offs, such as making decisions between quality or speed, possibly like trying to reduce the number of detected features. Like the other tools we discussed or talked about today, the Designer is also capable of running directly on Jetson and allows you to use PyTorch and export models for deployment.
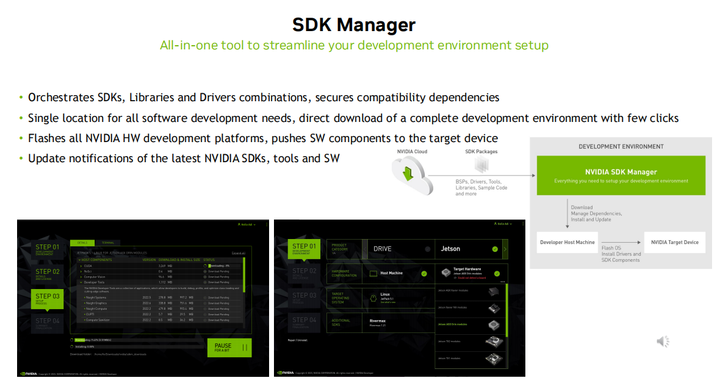
NVIDIA SDK Manager simplifies and automates the setup of development environments for our developers. It orchestrates SDKs, libraries, and driver combinations and ensures compatibility dependencies. It can flash all NVIDIA hardware dependencies and software onto the target Jetson device on the Jetson platform. It also keeps you informed about the latest NVIDIA SDK tool and software version notifications, so you are always working and running on the latest and greatest devices.
More
Native development using NSight tools on NVIDIA Jetson AGX Orin