Hello everyone, I am Jianyu.
In the previous article “A Demo to Learn Debugging with Go Delve”, we detailed how to use Delve in Go for troubleshooting and debugging, which was very helpful for problem resolution.
However, debugging tools are not limited to Delve. Today, we will introduce a second powerful tool: GDB, to complete our debugging tool stack.
Based on feedback from everyone, we will add chapters on IDE debugging later.
Stay tuned for the next piece from Jianyu:
What is GDB
GDB is a program debugging tool under UNIX-like systems, allowing you to see what is happening “inside” another program while it executes or what it was doing when it crashed.

It can mainly do four types of things:
-
Start your program, specifying anything that may affect its behavior. -
Make your program stop under specified conditions. -
Inspect what happened when your program stopped. -
Change things in your program so that you can experiment with correcting an error’s impact and continue to understand another error.
Installation
If you are on MacOS, you can install it directly using brew:
brew install gdb
If you are on Linux, you can use the built-in package management tool to install it, but be aware that you need to configure it in the HOME directory after installation.
After installation, executing gdb will show:
$ gdb
GNU gdb (GDB) 10.2
...
(gdb)
As of writing this, the latest version of gdb is 10.2, and I have upgraded to it. There are no major issues, and it has added many features.
Compilation
We will use the previous demo program for debugging. However, due to several compilation optimizations in Go, there are a few points to note when compiling and running the program:
-
The
go buildcompilation needs to add the-gcflags=all="-N -l"directive to disable inline optimization, which facilitates debugging. -
If you are on MacOS, you need to add the
-ldflags='-compressdwarf=false'directive when compiling withgo build. -
If not disabled, you will encounter the error No symbol table is loaded. Use the "file" command. -
Go compiles by default to reduce binary size, compressing DWARF debug information, but this affects gdb debugging, so it needs to be turned off.
The compilation command is:
$ go build -gcflags=all="-N -l" -ldflags='-compressdwarf=false' .
Output result:
!了鱼煎进子脑
Trying GDB
GDB has two debugging modes: Text User Interface (TUI) and the default command-line mode:
// Debugging interface
$ gdb -tui ./awesome-project

// Command line mode
$ gdb ./awesome-project
Next, we will demonstrate the features using the gdb tui debugging mode.
After executing the command gdb -tui ./awesome-project, the window will switch to the following:
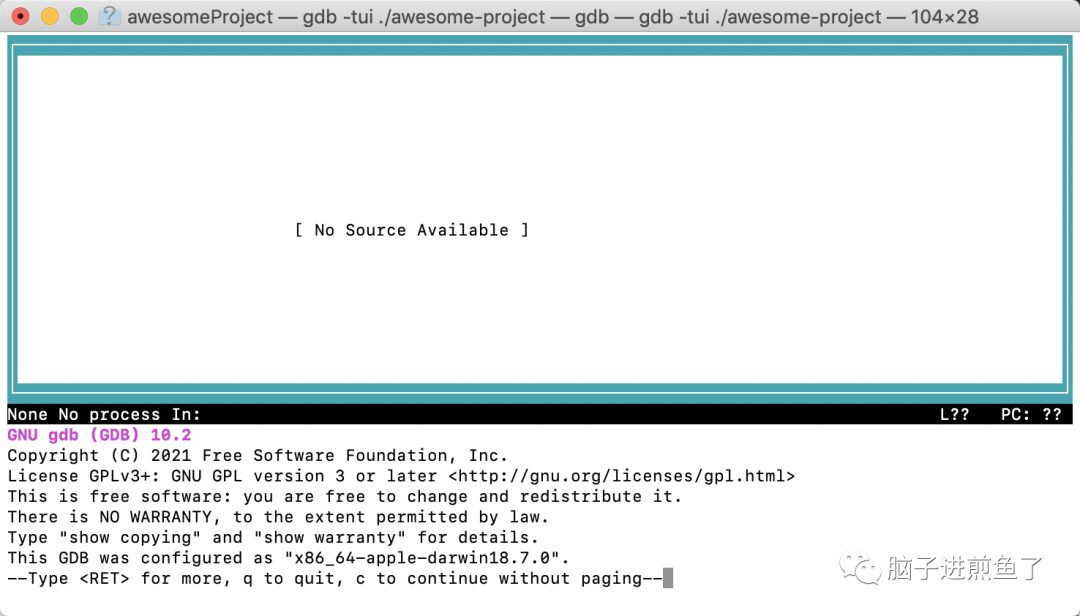
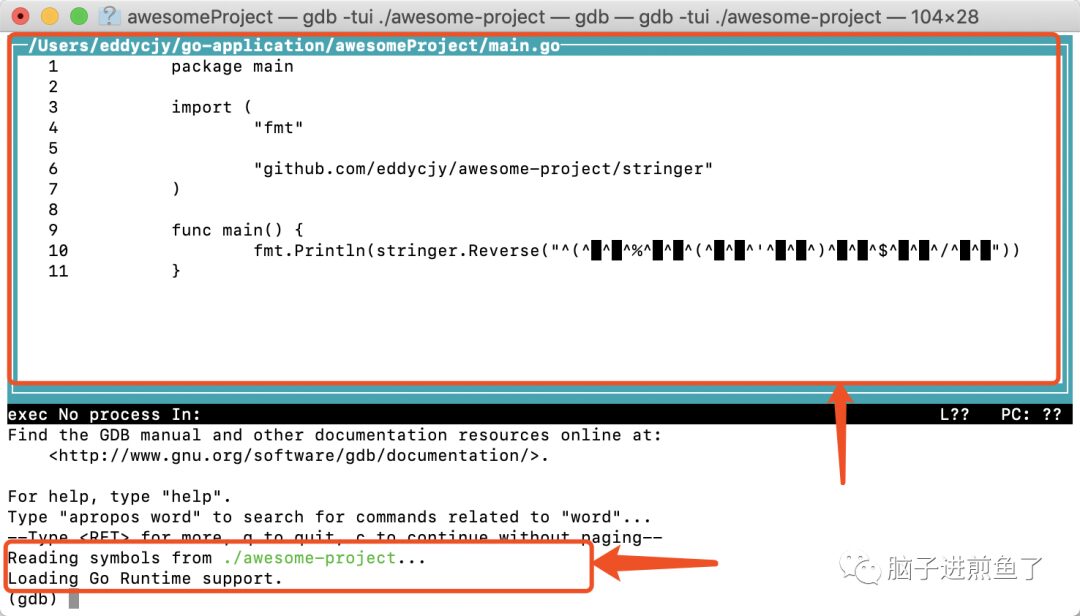
You will notice the prompt “No Source Available” in the middle; at this point, you need to press Enter twice, and it will automatically load plugin support, prompting: “Loading Go Runtime support.”
We can then see the specific code block content as follows:
MacOS users need to be cautious; if you find the following error at a breakpoint:
(gdb) b main.main
Breakpoint 1 at 0x10a2ea0: file /Users/eddycjy/go-application/awesomeProject/main.go, line 15.
(gdb) r
Starting program: /Users/eddycjy/go-application/awesomeProject/hello
Unable to find Mach task port for process-id 64212: (os/kern) failure (0x5).
 (please check gdb is codesigned - see taskgated(8))
which states “please check gdb is codesigned – see taskgated(8)”, you need to reprocess the certificate authentication and authorization, which is a problem with MacOS usage. For specifics, refer to: “Codesign gdb on OSX”.
After resolving this, our gdb should be able to run correctly!
Common GDB Commands
In gdb, there are commonly used keyword commands, similar to dlv. Of course, the help all output in gdb is extensive:
(gdb) help all

Command class: aliases
Command class: breakpoints

awatch -- Set a watchpoint for an expression.
break, brea, bre, br, b -- Set breakpoint at specified location.
break-range -- Set a breakpoint for an address range.
catch -- Set catchpoints to catch events.
...
Common keywords are as follows:
-
b: abbreviation for break, used to set a breakpoint, e.g., main.main, can include line numbers. -
r: abbreviation for run, used to run the program to the next breakpoint. -
c: abbreviation for continue, used to continue execution to the next breakpoint. -
s: abbreviation for step, used for single-step execution; if a method is called, it will enter that method. -
l: abbreviation for list, used to view the corresponding source code. -
n: abbreviation for next, used for single-step execution, will not enter the called method. -
q: abbreviation for quit, used to exit. -
info breakpoints: used to view all set breakpoint information. -
info locals: used to view variable information. -
info args: used to view the specific values of function parameters and return values. -
info goroutines: used to view goroutine information. -
goroutine 1 bt: used to view the call stack of the specified goroutine number.
Debugging
The debugging process is similar to dlv; first, execute the keyword b to set a breakpoint:
(gdb) b main.main
Breakpoint 1 at 0x10cbaa0: file /Users/eddycjy/go-application/awesomeProject/main.go, line 9.
You can also execute the keyword l to view the corresponding code before making a decision:
(gdb) l main.main
4  "fmt"
5
6  "github.com/eddycjy/awesome-project/stringer"
7 )
8
9 func main() {
10  fmt.Println(stringer.Reverse("脑子进煎鱼了!"))
11 }
To view the functions currently running in the goroutines:
(gdb) info goroutines
  1  waiting runtime.gosched
* 13  running runtime.goexit
Based on the goroutine number obtained from pprof, further analysis can be performed:
(gdb) goroutine 1 bt
#0  0x000000000040facb in runtime.gosched () at /home/user/go/src/runtime/proc.c:873
#1  0x00000000004031c9 in runtime.chanrecv (c=void, ep=void, selected=void, received=void)
 at  /home/user/go/src/runtime/chan.c:342
#2  0x0000000000403299 in runtime.chanrecv1 (t=void, c=void) at/home/user/go/src/runtime/chan.c:423
#3  0x000000000043075b in testing.RunTests (matchString...
Note a detail: gdb debugging allows you to set breakpoints and analyze the code content of the runtime package.
You can also execute the p keyword to output the corresponding value’s type and content:
(gdb) p re
(gdb) p t
$1 = (struct testing.T *) 0xf840688b60
(gdb) p t
$1 = (struct testing.T *) 0xf840688b60
(gdb) p *t
$2 = {errors = "", failed = false, ch = 0xf8406f5690}
(gdb) p *t->ch
$3 = struct hchan<*testing.T>
Similar to dlv.
Conclusion
Overall, using gdb on MacOS is quite troublesome; using gdb in a Linux environment is more convenient.
Since dlv and gdb do not differ much in general debugging, this article does not go into too much detail.
If you are analyzing business code, it is more advisable to use dlv, as discussed in our previous article. If there is a need for runtime library debugging, gdb is recommended as the primary debugging tool; if there is no such requirement, it is advised to use dlv.
Follow Jianyu for more knowledge 👆

Hello, I am Jianyu. I dabbled in frontend in my first year of high school, participated in national competitions, and won awards. In college, I worked with PHP. Now I am focusing on Go, responsible for the advancement and development of microservices architecture and related work in my company.
Since college, I have earned my living and tuition by myself, published the bestselling book “Journey of Go Programming”, and received the honor of GOP (Go’s Most Insightful Expert),click the blue text to see my publishing journey.
I regularly share high-quality articles, outputting Go interview and work experience, architecture design. Add me on WeChat to join the reader group, and remember to like!