This article is excerpted from the “ByteDance Infrastructure Practice” series. The “ByteDance Infrastructure Practice” series is a collection of technical content created by various technical teams and experts from ByteDance’s infrastructure department, sharing the team’s practical experiences and lessons learned during the development and evolution of infrastructure, and engaging in discussions with fellow technical colleagues.
Coredumps are often encountered in our daily development and can assist us in problem identification. However, if a coredump is truncated, it complicates the troubleshooting process. This article uses an online issue as a case study to delve into the troubleshooting approach for such problems, as well as how to utilize debugging tools and read kernel source code to better understand the coredump handling process. We hope to provide a clear framework for everyone when troubleshooting such issues.
Problem Background
In C/C++ program development, encountering a coredump can sometimes lead to a coredump truncation issue, which affects subsequent problem troubleshooting. Coredump truncation is mostly caused by core limits and remaining disk space. This is relatively easy to troubleshoot and resolve. Today, we will analyze a special case.
Using this case, we will gain a deeper understanding of the troubleshooting approach for these issues, using debugging tools and reading kernel source code to clarify the coredump handling process. This will provide a clear framework for troubleshooting such problems.
Colleagues from the business side reported that after the service in the container generated a core, gdb debugging returned an error. The service runs in a K8S + Docker environment and is ultimately managed by the system within the container. On some machines, the coredump file generated a warning when using gdb, which affected the troubleshooting process. The error message is as follows:
BFD: Warning: /tmp/coredump.1582242674.3907019.dp-b9870a84ea-867bccccdd-5hb7h is truncated: expected core file size >= 89036038144, found: 31395205120.This resulted in gdb being unable to continue debugging. After logging into the machine, we checked and found that it was not an issue with disk space or core ulimit. Further investigation was needed.
Terminology Conventions
GDB: A binary debugging tool for UNIX and UNIX-like systems.
Coredump: A core dump is a disk file that the operating system writes when a process terminates due to certain signals, containing the contents of the process’s address space at that time and other information about the process state. This information is often used for debugging.
ELF: Executable and Linkable Format, a standard file format for executable files, object files, shared libraries, and core dumps. It is the binary file format standard for Unix-like operating systems on the x86 architecture.
BFD: The Binary File Descriptor library is a key mechanism used by the GNU project to address the portability of different target file formats.
VMA: Virtual Memory Area, a segment of virtual address space in a user process that the kernel uses to track the memory mapping of the process.
Troubleshooting Process
User Space Investigation
Initially, we suspected there might be a problem with our self-developed coredump handler program, so we restored the system’s original coredump settings.
We manually triggered a coredump. The issue persisted. We ruled out the coredump handler as the problem, indicating that the issue might occur at the kernel level or with gdb.
We needed to determine whether it was a gdb issue or a kernel issue with the core dumping. We started by investigating gdb, downloading the source code to locate the error (the indentation of the source code has been adjusted for easier reading).
Currently, it does not seem to be a gdb issue. The coredump file was written incompletely. The writing of the coredump is handled by the kernel, so we need to investigate from the kernel side.
Before investigating, we observed that the program generating this coredump was using a very large amount of memory, on the scale of dozens of GB. We suspected it might be related to its size, so we conducted an experiment. We wrote a program that simulates using 50GB of memory and generated a coredump.
#include <unistd.h>#include <stdlib.h>#include <string.h>
int main(void){
    for(int i=0; i<1024; i++){
        void* test = malloc(1024*1024*50); // 50MB
        memset(test, 0, 1);
    }
    sleep(3600);
}
After testing, the core was generated normally. gdb worked properly, temporarily ruling out the issue of large core size.
So we initially judged that the problem was with the kernel’s handling of the core file itself. Further follow-up was necessary.
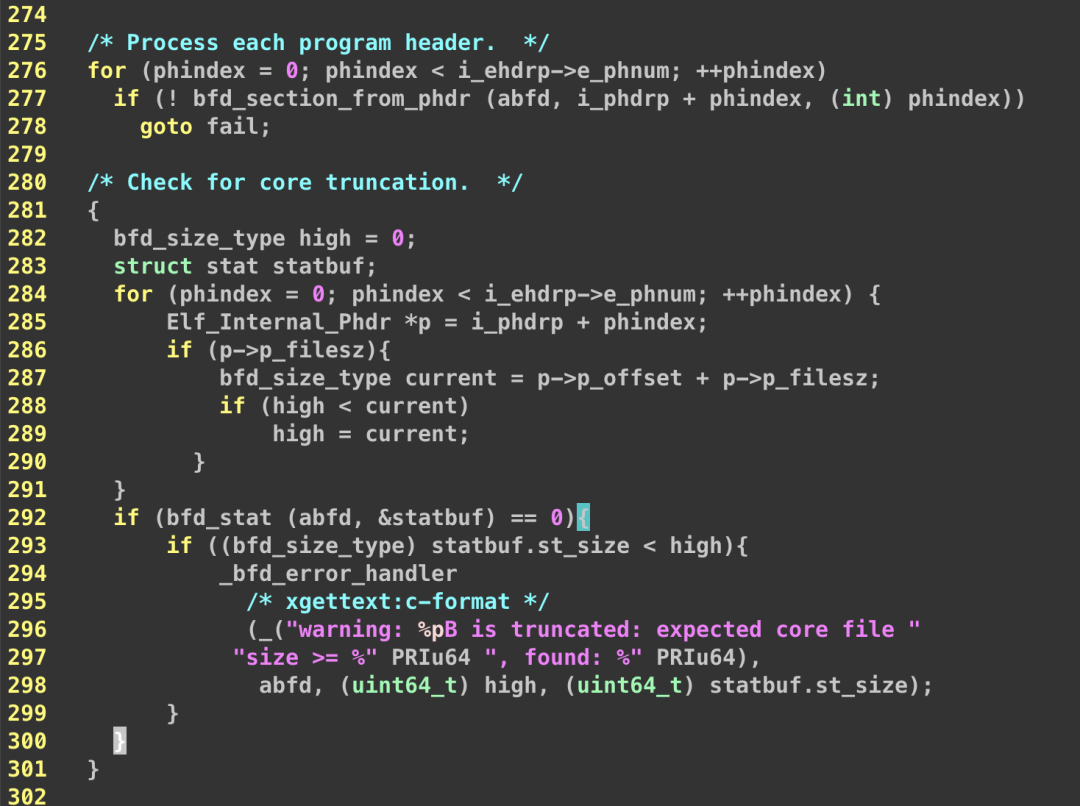
Upon reviewing the kernel code, we found a suspicious point:
/* * Ensures that file size is big enough to contain the current file * position. This prevents gdb from complaining about a truncated file * if the last "write" to the file was dump_skip. */
void dump_truncate(struct coredump_params *cprm){
    struct file *file = cprm->file;
    loff_t offset;
    if (file->f_op->llseek && file->f_op->llseek != no_llseek) {
        offset = file->f_op->llseek(file, 0, SEEK_CUR);
        if (i_size_read(file->f_mapping->host) < offset)
            do_truncate(file->f_path.dentry, offset, 0, file);
    }
}
The comment in this code caught our attention.
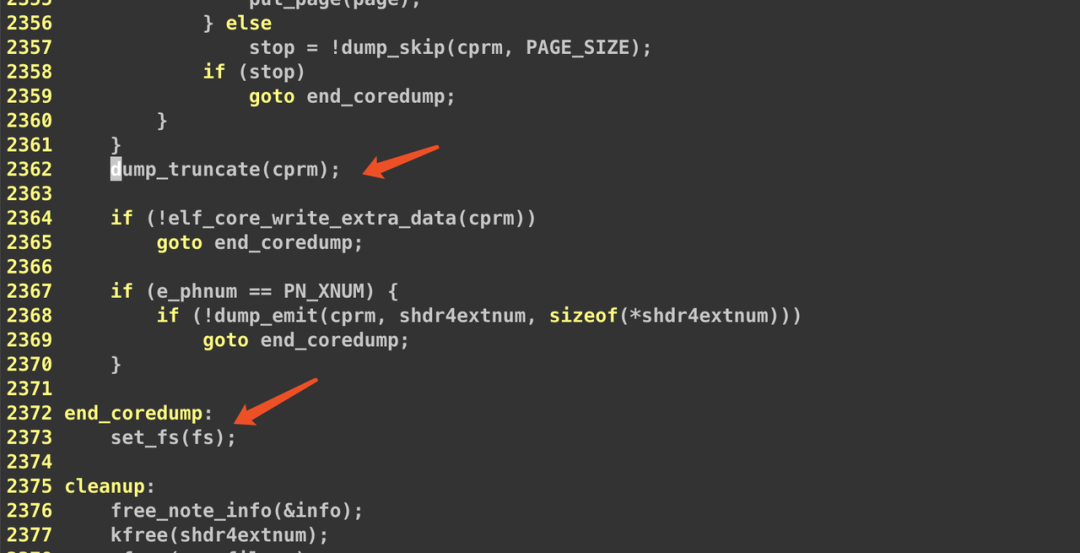
We now suspect that the dump_truncate function was not executed when this case occurred. We attempted to move dump_truncate to a second position. After recompiling the kernel and testing again, the issue still persisted. So we continued to examine the code.
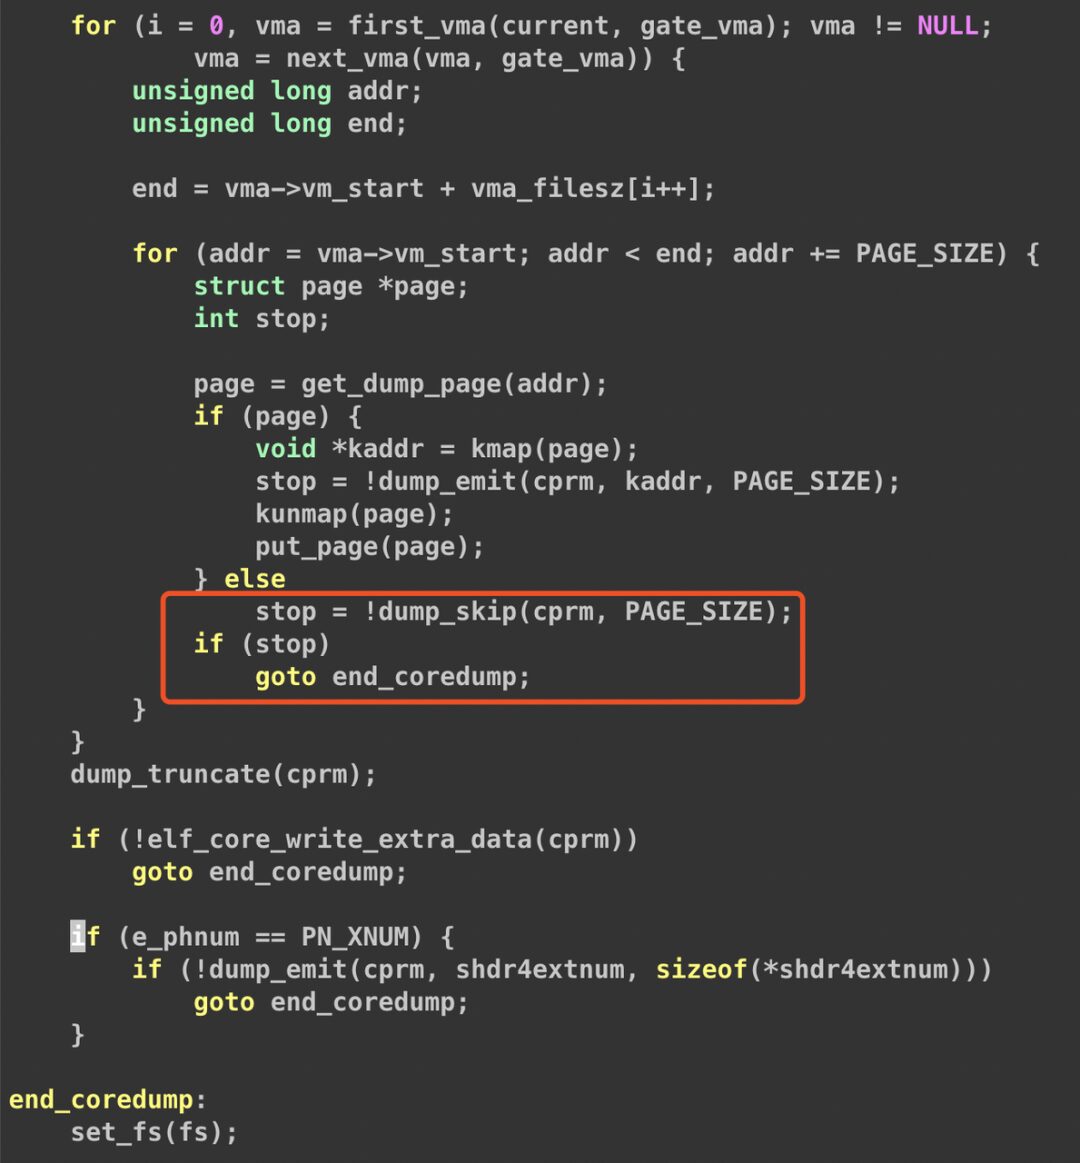
This segment of code drew attention. We suspect that at some point when executing get_dump_page, it returned NULL. This led to the dump_skip function being executed, causing dump_skip to return 0, which resulted in a goto to end_coredump. We used stap to capture this.
As expected, after dump_skip returned 0, the coredump stopped. This means that only part of the VMA was dumped in the second stage, leading to an incomplete coredump write.
Analysis of Partial VMA Dump
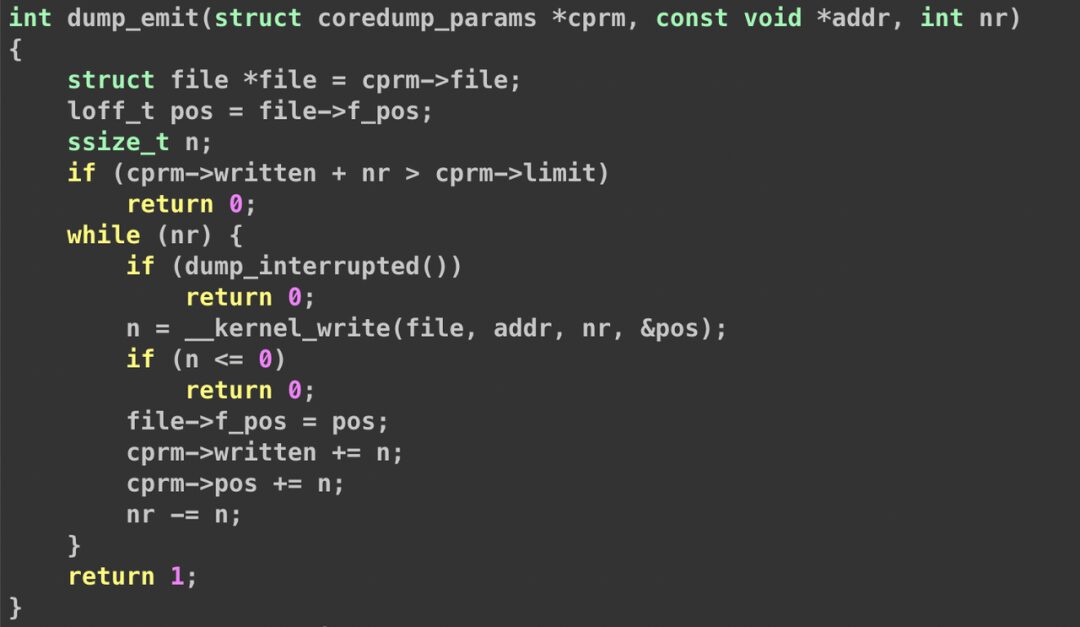
Next, let’s look at the dump_skip function.
int dump_skip(struct coredump_params *cprm, size_t nr){
    static char zeroes[PAGE_SIZE];
    struct file *file = cprm->file;
    if (file->f_op->llseek && file->f_op->llseek != no_llseek) {
        if (dump_interrupted() ||
            file->f_op->llseek(file, nr, SEEK_CUR) < 0)
            return 0;
        cprm->pos += nr;
        return 1;
    } else {
        while (nr > PAGE_SIZE) {
            if (!dump_emit(cprm, zeroes, PAGE_SIZE))
                return 0;
            nr -= PAGE_SIZE;
        }
        return dump_emit(cprm, zeroes, nr);
    }
}
Since the coredump is piped, there is no llseek operation, which means it will go to the else branch. Thus, a return of 0 from dump_emit is the cause. We then used stap to capture the dump_emit function.
function func:string(task:long)%{
    snprintf(STAP_RETVALUE, MAXSTRINGLEN, "%s", signal_pending(current) ? "true" : "false");%
}
probe kernel.function("dump_emit").return{
    printf("return: %d, cprm->limit:%d, cprm->written: %d, signal: %s\n", $return, @entry($cprm->limit), @entry($cprm->written), func($return));
}
The results were as follows:
return: 1, cprm->limit:-1, cprm->written: 0, signal: false
return: 1, cprm->limit:-1, cprm->written: 64, signal: false
return: 1, cprm->limit:-1, cprm->written: 120, signal: false... (omitted 9221238 lines)...
return: 1, cprm->limit:-1, cprm->written: 37623402496, signal: false
return: 1, cprm->limit:-1, cprm->written: 37623406592, signal: false
return: 1, cprm->limit:-1, cprm->written: 37623410688, signal: false
return: 0, cprm->limit:-1, cprm->written: 37623414784, signal: true
As expected, dump_emit returned 0 at this point, with 37623414784 bytes written to the core file. This was mainly because the dump_interrupted detection condition was true. (cprm->limit = -1 would not enter the if logic, and kernel_write to write pipe did not encounter errors).
Next, let’s examine the dump_interrupted function. For easier reading, we organized the relevant functions.
static bool dump_interrupted(void){
    /*
     * SIGKILL or freezing() interrupt the coredumping. Perhaps we
     * can do try_to_freeze() and check __fatal_signal_pending(),
     * but then we need to teach dump_write() to restart and clear
     * TIF_SIGPENDING.
     */
    return signal_pending(current);
}
static inline int signal_pending(struct task_struct *p){
    return unlikely(test_tsk_thread_flag(p,TIF_SIGPENDING));
}
static inline int test_tsk_thread_flag(struct task_struct *tsk, int flag){
    return test_ti_thread_flag(task_thread_info(tsk), flag);
}
static inline int test_ti_thread_flag(struct thread_info *ti, int flag){
    return test_bit(flag, (unsigned long *)&ti->flags);
}
/** * test_bit - Determine whether a bit is set * @nr: bit number to test * @addr: Address to start counting from */
static inline int test_bit(int nr, const volatile unsigned long *addr){
    return 1UL && (addr[BIT_WORD(nr)] >> (nr && (BITS_PER_LONG-1)));}
#ifdef CONFIG_64BIT
#define BITS_PER_LONG 64
#else
#define BITS_PER_LONG 32
#endif /* CONFIG_64BIT */
#define TIF_SIGPENDING      2   /* signal pending */ // platform-specific. For example, in X64 architecture.
With the above code, it is clear that the dump_interrupted function checks whether the task’s thread_info->flags has the TIF_SIGPENDING bit set.
We currently suspect that this is still related to the user’s memory VMA. However, what scenarios would trigger the TIF_SIGPENDING bit to be set is a question. The comment in the dump_interrupted function has already indicated that one possibility is receiving a KILL signal, and the other is freezing(). Freezing is generally related to cgroups, which are commonly used in Docker. KILL could possibly be sent by systemd. Thus, we conducted two experiments:
Experiment One:
systemd starts an instance, running a service without traffic. The test result shows gdb works normally... then we start it with systemd again, without traffic. The test result is also normal. This is strange. However, we cannot rule out systemd. Recalling the difference between with and without traffic, the coredump size differs due to the amount of empty space in the VMA, thus affecting the coredump speed. When there is no traffic, the VMA is mostly empty, resulting in a faster coredump; when there is traffic, the VMA is not empty, causing a slower coredump. Therefore, we suspect it is related to the coredump duration; if it exceeds a certain time, the TIF_SIGPENDING might be set.Experiment Two:
We generate a 50G memory. The code is as described above. In the container, we still use systemd to start a test program (directly replacing this bin in the problematic container, then restarting the service with systemctl) and then send a SEGV signal. We used stap to capture the results. The coredump took a long time. The result was surprising. The core was normal, and gdb also worked fine.The source of the TIF_SIGPENDING signal is a problem.
Another investigation direction is why get_dump_page returned NULL. Therefore, we now have two lines of investigation:
-
We need to determine the source of the TIF_SIGPENDING signal. -
The reason why get_dump_page returned NULL.
Analysis of get_dump_page Returning NULL
First, let’s examine the cases where get_dump_page returns NULL:
* Returns NULL on any kind of failure - a hole must then be inserted into * the corefile, to preserve alignment with its headers; and also returns * NULL wherever the ZERO_PAGE, or an anonymous pte_none, has been found - * allowing a hole to be left in the corefile to save diskspace.Looking at the comments, it returns NULL if the page is ZERO_PAGE or there is a pte_none issue.
First, we examined the ZERO issue and constructed a ZERO_PAGE program for testing:
#include <stdio.h>#include <unistd.h>#include <sys/mman.h>
const int BUFFER_SIZE = 4096 * 1000;
int main(void){
    int i = 0;
    unsigned char* buffer;
    for(int n=0; n<10240; n++){
        buffer = mmap(NULL, BUFFER_SIZE, PROT_READ|PROT_WRITE, MAP_PRIVATE|MAP_ANONYMOUS, -1, 0);
        for(i = 0; i < BUFFER_SIZE - 3 * 4096; i += 4096){
            buffer[i] = 0;
        }
    }
    // zero page
    for(i=0; i < BUFFER_SIZE - 4096; i += 4096) {
        char dirty = buffer[i];
        printf("%c", dirty);
    }
    printf("ok...\n");
    sleep(3600);
}
The test result was that the coredump was normal, and we traced the return values of get_dump_page. The results were somewhat different from expected, returning many NULLs. This indicates that it is not significantly related to the factors of get_dump_page.
Thus, we shifted our focus to the source of the TIF_SIGPENDING signal.
Analysis of TIF_SIGPENDING Signal Source
We used bpftrace to capture the situation:
#!/usr/bin/env bpftrace
#include <linux/sched.h>
kprobe:__send_signal{
    $t = (struct task_struct *)arg2;
    if ($t->pid == $1) {
        printf("comm:%s(pid: %d) send sig: %d to %s\n", comm, pid, arg0, $t->comm);
    }
}
The results were as follows:
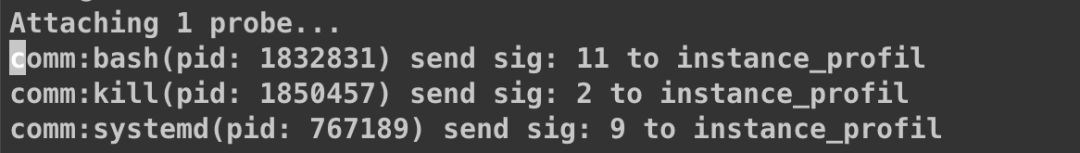
The results were quite interesting. The kill and systemd interrupted the coredump process. Signals 2 (SIGINT) and 9 (SIGKILL) were sufficient to interrupt the process. Now the question became why kill and systemd would send these two signals. One possibility is a timeout. The coredump process, if not running for too long, might trigger some mechanism from systemd.
Thus, we checked the documentation for the systemd service and found the following segment:
TimeoutAbortSec=This option configures the time to wait for the service to terminate when it was aborted due to a watchdog timeout (see WatchdogSec=). If the service has a short TimeoutStopSec= this option can be used to give the system more time to write a core dump of the service. Upon expiration the service will be forcibly terminated by SIGKILL (see KillMode= in systemd.kill(5)). The core file will be truncated in this case. Use TimeoutAbortSec= to set a sensible timeout for the core dumping per service that is large enough to write all expected data while also being short enough to handle the service failure in due time. Takes a unit-less value in seconds, or a time span value such as “5min 20s”. Pass an empty value to skip the dedicated watchdog abort timeout handling and fall back TimeoutStopSec=. Pass “infinity” to disable the timeout logic. Defaults to DefaultTimeoutAbortSec= from the manager configuration file (see systemd-system.conf(5)). If a service of Type=notify handles SIGABRT itself (instead of relying on the kernel to write a core dump) it can send “EXTEND_TIMEOUT_USEC=…” to extended the abort time beyond TimeoutAbortSec=. The first receipt of this message must occur before TimeoutAbortSec= is exceeded, and once the abort time has extended beyond TimeoutAbortSec=, the service manager will allow the service to continue to abort, provided the service repeats “EXTEND_TIMEOUT_USEC=…” within the interval specified, or terminates itself (see sd_notify(3)).
The highlighted text caught our attention, so we increased the TimeoutAbortSec to “10min” and tried again. It was ineffective…
After it failed, it was quite strange. Was systemd not the initiator of the signal, but rather the “transmitter” of the signal? Now we had two suspicions: either systemd was the initiator of the signal, or systemd was not the initiator of the signal, but rather the “transmitter” of the signal. So we captured both the business process and the systemd process at the same time. The results were as follows:
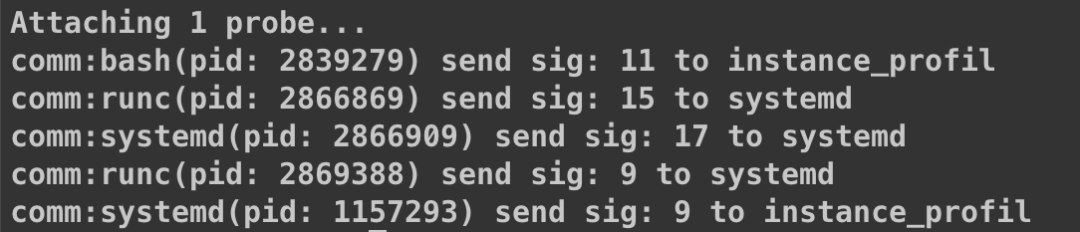
Among them, 3533840 is the init process systemd of the container. 3533916 is the business process. As expected, systemd was not the first initiator of the signal. Systemd was killed by the signal 15 (SIGTERM) sent by runc, which led to the stop of systemd, and before stopping, it initiated a kill action on the subprocesses. This explains the final signal sent by systemd.
One question arose: previously, we tested the system + docker scenario with program 1 and did not reproduce the issue. Recalling the coredump process, it should be noted that program 1 did not write to every page; it only wrote the first byte of the first page after malloc. The coredump traverses each VMA much faster than writing all pages (because there is not as much empty space, and the VMA is not so fragmented). Although the coredump size is large, the time is short, so the problem was not triggered, which brought some twists to the investigation.
Thus, we shifted our investigation direction to the kill command and runc. After investigation, we discovered that a prestop script in K8S’s lifecycle had a kill behavior. We disabled this script and captured again:

This time, there was no kill behavior, but systemd was still killed by runc, which sent two signals, one being SIGTERM and the other being SIGKILL. Now we can explain the source of the kill signal; in fact, both the kill and systemd signals indirectly or directly stem from runc. The destruction command from runc comes from k8s.
Thus, we continued to investigate based on the K8S logs. After investigation, we found that the final triggering logic came from an internal implementation of ByteDance’s Load eviction. This mechanism evicts this instance when the container’s load is too high to avoid affecting other instances. Since the coredump process causes the CPU to remain in kernel mode for a long time, it leads to a high load. Therefore, the Pod eviction was triggered.
During the coredump, the instance’s load was very high, causing the K8S component kubelet to trigger the eviction behavior due to high load. This deleted the pod, stopped systemd, and killed the process that was generating the coredump, ultimately leading to the incomplete writing of VMA data in the second stage of the coredump.
Verifying the Issue
To verify, we stopped the K8S component kubelet and then generated a core for the service. Finally, we used gdb to verify that it worked normally, and gdb read the data correctly. Thus, this issue was completely resolved. Finally, we modified the internal implementation of the cgroup-level Load (and the scheme for collecting data similar to the overall machine load) to filter out D state processes (the coredump process appears as D state in user mode), which completely resolved this issue.
Summary
This coredump file truncation was caused by the coredump process being killed (by SIGKILL) leading to incomplete writing of the VMA (only part was written). The resolution involved reading the kernel source code and using bpftrace and systemtap tools to trace the coredump process, printing relevant data, and analyzing the cause of the problem based on the source code. At the same time, we gained a certain understanding of the kernel’s coredump process.
Finally, we welcome you to join the ByteDance infrastructure team to discuss and solve problems together and grow stronger!
Appendix: Simple Analysis of Coredump Files
During the investigation of this issue, we also read the relevant source code for handling coredumps in the kernel and briefly summarized:
A coredump file is essentially a simplified version of an ELF file. The coredump process is not complicated. It consists of two stages: one stage writes the program header (the first program header is the Note Program Header), and each program header contains the size of the VMA and its offset in the file. GDB also determines the position of each VMA based on this. The other stage writes the VMA data, traversing all VMAs of the process and writing them to the file. The structure of a coredump file can be simply represented as follows.

References
-
Binary_File_Descriptor_library (https://en.wikipedia.org/wiki/Binary_File_Descriptor_library) -
systemd.service — Service unit configuration (https://www.freedesktop.org/software/systemd/man/systemd.service.html) -
Kubernetes Pod Lifecycle (https://kubernetes.io/docs/concepts/workloads/pods/pod-lifecycle/)
More Shares
Improvements and Practices on RocksDB Storage Engine by ByteDance
In-depth Understanding of Linux Kernel — TLB Shootdown Caused by jemalloc and Optimization
ByteDance’s Self-developed Trillion-level Graph Database & Graph Computing Practices
ByteDance Infrastructure Team
The ByteDance Infrastructure Team is a crucial group that supports the stable operation of multiple user products with hundreds of millions of users, including Douyin, Toutiao, Xigua Video, and Volcano Video, providing guarantees and driving force for the rapid and stable development of ByteDance and its businesses.
Internally, the infrastructure team is primarily responsible for the construction of ByteDance’s private cloud, managing clusters with thousands of servers, overseeing thousands of mixed deployments of computing/storage, both online and offline, and supporting stable storage of several EB of massive data.
Culturally, the team actively embraces open-source and innovative software and hardware architectures. We are continuously recruiting individuals in the infrastructure direction; for details, please refer to job.bytedance.com (see “Read Original” at the end of the article). If interested, you can contact us via email at guoxinyu.0372@bytedance.com .

Welcome to follow the “ByteDance Technical Team”
 Click to read the original article and come join us!