Click the above “Beginner’s Visual Learning“, select to add “Star” or “Pin“
Important content delivered promptly.

Introduction
Let me introduce a simple and efficient chart drawing and data visualization tool in C++: matplotlib-cpp. First, here are my system configurations and software version information.
- Windows 10 64-bit
- VS2015
- Python3.6.5
- OpenCV4.2
Installing and Configuring Matplotlib-cpp
Using C++ to call Python’s matplotlib library for various data chart displays is the simplest C++ chart library. It supports usage on both Windows and Linux systems.
Download
git clone https://github.com/lava/matplotlib-cpp.gitThe directory structure is as follows:
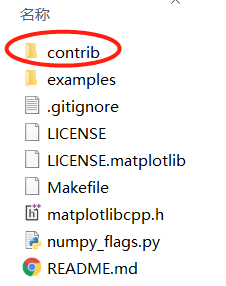
Open WinBuild.cmd in the contrib folder and run this script to complete the compilation. However, before running, first open and modify the default parameters on lines 4-8 to match your software version and information. My modifications are as follows:
1REM ------Set Your Environment-------------------------------
2if NOT DEFINED MSVC_VERSION set MSVC_VERSION=14
3if NOT DEFINED CMAKE_CONFIG set CMAKE_CONFIG=Release
4if NOT DEFINED PYTHONHOME   set PYTHONHOME=C:/Users/Administrator/AppData/Local/Programs/Python/Python36
5REM ---------------------------------------------------------
Then run the following in the Windows command line:
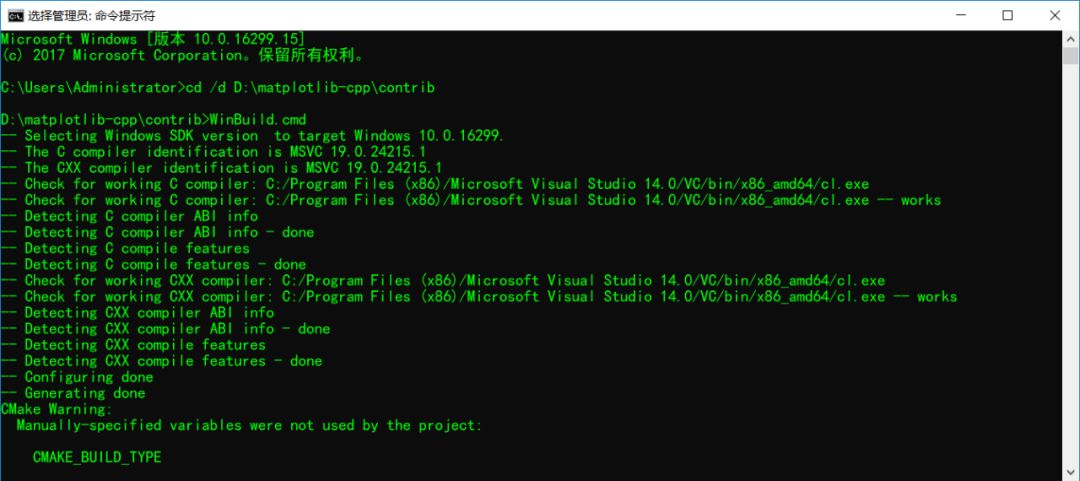
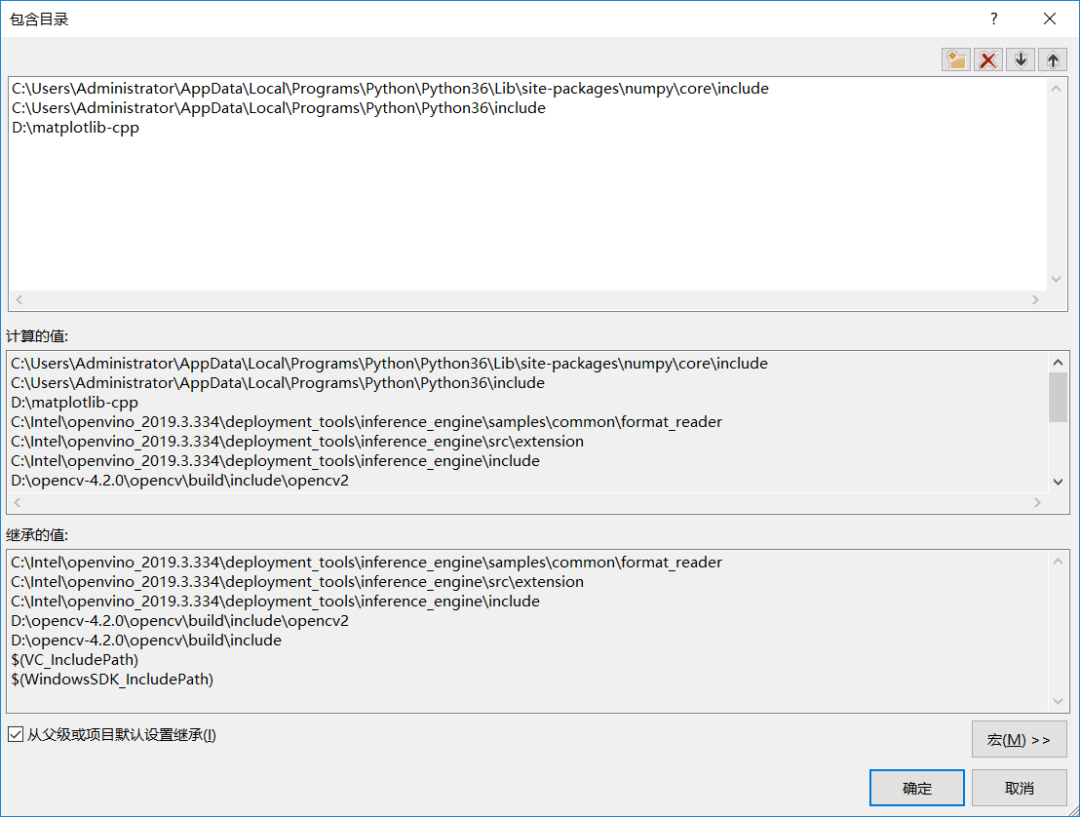
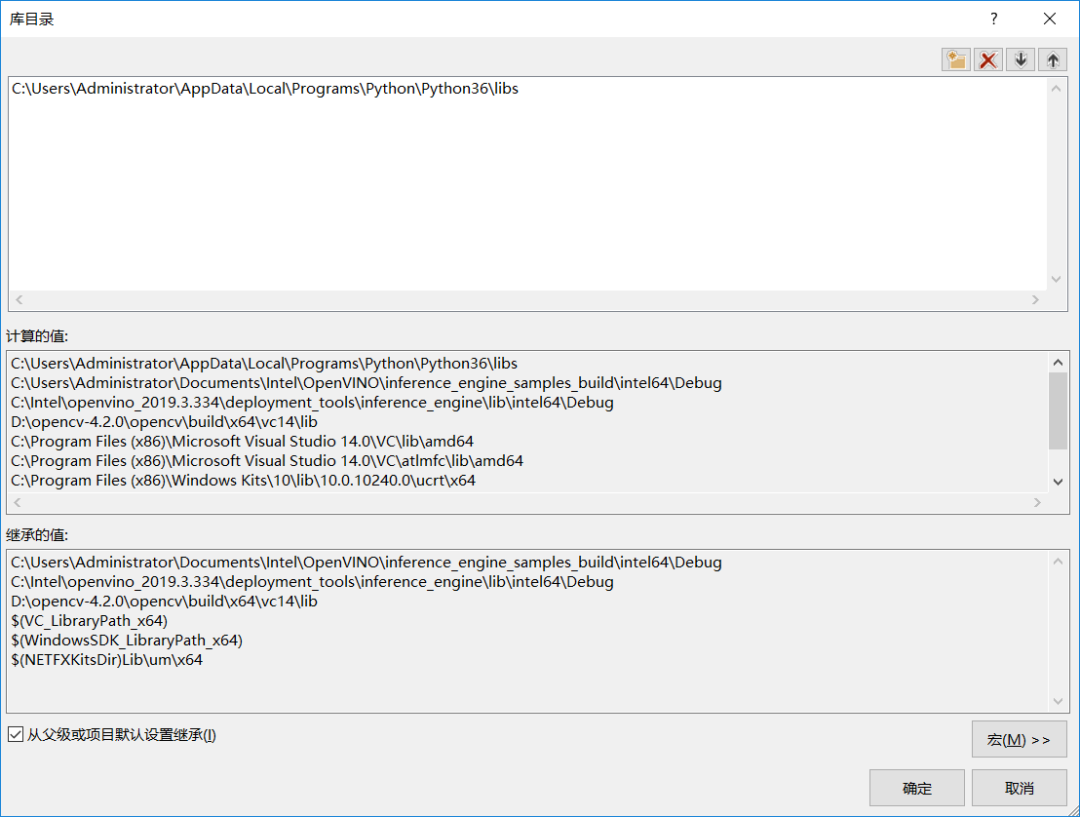
After completing the compilation, you’re all set! Now you need to configure VS2015, which mainly consists of three steps:
– Configure Include Paths
– Configure Library Directories
– Configure Linker
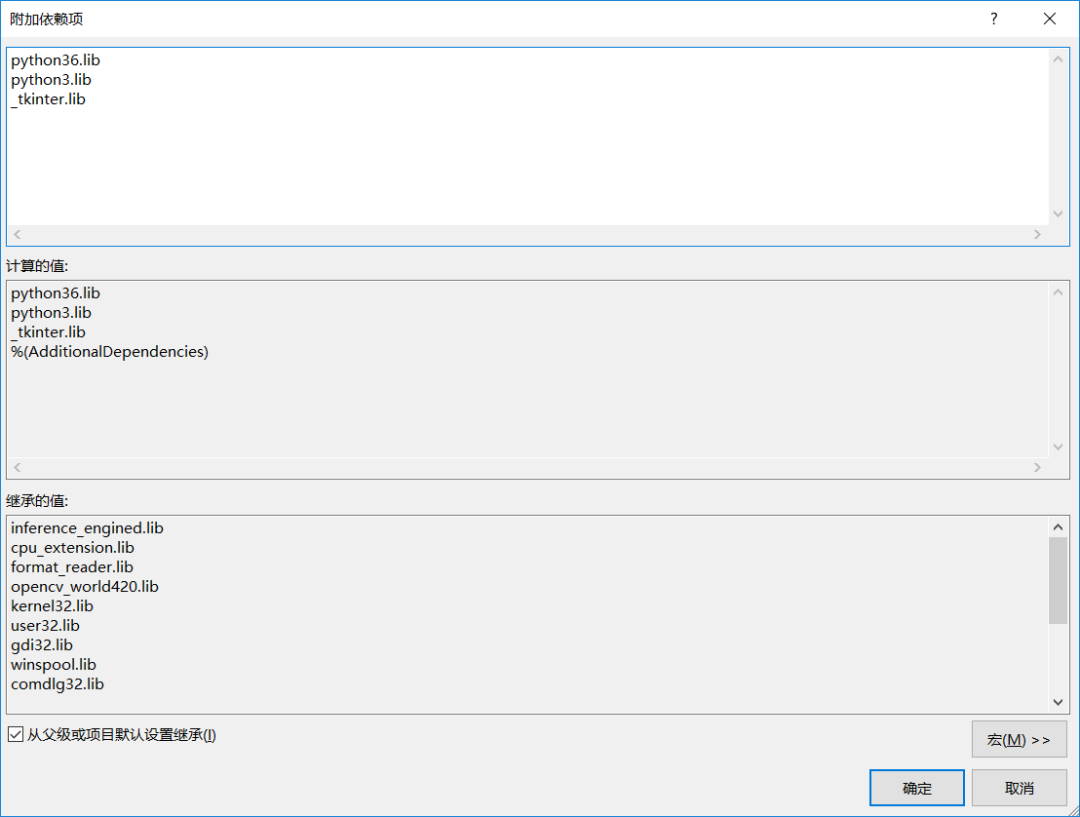
Note:
Most importantly, set the corresponding Python home directory in the environment variables!
Using matplotlib-cpp
– Testing matplotlib-cpp
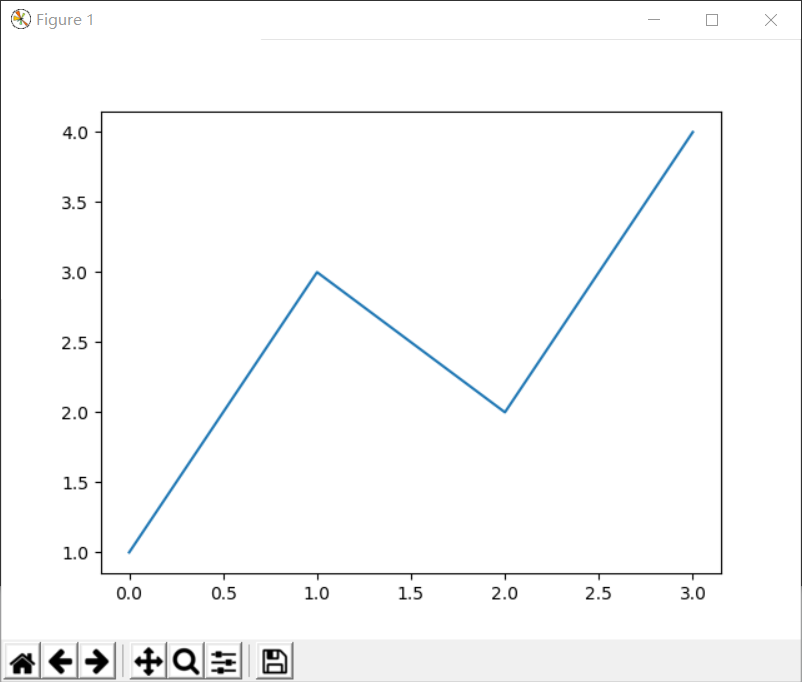
Create a test cpp file and add the following code:
1#include "matplotlibcpp.h"
2namespace plt = matplotlibcpp;
3int main() {
4    plt::plot({1,3,2,4});
5    plt::show();
6}
The output will be as follows:
Using OpenCV + matplotlib-cpp Together
Displaying Images
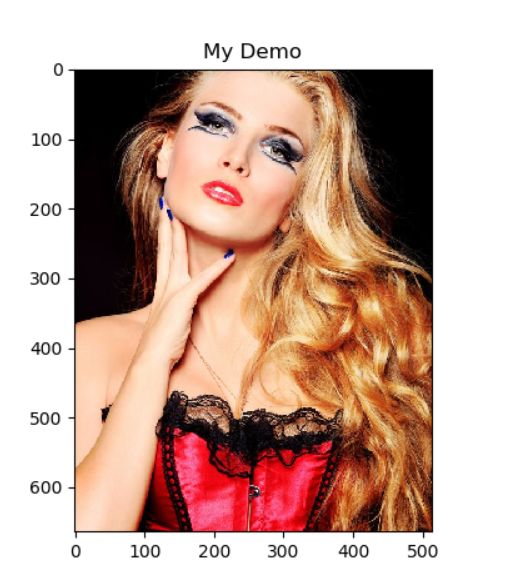
Using plt::imshow supports displaying both grayscale and color images. The code to display an image is as follows:
1Mat src = imread("D:/images/test1.png");
2cvtColor(src, src, COLOR_BGR2RGB);
3const uchar* buff = src.ptr<uchar>(0);
4int h = src.rows;
5int w = src.cols;
6int channels = src.channels();
7plt::title("My Demo");
8plt::imshow(buff, h, w, channels);
9plt::show();
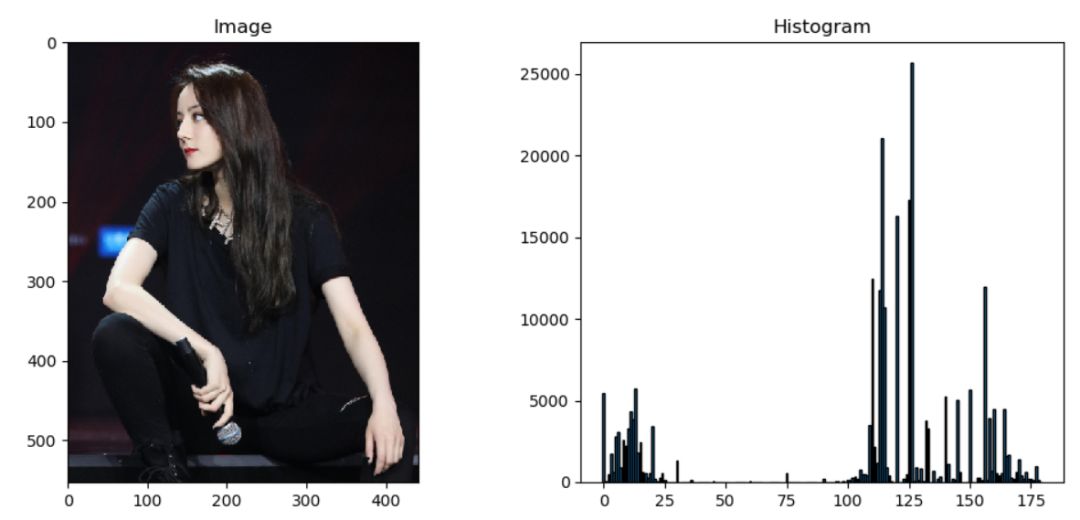
Convert Image to HSV Color Space and Display Histogram for H Channel
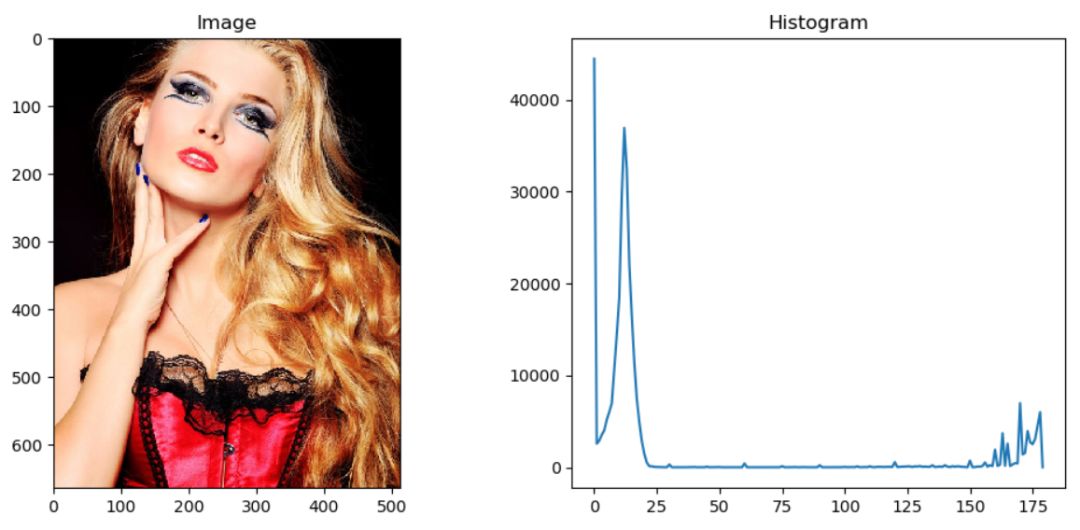
Histogram Bar
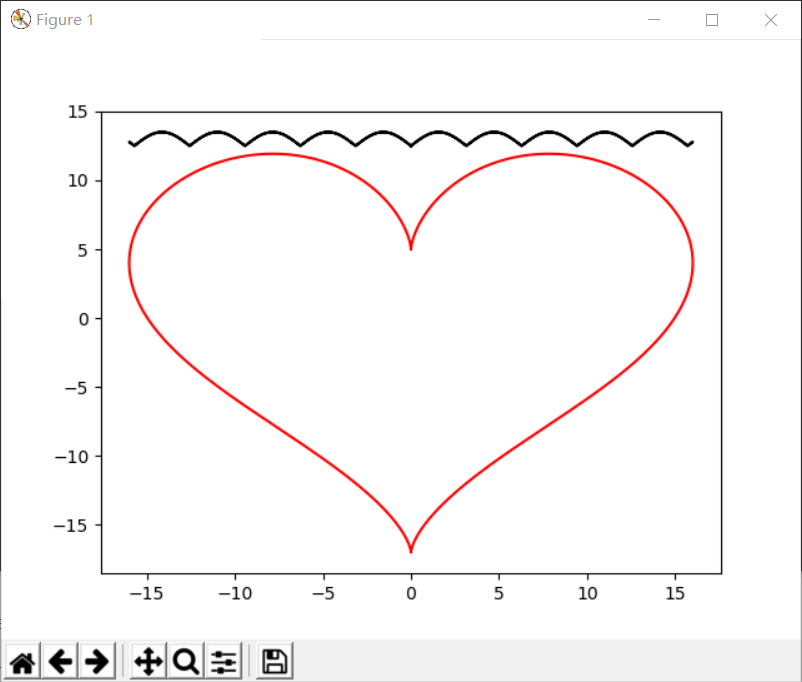
Drawing Various Charts from Data
 1// Prepare data.
 2int n = 5000; // number of data points
 3vector<double> x(n), y(n);
 4for (int i = 0; i<n; ++i) {
 5    double t = 2 * CV_PI*i / n;
 6    x.at(i) = 16 * sin(t)*sin(t)*sin(t);
 7    y.at(i) = 13 * cos(t) - 5 * cos(2 * t) - 2 * cos(3 * t) - cos(4 * t);
 8}
 9
10// plot() takes an arbitrary number of (x,y,format)-triples.
11// x must be iterable (that is, anything providing begin(x) and end(x)),
12// y must either be callable (providing operator() const) or iterable.
13plt::plot(x, y, "r-", x, [](double d) { return 12.5 + abs(sin(d)); }, "k-");
14
15
16// show plots
17plt::show();
Displayed as follows:
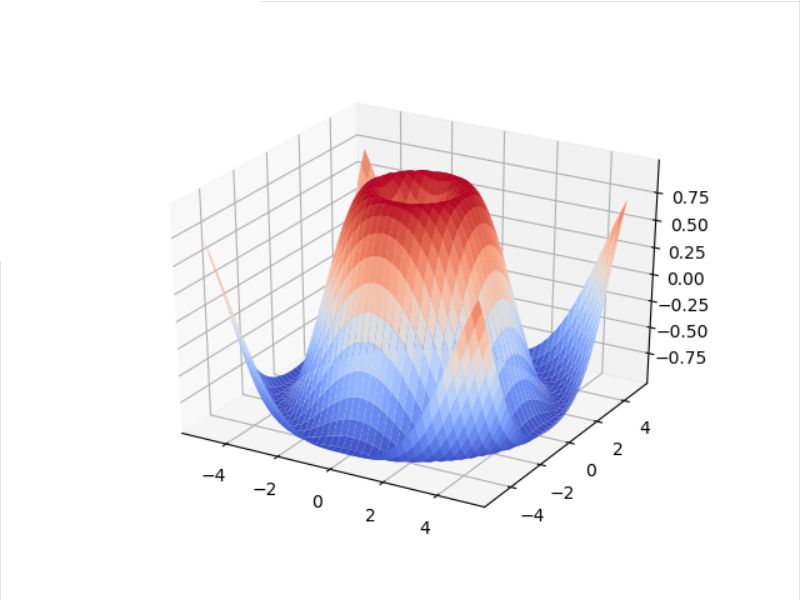
3D Data Visualization
 1std::vector<std::vector<double>> x, y, z;
 2for (double i = -5; i <= 5;  i += 0.25) {
 3    std::vector<double> x_row, y_row, z_row;
 4    for (double j = -5; j <= 5; j += 0.25) {
 5        x_row.push_back(i);
 6        y_row.push_back(j);
 7        z_row.push_back(::std::sin(::std::hypot(i, j)));
 8    }
 9    x.push_back(x_row);
10    y.push_back(y_row);
11    z.push_back(z_row);
12}
13
14plt::plot_surface(x, y, z);
15plt::show();
Displayed as follows:
Good news!
"Beginner's Visual Learning" Knowledge Circle
is now open to the public👇👇👇


Download 1: OpenCV-Contrib Extension Module Chinese Tutorial
Reply "Extension Module Chinese Tutorial" in the "Beginner's Visual Learning" public account backend to download the first Chinese version of the OpenCV extension module tutorial online, covering installation of extension modules, SFM algorithms, stereo vision, target tracking, biological vision, super-resolution processing, and more than twenty chapters of content.

Download 2: Python Visual Practical Projects 52 Lectures
Reply "Python Visual Practical Projects" in the "Beginner's Visual Learning" public account backend to download 31 visual practical projects including image segmentation, mask detection, lane line detection, vehicle counting, adding eyeliner, license plate recognition, character recognition, emotion detection, text content extraction, and face recognition, helping to quickly learn computer vision.

Download 3: OpenCV Practical Projects 20 Lectures
Reply "OpenCV Practical Projects 20 Lectures" in the "Beginner's Visual Learning" public account backend to download 20 practical projects based on OpenCV, advancing OpenCV learning.

Group Chat

Welcome to join the public account reader group to exchange ideas with peers. Currently, there are WeChat groups for SLAM, 3D vision, sensors, autonomous driving, computational photography, detection, segmentation, recognition, medical imaging, GAN, algorithm competitions, etc. (these will gradually be subdivided). Please scan the WeChat ID below to join the group, and note: "Nickname + School/Company + Research Direction", for example: "Zhang San + Shanghai Jiao Tong University + Visual SLAM". Please follow the format for notes; otherwise, you will not be approved. After successful addition, you will be invited into relevant WeChat groups based on your research direction. Please do not send advertisements in the group; otherwise, you will be removed. Thank you for your understanding~