
01
【Article Summary】
Recently, Xiamen University and the Jiageng Innovation Laboratory achieved significant breakthroughs in the field of dynamic nuclear magnetic resonance (NMR) spectroscopy of electrolytes using a machine learning combined approach. They successfully predicted the dynamic ⁷Li NMR chemical shifts in the lithium bis(fluorosulfonyl)imide (LiFSI)/dimethyl ether (DME) electrolyte. The prediction accurately revealed the inversion phenomenon of the ⁷Li NMR chemical shifts, aligning with experimental observations. This achievement marks another iteration of methods and system application in the relevant field following the team’s research on dynamic NMR spectroscopy of battery cathode materials and the NMRNet deep learning framework. The related research results have been published in the prestigious journal, the Journal of the American Chemical Society.
The corresponding authors of this research are Professor Cheng Jun and Associate Professor Tang Fujie from Xiamen University. The co-first authors are You Qi, a 2023 doctoral student, and Sun Yan, a postdoctoral researcher from the School of Chemistry and Chemical Engineering at Xiamen University. Wang Feng, an associate researcher at the Jiageng Innovation Laboratory, provided assistance during the research process. This research work was supported by the National Natural Science Foundation of China (grant numbers: 22021001, 22225302, 21991151, 21991150, 92161113), the Central Universities Basic Research Fund (grant number: 20720220009), and the National Key Research and Development Program (grant number: 2024YFA1210804).
02
【Research Background】
Nuclear magnetic resonance (NMR) spectroscopy, as a non-destructive and local structure-sensitive characterization method, is suitable for characterizing the chemical environment of specific atomic nuclei in solvation structures. Additionally, experimental NMR spectra can reveal information such as relaxation times and exchange dynamics. However, linking observed NMR spectral changes to intrinsic molecular structure changes is a highly challenging task. Some studies using density functional theory (DFT) calculations have provided limited information on the trends of electrolyte NMR spectra through complex sampling methods for cluster extraction. Many static calculations have attempted to use first-principles methods to compute ¹H, ⁷Li, ¹⁷O, ²⁵Mg, ⁴³Ca, and ⁶⁷Zn NMR spectra to explain structure-spectra relationships. Nevertheless, the experimental chemical shifts reflect a weighted average from different local sites, integrating local structure and dynamic information, which complicates signal resolution and increases the difficulty of analyzing spectral-structural relationships.
Molecular dynamics (MD) simulations can capture dynamic structural changes in various electrolytes using classical force field methods, first-principles methods, and machine learning methods. However, the computational cost of obtaining a single spectral response from MD simulation configurations is high, and the complexity of configuration sampling in applying NMR-DFT calculations in complex electrolyte systems makes it challenging to directly link molecular structures with experimental spectral observations. However, previous studies have attempted to train machine learning models using structural descriptors of solid-state structures and their corresponding NMR chemical shifts, improving the speed of chemical shift predictions while maintaining high accuracy. Currently, there is no clear consensus on the relationship between the dynamic structural features of electrolytes and their experimental spectral observations, making a powerful computational method essential. Furthermore, validating simulation results and correlating them with experimental observations is highly challenging but is an important benchmark for assessing simulation reliability.
03
【Research Content】
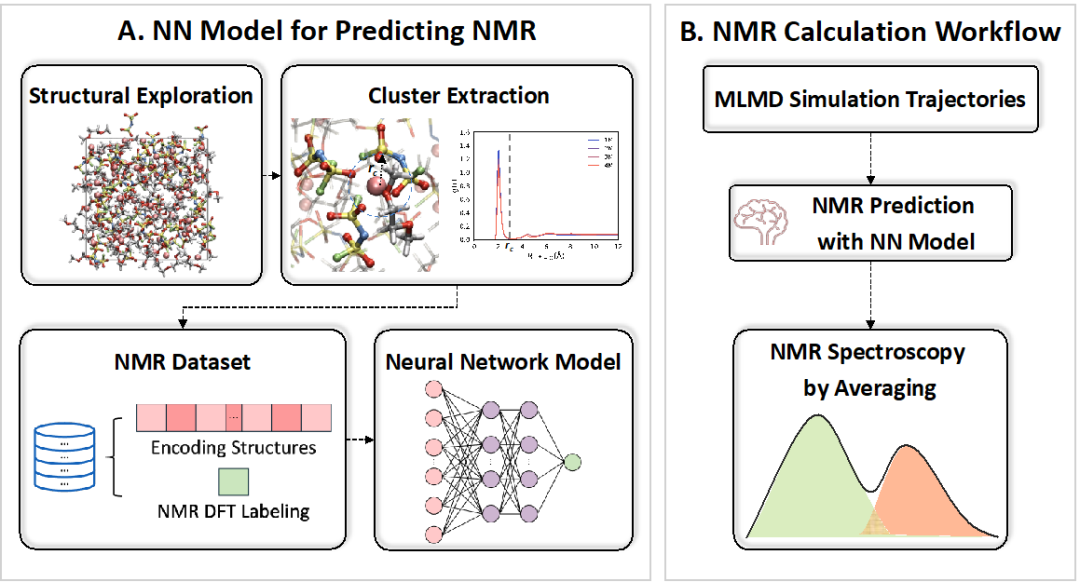
Figure 1: Process of predicting nuclear magnetic resonance (NMR) spectra. (Left) Method for training the neural network (NN) model. Capturing various structures at different concentrations and extracting the solvation structure of Li⁺. Subsequently, descriptors are used to encode the structures and calculate their corresponding chemical shifts. (Right) NMR spectrum prediction process. Using machine learning molecular dynamics (MLMD) simulations to generate trajectories, then utilizing the obtained NMR prediction neural network model to obtain NMR spectra.
The process of predicting nuclear magnetic resonance (NMR) spectra is shown in Figure 1. When constructing the neural network (NN) model, we first sparsely sample configurations from the MLMD trajectories, extract the first solvation shell around the lithium ions, label them as clusters, and encode the structures using the LMBTR descriptor, resulting in a DFT-based dataset containing approximately 28,000 ⁷Li chemical shift data. Subsequently, we validated the neural network-based NMR spectrum model using the LiFSI/DME solution, with a root mean square error of approximately 0.13 ppm for the isotropic values of ⁷Li in the test set. After obtaining the neural network model, we predicted the NMR spectra of the LiFSI/DME solution trajectories obtained from machine learning molecular dynamics simulations at four concentrations. We performed equidistant sampling of the trajectories at four concentrations, ensuring that the number of lithium ions at each concentration was approximately 90,000, and then encoded the solvation structure of Li⁺ using the LMBTR descriptor as input to the neural network model to predict the NMR chemical shifts. The predicted results are shown in Figure 2b, which exhibit a similar trend to the experimental results (Figure 2a) in the variation of ⁷Li chemical shifts in electrolytes of different concentrations, with the inversion phenomenon of ⁷Li chemical shifts occurring at a concentration of 4 M.
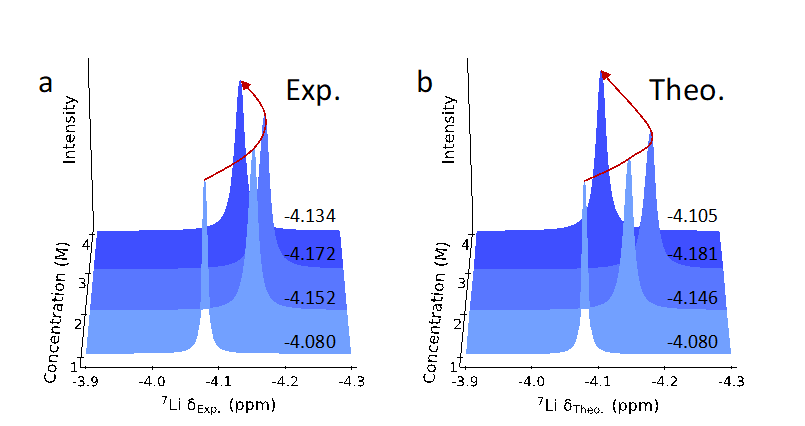
Figure 2: Comparison of NMR spectrum prediction results with experimental results. (a) Experimental NMR spectra of 1 M to 4 M LiFSI/DME solutions. (b) Neural network predicted NMR spectra. The red curve visually illustrates the trend of NMR spectra with increasing concentration.
To reveal the spectral-structural relationship and deeply analyze the underlying molecular structural evolution mechanisms and interaction laws caused by concentration changes leading to NMR spectral shifts, we employed unsupervised principal component analysis (PCA) to reduce the dimensionality of the descriptors of the local structure of lithium ions, as shown in Figure 3a. We found that the first principal component PC#1 reflects the symmetry of the solvation structure and the orientation changes of molecules around Li⁺; while the second principal component PC#2 captures the local environmental information around Li⁺. The region with the largest chemical shift value (red) is associated with solvent-separated ion pairs (SSIPs, where the number of FSI⁻ in the solvation shell nFSI⁻=0); the yellow region corresponds to contact ion pairs (CIPs, nFSI⁻=1); the green region is associated with aggregates (AGGs, nFSI⁻=2 or nFSI⁻=3); while the smallest chemical shift value occurs in AGGs and AGGs+ when nFSI⁻≥3. This finding aligns with chemical intuition and demonstrates that the principal component analysis method can effectively capture the impact of local environmental changes on surrounding electronic density. Figure 3b reveals the dominant moderate (yellow) and higher (green) NMR values (absolute values) of the structures when the concentration changes from 3 M to 4 M, with the former increasing and the latter decreasing. It is speculated that the increase in the proportion of CIP (yellow) structures is due to Li⁺-Li⁺ interactions promoting the emergence of highly localized AGGs+ structures.
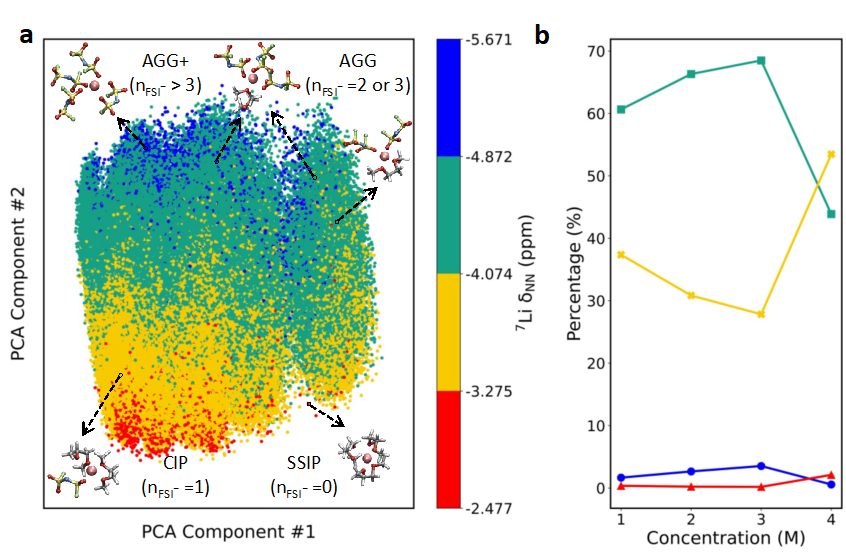
Figure 3: (a) Principal component analysis (PCA) of the solvation structure patterns of lithium ions Li⁺ at different concentrations. Each point’s color coding represents the corresponding NMR chemical shift value. The x-axis and y-axis represent the two most important principal components PC#1 and PC#2. The color coding for representative segments is as follows: red represents solvent-separated ion pairs (SSIP), yellow represents contact ion pairs (CIP), green represents aggregates (AGGs), and blue represents the number of FSI⁻ anions nFSI⁻=3 and AGGs with nFSI⁻>3. (b) The proportion of different colored representative solvation structures changes with LiFSI concentration.
Furthermore, the results of the principal component analysis (PCA) were supported by local structural parameters such as nFSI⁻ and LSI (local structure index, representing the unevenness of the radial distance distribution of oxygen atoms around Li⁺). Figure 4a shows the variation of NMR chemical shift values with various LSI values, with colors distinguishing based on nFSI⁻. Li⁺ in a higher nFSI⁻ solvation environment tends to have its chemical shift move towards the high field direction, and vice versa, providing a basis for the regional division of solvation structures in PCA. Additionally, we divided LSI into three ranges and calculated the corresponding average chemical shifts, with the histogram shown in Figure 4b, indicating that smaller LSI ranges primarily correspond to lower chemical shift ranges. As the chemical shift values decrease, LSI values also decrease, a trend consistent across all four concentrations. This phenomenon is attributed to configurations with a coordination number reaching a higher level nFSI⁻≥4 tending to form long-chain clusters that fill interstitial structures. Meanwhile, at a concentration of 4 M, solvation structures with coordination numbers of nFSI⁻=0 or 1 (blue region) appear alongside solvation structures with nFSI⁻≥4, as shown in 4d and e, with these structures distributed around aggregates of AGGs+ type, resulting in an overall lower LSI value compared to the 3 M concentration. Furthermore, we studied some solvation structures within the concentration range of 1 M to 4 M to quantify the deformation factor ɸ of the electronic localization function (ELF) of lithium nuclei, with average values of approximately 1.0130±0.0002, 1.0128±0.0002, 1.0127±0.0001, and 1.0130±0.0001 at concentrations of 1-4 M, respectively. Figure 4c illustrates the schematic of the changes in ELF deformation degree. As shown, with an increase in the deformation factor, the ELF deformation becomes more pronounced. When the deformation is more significant, the electronic shielding around the lithium nucleus weakens, leading to a low-field shift in chemical shifts. Therefore, the average deformation factor decreases from 1 M to 3 M and increases from 3 M to 4 M, which is consistent with the situation where NMR chemical shifts first move towards the high field and then towards the low field.
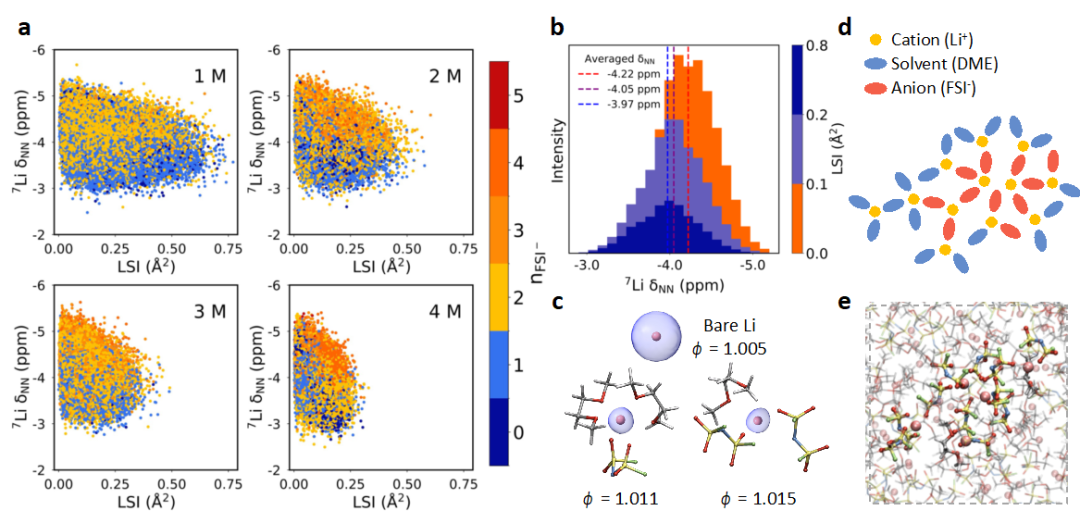
Figure 4: (a) Correlation diagram between local structure index (LSI) and chemical shift values at each concentration. The color of each point corresponds to the value of nFSI⁻. (b) Histogram of chemical shifts corresponding to different LSI ranges, with red, purple, and blue dashed lines representing the average chemical shifts corresponding to LSI ranges of 0.1 Ų, 0.1~0.2 Ų, and 0.2~0.8 Ų, respectively. (c) Schematic of electronic localization function (blue) around the lithium nucleus (pink sphere) with different deformation factors ɸ. (d), (e) Schematic of Li⁺ and FSI⁻ long-chain clusters, with element color coding as follows: lithium (Li) is pink, carbon (C) is gray, hydrogen (H) is white, oxygen (O) is red, sulfur (S) is yellow, nitrogen (N) is blue, and fluorine (F) is green.
04
【Conclusion and Outlook】
This work proposes a machine learning-based method that combines MLP and NN models to compute the dynamic NMR spectra of LiFSI/DME solutions. As the concentration of LiFSI increases from 1 M to 3 M, the changes in solvation structure cause the NMR chemical shifts to move towards the high field, while at 4 M, they shift towards the low field. We established a quantitative relationship between molecular structures and NMR spectra, deeply analyzing the attribution of solvation structures. The research indicates the existence of two competing local solvation structures, with their dominance alternating as the electrolyte concentration approaches the upper limit, leading to changes in ⁷Li chemical shifts. This method is precise and efficient, with predicted results highly consistent with experimental spectra. It is expected to be extended to other complex electrolyte systems and predict chemical shifts of other atomic nuclei.
This work provides a new perspective for understanding the relationship between solvation structures and NMR chemical shifts, serving as an efficient means for studying electrolyte solutions, deepening the understanding of electrolyte solvation structures, and opening new pathways for optimizing electrolyte design.
05
【Acknowledgments】
Thanks to Professor Hu Bingwen from East China Normal University and Professor Liu Haiming from ShanghaiTech University for their valuable suggestions. Professor Cheng Jun expresses gratitude for the support from the National Natural Science Foundation of China (grant numbers: 22021001, 22225302, 21991151, 21991150, 92161113), the Central Universities Basic Research Fund (grant number: 20720220009), the Artificial Intelligence Application Electrochemistry Laboratory (AI4EC), and IKKEM (grant numbers: RD2023100101 and RD2022070501). Associate Professor Tang Fujie thanks the Key Research and Development Program of the Ministry of Science and Technology (grant number: 2024YFA1210804) and the startup funding from Xiamen University.
Paper Link:
https://pubs.acs.org/doi/10.1021/jacs.5c02710
Submission Email[email protected]For submission and content collaboration, please add WeChatcailiaorenVIP