
Abstract
The Irish mineral field contains both zinc-lead deposits and copper-nickel-arsenic deposits, but the relationship between their formation is controversial. This study focuses on the copper-nickel-arsenic ores of the Lisheen deposit, analyzing their mineral characteristics, formation sequence, and chemical composition. The research found that these copper-nickel-arsenic ores and zinc-lead ores were formed from the same mineralizing fluid under similar environmental conditions during the same period, and both contain significant amounts of germanium. Overall, deeper strata in the Irish mineral field may contain substantial copper-nickel-arsenic deposits, indicating high potential for finding such ores in areas with zinc-lead deposits, which also provides reference value for exploring copper deposits in other similar low-temperature zinc-lead mineral distribution areas globally.
Written by|Lu Tianlei
Edited by|Qi Yan
Citation|Max Frenzel, Markus Röhner, Nigel J. Cook et al. Mineralogy, mineral chemistry, and genesis of Cu-Ni-As-rich ores at Lisheen, Ireland[J]. MINERALIUM DEPOSITA, 2025, 60.
Note|Click the “QR code” at the end of the article to access the original materials
→This is the 188th article of “Mineral Research Prospects”
01
Full Interpretation
Low-temperature carbonate-type zinc-lead deposits support approximately 8% of global zinc production and 12% of lead production (ILZSG 2017; Frenzel et al., 2017), and are also significant sources of key by-products such as silver, cobalt, cadmium, gallium, and germanium (Leach et al., 1995, 2005; Paradis et al., 2007). These deposits typically have relatively simple mineral compositions, with sphalerite and galena as the main ore minerals, and carbonates, quartz, fluorite, and pyrite as gangue minerals (Leach et al., 2005). However, some special deposits—such as the Viburnum Trend in the USA, the Central Irish mineral field, Kipushi in the Democratic Republic of the Congo, and Tsumeb in Namibia—contain copper-rich (± nickel, cobalt, arsenic) ores, whose mineral assemblages and geochemical characteristics are complex, and the genesis has been debated for decades: some believe that the source area contains soluble copper-rich (-nickel, cobalt, arsenic) rocks (e.g., mafic – ultramafic rocks, Horrall et al., 1993), while others point to the mineralizing fluids having experienced high-temperature (>250°C) stages (Fusciardi et al., 2003; Wilkinson et al., 2005a; Torremans et al., 2018; Wilkinson, 2023).
The uniqueness of the Irish mineral field lies in its deposit composition covering a complete sequence from “copper-rich (-silver)” to “zinc-lead” (Ashton et al., 2023). For example, the Gortdrum and Tullacondra deposits contain almost only copper (-silver) ores; Tynagh is a mixed copper-zinc-lead ore; Lisheen and Silvermines are primarily zinc-lead but have core zones containing small amounts of copper-rich ores; the giant Navan deposit contains almost no copper ores, being pure zinc-lead. In the past, the academic community has thoroughly studied the mineralization mechanisms of zinc-lead ores (Wilkinson and Hitzman, 2015; Ashton et al., 2023; Wilkinson, 2023), but the geological significance of copper-rich deposits has long been ambiguous—the last systematic description of such mineralization was in the 1980s (Romer, 1986; Steed, 1986), and the data on mineralogy, symbiotic relationships, and formation conditions in the public literature are scattered and even contradictory.
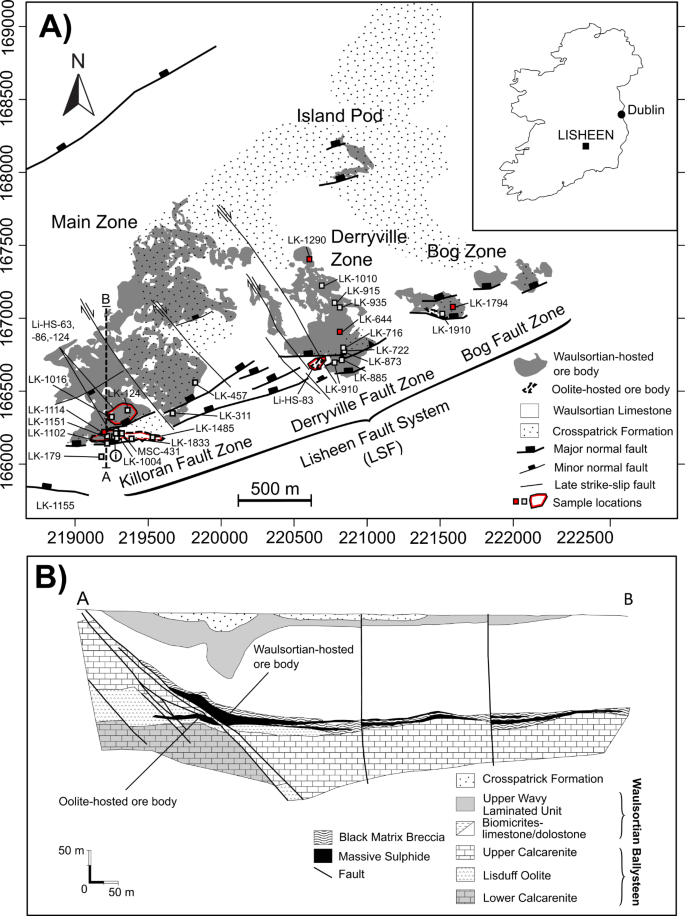
Lisheen was once the second-largest zinc-lead deposit in the Irish mineral field, with a resource amount of 23 million tons (zinc 13%, lead 2.3%, silver 26 g/t, Güven et al., 2023), mined from 1999 to 2015. Its structure is controlled by the Lisheen fault system, with the ore body extending north along the base of the Waulsortian limestone, partially dipping into the Ballysteen formation (Fig.1). The mineralization age is nearly synchronous with the sedimentation age of the surrounding rocks (approximately 348-350 million years ago) (Hnatyshin et al., 2015, 2020; Koch et al., 2022), and the ores and carbonates commonly exhibit syngenetic brecciation (Wilkinson et al., 2011; Güven et al., 2023), with the mineralization mechanism believed to be a mix of “metal-rich brine and shallow sulfur-rich fluids” (Wilkinson and Hitzman, 2015; Ashton et al., 2023).
However, the copper-nickel-arsenic ore bodies in the core zone of Lisheen have never been systematically analyzed: What is the mineral assemblage of these ore bodies? Is it related to the formation time and fluid source of the zinc-lead ores? How are key by-products (such as germanium and gallium) hosted within them? These questions are the core breakthroughs of this study.
The research team conducted the first detailed mineralogical and symbiotic sequence analysis of the copper-nickel-arsenic ores at Lisheen, using techniques such as laser ablation-inductively coupled plasma mass spectrometry (LA-ICP-MS) to analyze the trace element characteristics of the main sulfides. The results overturn traditional understandings:
1. Mineral symbiosis and time sequence: The mineral formation sequence of copper-nickel-arsenic ores highly overlaps with that of zinc-lead ores, with no significant time difference—indicating that the two types of mineralization “formed simultaneously”.
2. Similar physicochemical conditions: By inverting the trace elements of minerals (such as sulfur isotopes and metal partitioning), the parameters of the mineralizing fluids (temperature, salinity, redox state) for both types of mineralization are consistent—proving a “common fluid source”.
3. Universality of by-product enrichment: High germanium content was detected in both zinc-lead and copper ores, suggesting that the enrichment of key elements (germanium, gallium, etc.) is not unique to a certain type of mineralization, but rather a common feature of the mineralizing system.
These findings not only resolve the genesis controversy of the Irish mineral field but also provoke thoughts in two major directions:
– Regional exploration potential: In most large zinc-lead mines in the Irish mineral field, the “scarcity” of copper-nickel-arsenic ores does not match the theoretically “expected content” of mineralizing fluids. Combining the geological characteristics of copper-rich deposits like Gortdrum, the study speculates:There may be a large number of undiscovered copper-rich ore bodies in the deep parts of the mineral field (e.g., Old Red Sandstone strata)—this provides a theoretical basis for “deep exploration” in similar mineral fields in Ireland and globally.
- The global “by-product value” reassessment of mineral deposits: The enrichment of germanium and gallium in copper-rich ores in deposits like Lisheen (e.g., minerals like germanite, renierite) proves that low-temperature carbonate-type zinc-lead deposits may be “hidden treasures” for key strategic elements—this has resource-level implications for the supply pattern of scarce elements (such as germanium for fiber optics, gallium for semiconductors) in the global energy transition.
It fills the decades-long research gap on “copper-nickel-arsenic mineralization” in the Irish mineral field, linking the genesis chain of “zinc-lead-copper” mineralization with empirical data; the proposed “deep copper ore potential” provides new ideas for upgrading exploration in traditional mineral fields; and the excavation of by-product resources resonates with the global urgent demand for sustainable supply of strategic elements. More importantly, the research extends the experience of the Irish mineral field globally—are there also undiscovered copper ore bodies in other low-temperature carbonate-type zinc-lead mineral clusters? This study provides a replicable methodology and theoretical framework for mineralization analysis and resource exploration in similar regions.
From addressing the “shortcomings” of basic research to expanding the “boundaries” at the application level, the value of this article spans multiple dimensions of mineral deposit science, resource exploration, and strategic element supply. For geologists, exploration practitioners, and decision-makers concerned with resource security, it offers not just a set of data or conclusions, but a new perspective for re-understanding the potential value of “classic deposits”.
02
Table of Contents Highlights
1IntroductionPART ONE
- Detailed introduction to the background of the article
2Materials and methodsPART TWO
- Explanation of the materials and methods for observing the deposits
3ResultsPART THREE
- Presentation of the results of the mineralization symbiosis and co-genesis characteristics
4DiscussionPART FOUR
- Discussion of the significance of co-genesis and distribution of mineralization
5ConclusionsPART FIVE
- Summary of the full content of the article
03
HIGHLIGHT Images
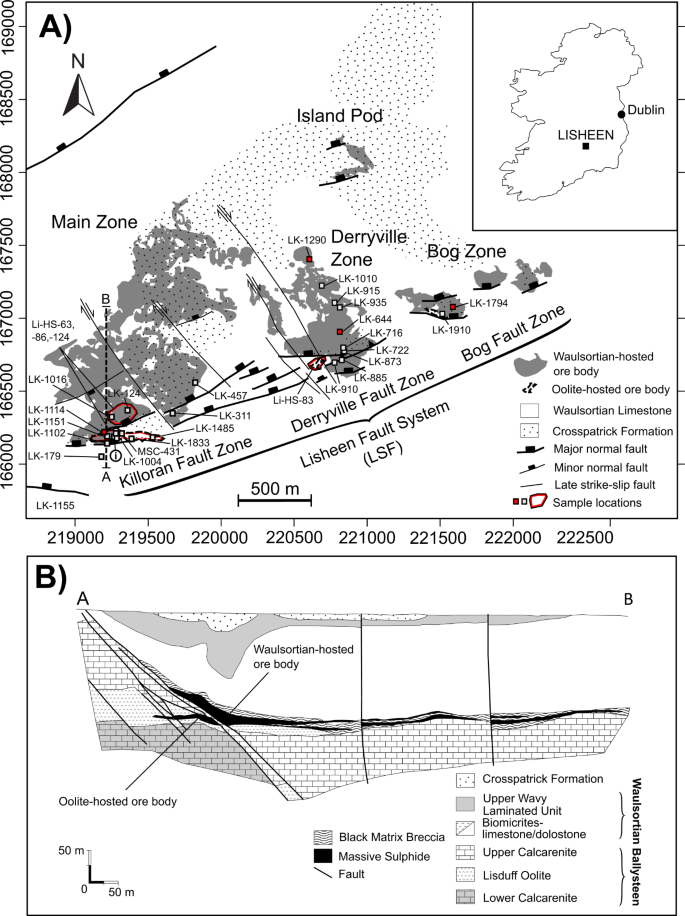
Geological overview of the Lisheen deposit. A) Surface projections of the ore bodies and controlling structural features. Drill core samples used in this study are marked by squares and labelled with the drill core ID. For reasons of clarity, the locations of cores LK-985, LK-1145, and LK-1155 in the southern part of the Main Zone are collectively labelled with “i” in a circle. Hand specimen samples (Li-HS-x) were collected from surface and underground stock piles of the indicated lenses of Cu-rich ores, with selected samples indicated in the map. Samples from locations highlighted in red were analysed by LA-ICP-MS. B) N-S cross section through the Main Zone ore body. Map in A) after Riegler and McClenaghan (2017); cross section in B) after Shearley et al. (1996). Coordinates refer to Irish National Grid
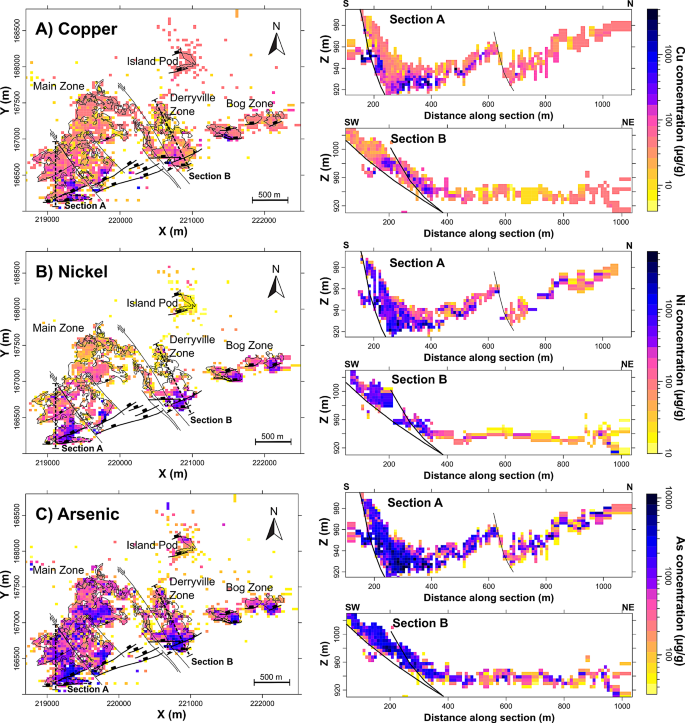
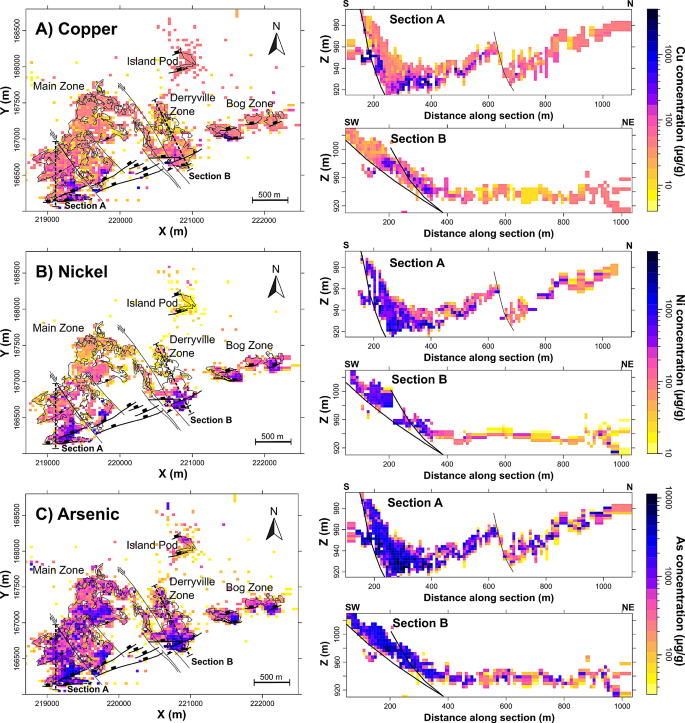
Chemical zonation of the Lisheen deposit with respect to A) Cu, B) Ni and C) As. Surface projections (left) were compiled by taking the geometric means of drill core analyses containing more than 1 wt% total sulfide on an xy-grid with a 40 × 40 m bin size. This was done to provide indications of the spatial distributions of typical ore compositions rather than tonnages (as in Torremans et al. 2018). Individual samples were not weighted by length or density. Cross sections (right) show similar geometric mean values from drill core samples within a maximum vertical distance of 20 m from either side of the section plane on a similar-sized grid. The raw data for these plots was taken from the Lisheen Mine Data Release (Irish Government 2019). Corresponding maps for Fe, Pb and Zn are shown in Fig. A1 in the electronic supplementary material (ESM Appendix A)
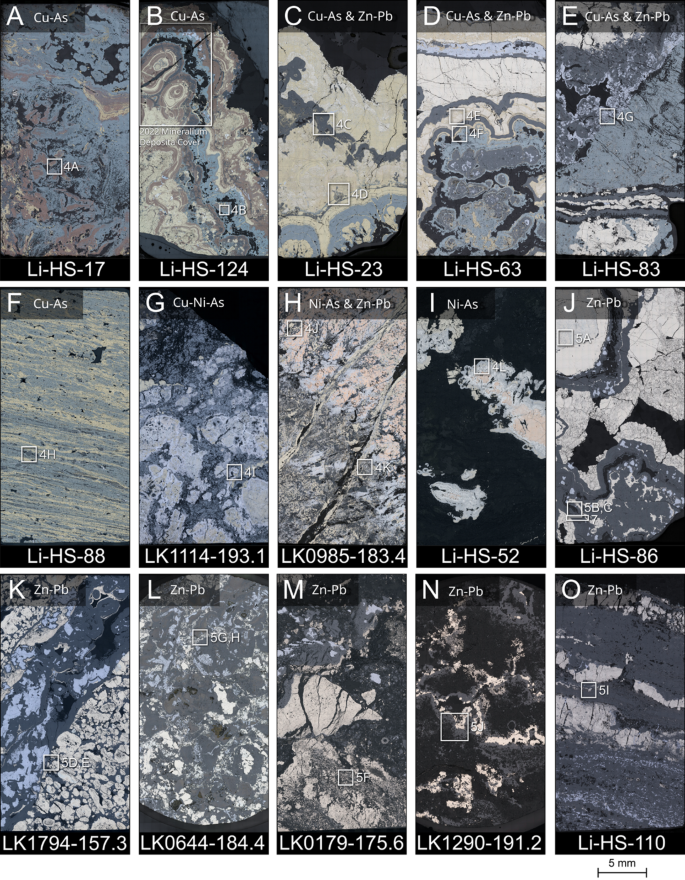
Microscope scans of selected polished ore sections (plane-polarised reflected light) with locations of more detailed micrographs in Figs. 4, 5, and 6 indicated by the square frames: A) Cu-rich sample containing mostly tennantite, bornite, and chalcopyrite. The transparent mineral (in black) is mostly barite. B) Cu-rich sample from Main Zone (South / Oolite), containing abundant colloform chalcopyrite, bornite, and tennantite, with some sphalerite, pyrite, and galena. The transparent mineral is again barite. C) Cu-rich sample with mostly chalcopyrite and tennantite, in addition to colloform sphalerite and pyrite. The transparent minerals are early barite (bottom) and late calcite (top). D) Sample similar to C) from Main Zone (South / Oolite), again with early barite (bottom) and late calcite (top). E) Cu-rich sample from the Derryville Zone (Oolite), containing tennantite, pyrite-marcasite, sphalerite, and galena as the only sulfide minerals. The transparent gangue minerals are mostly dolomite and calcite. F) Plastically deformed Cu-rich sample from the Derryville Zone (Oolite) consisting mostly of chalcopyrite and tennantite. G) Nickel-rich sample from the Main Zone (South) containing abundant gersdorffite and (para)rammelsbergite, in addition to tennantite, chalcopyrite, and minor sphalerite, pyrite, and galena. H) Nickel-rich sample from the Main Zone (Oolite) containing abundant early nickeline (upper right) with later sphalerite, pyrite, and galena (bottom left). The transparent minerals are mostly barite and carbonates. I) Nickel-rich sample containing mostly nickeline, gersdorffite, (para-)rammelsbergite, and minor millerite, with some barite in a carbonate matrix. J) Zn-Pb rich sample from the Main Zone (South / Oolite), containing mostly colloform sphalerite, pyrite, and crystalline galena. The transparent mineral is mostly calcite. K) Zn-Pb-rich sample from the Bog Zone, consisting mostly of colloform sphalerite, pyrite, and crystalline galena, with carbonate gangue. L) Highly brecciated Zn-Pb-rich sample from the Derryville Zone (Central) consisting mostly of fragments of intergrown colloform sphalerite, euhedral to dendritic galena, and pyrite. M) Zn-Pb-rich sample from the Main Zone (Oolite) containing abundant early iron sulfides and showing signs of syn- to post-mineral brecciation. N) Zn-Pb-rich sample from the Derryville Zone (North) showing sulfides as cements and clast-replacements in dolomite breccia. O) Plastically deformed Zn-Pb-rich sample from the Derryville Zone (South). Note that sample Li-HS-124 (panel B) was featured on the 2022 Mineralium Deposita magazine cover as indicated
Selected micrographs showing details of the Cu-Ni-As-rich samples presented in Fig. 3. A) Detail of sample Li-HS-17 showing some evidence of fragmentation of earlier colloform bornite-chalcopyrite-tennantite intergrowths, rimmed and cemented by tennantite and barite. B) Detail of colloform-layered intergrowths of bornite and tennantite in sample Li-HS-124. C) Colloform sphalerite with interbands rich in chalcopyrite inclusions on sample Li-HS-23. D) Arboriform sphalerite growth interspersed with colloform-layered chalcopyrite and tennantite (sample Li-HS-23). E) Fractured colloform to columnar pyrite partially replaced by chalcopyrite with minor galena in sample Li-HS-63. F) Colloform-layered intergrowths of tennantite, sphalerite, chalcopyrite, and gersdorffite, associated with bunches of lath-like barite crystals in sample Li-HS-63. G) Tennantite replacing colloform sphalerite intergrown with dendritic to colloform galena. H) Sphalerite ‘porphyroblasts’ with calcite-filled strain shadows in plastically deformed matrix of chalcopyrite and tennantite (sample Li-HS-88). I) Fragments of early pyrite and sphalerite overgrown by colloform gersdorffite, with later infill of tennantite, chalcopyrite, and barite (sample LK1114-193.1). J) Earlier dendritic gersdorffite / (para-)rammelsbergite overgrown by colloform nickeline, followed by colloform sphalerite and coarse pyrite (sample LK0985-183.4). K) Acicular to dendritic growth of gersdorffite/(para)rammelsbergite and sphalerite overgrown by later sphalerite and galena (sample LK0985-183.4). L) Detail of successive colloform growths of nickeline, (para-)rammelsbergite, and gersdorffite + millerite + pyrite (sample Li-HS-52). Mineral symbols after Warr (2021)
Selected micrographs showing details of the Zn-Pb-rich samples presented in Fig. 3. A) Intergrowths of early columnar pyrite-marcasite in sample Li-HS-86. B) Colloform sphalerite with interlayers of calcite and associated galena overgrowing earlier pyrite and crystalline sphalerite (sample Li-HS-86). C) Dark-field image of the same area shown in B). D) Early pyrite clasts with dolomite inclusions at their centre cemented by a darker sphalerite generation (Sp I), and subsequently fractured and recemented by a lighter colloform sphalerite (Sp II) and galena plus carbonates (sample LK1794-257.3). E) Dark-field image of the same area shown in D). F) Various fossil fragments replaced by early pyrite, overgrown by later sphalerite (sample LK0179-175.6). G) Breccia clasts of colloform sphalerite associated with acicular galena, as well as pyrite in matrix of mostly finely fractured sulfide fragments (sample LK0644-184.4). H) Same as G) but in darkfield illumination. I) Pyrite clast in plastically deformed matrix of mostly sphalerite. J) Detail of sphalerite replacement of a clast of dolomitized limestone in sample LK1290-191.2. Sphalerite is then overgrown by pyrite. K) Sedimentary sphalerite infill in a cavity, covering earlier galena and pyrite grains. L) Darkfield image of same area as in K). Mineral symbols after Warr (2021)
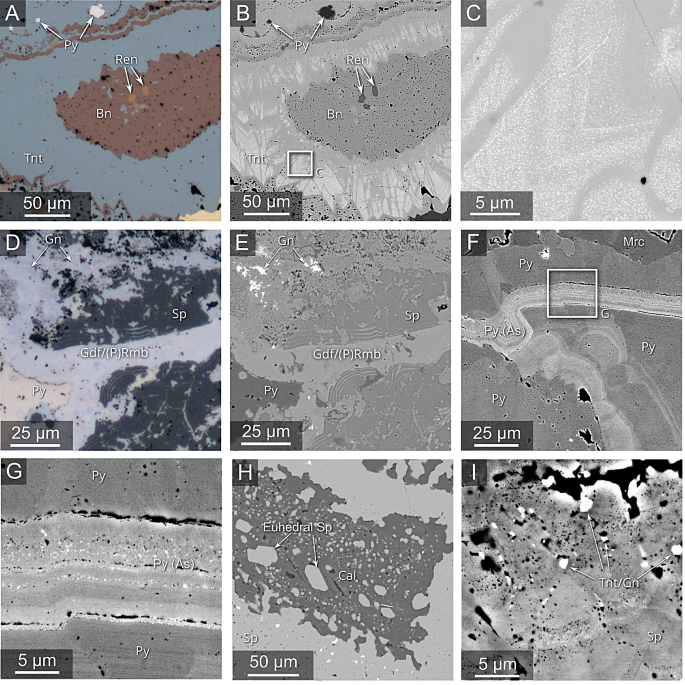
Selected higher-resolution optical and back-scattered electron (BSE) images of some samples. A) Reflected light image of bornite with renierite inclusions in sample Li-HS-124, overgrown by tennantite crystals. B) Same as A) but BSE image. C) Detail of B) showing exsolved nano-inclusions of a Ag-rich phase in tennantite. D) Reflected light image of intimately associated sphalerite and gersdorffite/(para-)rammelsbergite in sample LK0985-183.4. E) Same as D) but BSE image. F) BSE image of an As-rich growth zone in pyrite in sample Li-HS-86. G) Detail of F) showing nano-scale inclusions of galena and other phases. H) BSE image of calcite containing euhedral sphalerite grains, intergrown with colloform sphalerite in sample Li-HS-86. I) High-resolution BSE image showing nanoscale porosity, mineral inclusions, and compositional zoning in colloform sphalerite from sample Li-HS-86
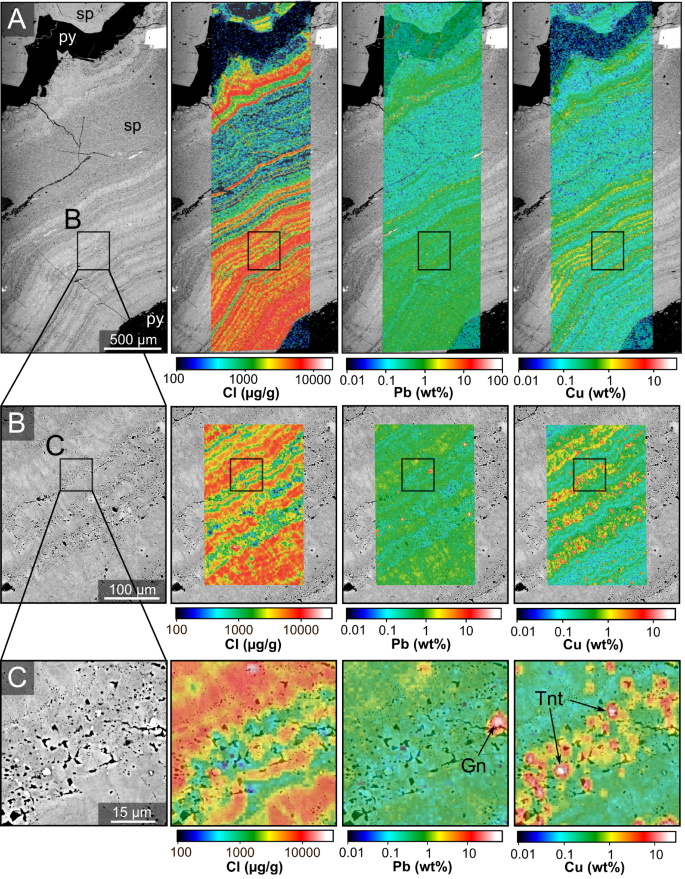
Back-scattered electron (BSE) images and electron microprobe trace-element distribution maps for colloform sphalerite in sample Li-HS-86 (Sp II, cf. Figure A5 in ESM) modified from Frenzel et al. (2020) to show the distribution of Cl (as a largely lattice-hosted element), and Pb and Cu (as inclusion-hosted elements) at different scales. A) Coarse map recorded with a step size of 10 μm; B) and C) high-resolution maps recorded with a step size of 1 μm. Inclusions of galena and tennantite are clearly visible in both the BSE images and elemental maps in C), as are abundant nanopores and the columnar growth of individual sphalerite crystals in the BSE images in B) and C)
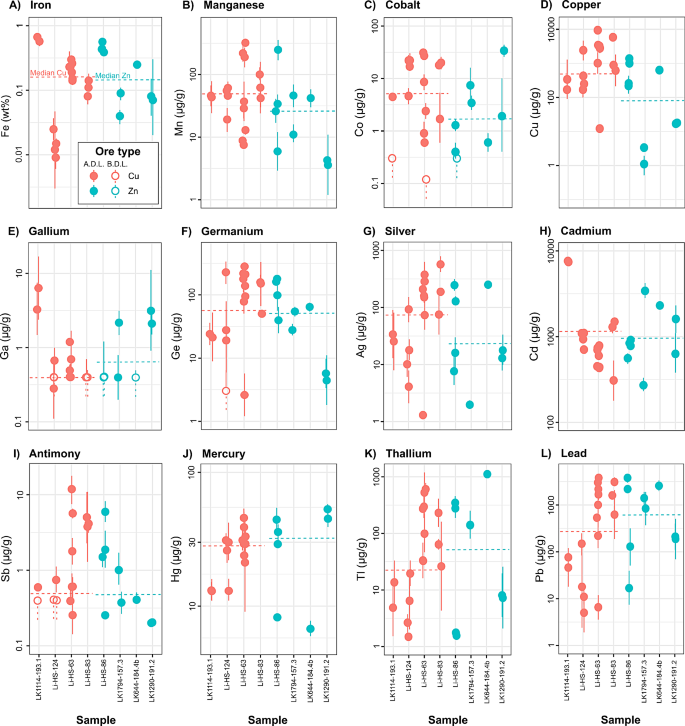
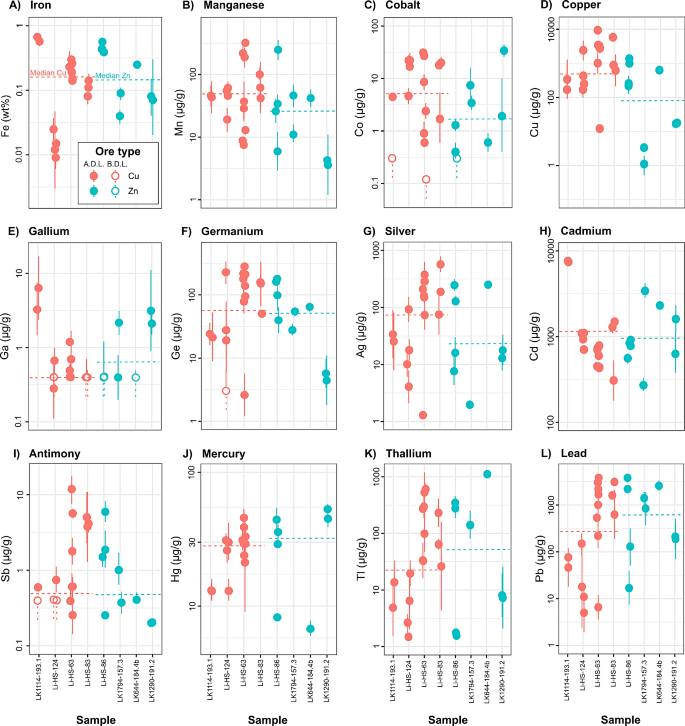
Summary of sphalerite trace-element data, showing geometric means for individual mineral generations in the investigated samples, in addition to the corresponding 95% confidence intervals. The overall medians indicated by the horizontal broken lines for the sphalerites from Cu-rich and Zn-rich samples represent the medians of medians of the generation means per sample: A) Iron, B) manganese, C) cobalt, D) copper, E) gallium, F) germanium, G) silver, H) cadmium, I) antimony, J) mercury, K) thallium, L) lead. See Table 3 and ESM Appendix B for further details. A.D.L. – above detection limit; B.D.L. – below detection limit

Temporal variations of estimated GGIMFis temperatures (only best estimates) and selected trace-element concentrations in the different sphalerite generations of sample Li-HS-63. Where no clear ordering of the measurement points was possible, the median (black circle) and min-max ranges (whiskers) are shown instead of the line trace. Selected other mineral generations are labelled in accordance with ESM Fig. A5
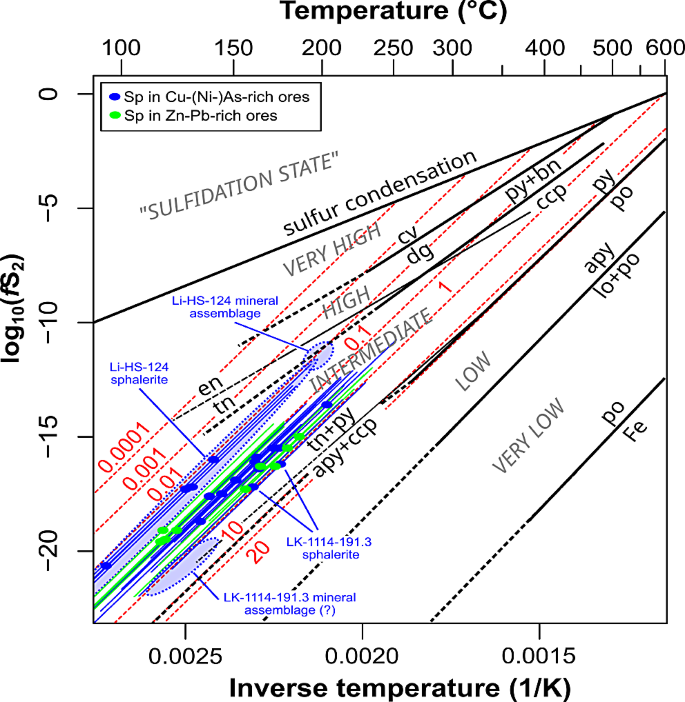
Sulfur fugacity-inverse temperature plot adapted from Frenzel et al. (2022) and Einaudi et al. (2003) showing the locations of the different sphalerite generations from Lisheen relative to different mineral reactions (black lines) and isolines describing the variation of Fe contents (in mol% FeS) in sphalerite (red lines; buffered by pyrite) according to the model presented in Frenzel et al. (2022). In addition to estimates from sphalerite, tentative estimates from mineral assemblages in samples Li-HS-124 (py-bn-ccp) and LK-1114-191.3 (tn-py-apy-ccp) are included. These must however be treated with caution, since the minerals involved are not necessarily in equilibrium in these samples. Mineral abbreviations after Warr (2021)
Revised paragenesis diagram for the Lisheen deposit based on Torremans et al. (2018) with modifications reflecting the observations made in this study. These modifications concern particularly the subsummation of arsenopyrite into the Gersdorffite, Rammelsbergite, Nickeline etc. category (renamed from cobaltite-niccolite to reflect the relative absence of cobaltite), the removal of tetrahedrite since none occurs in the deposit, and the introduction of bornite. Timings of the Cu-Ni-As minerals (highlighted in red) were also changed to reflect our new petrographic observations
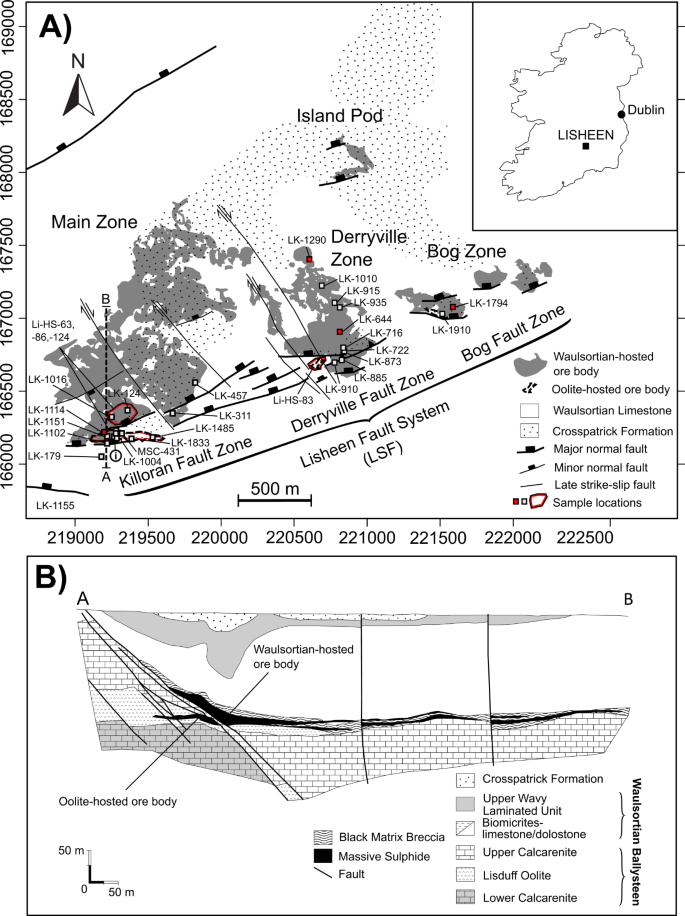
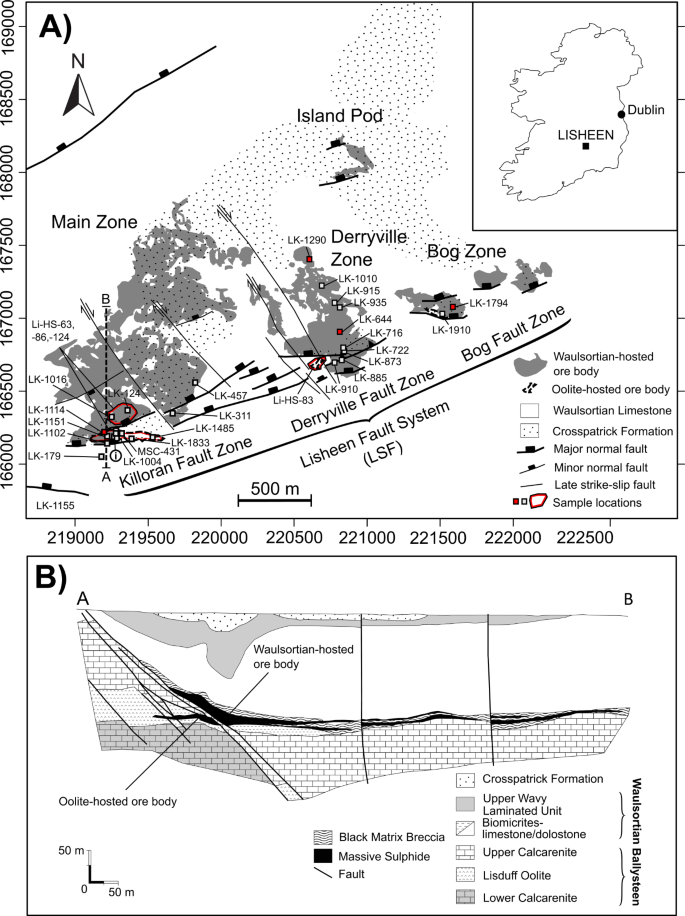
Geological overview of the Lisheen deposit. A) Surface projections of the ore bodies and controlling structural features. Drill core samples used in this study are marked by squares and labelled with the drill core ID. For reasons of clarity, the locations of cores LK-985, LK-1145, and LK-1155 in the southern part of the Main Zone are collectively labelled with “i” in a circle. Hand specimen samples (Li-HS-x) were collected from surface and underground stock piles of the indicated lenses of Cu-rich ores, with selected samples indicated in the map. Samples from locations highlighted in red were analysed by LA-ICP-MS. B) N-S cross section through the Main Zone ore body. Map in A) after Riegler and McClenaghan (2017); cross section in B) after Shearley et al. (1996). Coordinates refer to Irish National Grid
Chemical zonation of the Lisheen deposit with respect to A) Cu, B) Ni and C) As. Surface projections (left) were compiled by taking the geometric means of drill core analyses containing more than 1 wt% total sulfide on an xy-grid with a 40 × 40 m bin size. This was done to provide indications of the spatial distributions of typical ore compositions rather than tonnages (as in Torremans et al. 2018). Individual samples were not weighted by length or density. Cross sections (right) show similar geometric mean values from drill core samples within a maximum vertical distance of 20 m from either side of the section plane on a similar-sized grid. The raw data for these plots was taken from the Lisheen Mine Data Release (Irish Government 2019). Corresponding maps for Fe, Pb and Zn are shown in Fig. A1 in the electronic supplementary material (ESM Appendix A)
Disclaimer: This article is for academic exchange and dissemination only
ENDClick the QR code below to join the industry group

 Click the QR code below to access the original materials

Previous Recommendations
The Mystery of Sphalerite Genesis? Analysis of Mineralization Zones Controlled by Ancient Groundwater Levels
Citation: Zhuang et al. Nonsulfide Zn–Pb mineralization and vertical zoning in the world-class Angouran deposit, NW Iran: linked to water table-controlled supergene processes[J]. MINERALIUM DEPOSITA, (1432-1866).
Click to read
Are Porphyry-Subsurface Hydrothermal Deposits Related? Chronological Constraints of the Bangpu Polymetallic System
Citation: Zuo et al. Geology and geochronology of the Bangpu porphyry‒skarn‒epithermal Mo‒Cu‒Zn‒Pb‒Ag deposit in the Gangdese metallogenic belt, Tibet[J]. MINERALIUM DEPOSITA, (1432-1866).
Click to read
How Do Magmatic-Hydrothermal Fluids Drive Tin Precipitation? Boron Isotope Tracing of Mineral Fluid Mixing Mechanisms
Citation: Yang et al. Constraints of in-situ elemental and B isotopic compositions of tourmaline on the origin of the Nong Sua Sn deposit, Thailand[J]. MINERALIUM DEPOSITA, (1432-1866).
Click to read
How Does Helium Exploration Solve Resource Bottlenecks? Enrichment Patterns and Favorable Area Predictions
Citation: Xiong et al. Current Status of Helium Resource Research and Prediction of Favorable Areas for Helium Reservoir in China[J]. ENERGIES, 2024, 17 1530.
Click to read
Why Are Subduction Zones Enriched in Helium? Analysis of the 1200 km Helium Belt in the Tibetan Plateau
Citation: Yinleihao et al. Discovery and genesis of helium-rich geothermal fluids along the India–Asia continental convergent margin[J]. GEOCHIMICA ET COSMOCHIMICA ACTA, 2023, 360.
Click to read
How Do Helium-Rich Geothermal Fields Form? Mechanisms and Exploration Indicators of Cretaceous Granite
Citation: Li et al. Multi-isotopes (H, O, Sr, and Li) and element geochemistry constrain the formation of Kongchutso helium-rich geothermal field in western Tibet, China[J]. GEOTHERMICS, 2024, 120.
Click to read
How Is Natural Hydrogen Stored Underground? Decoding the Fracture Density of the Mali Blak Field
Citation: Maiga et al. Trapping processes of large volumes of natural hydrogen in the subsurface: The emblematic case of the Bourakebougou H2 field in Mali[J]. INTERNATIONAL JOURNAL OF HYDROGEN ENERGY, 2024,50.
Click to read
How to Explore Natural Hydrogen in the Songliao Basin? Pore Structure Dominates Hydrogen Absorption Mechanisms
Citation: Wang et al. The occurrence pattern of natural hydrogen in the Songliao Basin, P.R. China: Insights on natural hydrogen exploration[J]. INTERNATIONAL JOURNAL OF HYDROGEN ENERGY, 2024,.
Click to read
What Are the Opportunities and Challenges in Deep Hydrogeological Research?
Click to read
What Is the Contribution of Magmatic Activity to Hydrothermal Deposit Formation?
Click to read
What Research Methods Are Used for the Three-Dimensional Geothermal Geological Model in Xiong’an New Area?
Click to read
Geothermal Geological Conditions and Resource Formation Factors in the South China Sea Basin
Click to read
How Does Magnetotelluric Depth Sounding Reveal the Characteristics of Deep Thermal Reservoirs in the Jizhong Depression?
Click to read