(By Richard Anslow, Senior Manager; Danail Baylov, Senior Engineer)
Abstract
There are various methods to enhance the intelligence of industrial systems, including the application of edge and cloud-based artificial intelligence (AI) technologies to sensors equipped with analog and digital devices. Given the diversity of AI approaches, sensor designers must consider several conflicting requirements, including decision latency, network usage, power consumption/battery life, and suitable AI models for machines. This series of articles focuses on the design of intelligent AI wireless motor monitoring sensors and addresses key questions such as: How does edge AI extend the battery life of sensors? What improvements are there in the system’s insights and decision-making capabilities? The sensors discussed in this article utilize edge AI algorithms to detect abnormal motor behavior, triggering machine diagnostics and maintenance, ultimately extending the motor’s lifespan.
Motor Health Monitoring
Condition-based monitoring (CbM) implemented on robots and rotating machinery (such as turbines, fans, pumps, and motors) records real-time data related to the health and performance of machines, enabling targeted predictive maintenance and optimized control. Conducting targeted predictive maintenance early in the machine’s lifecycle can reduce the risk of production downtime, thereby improving reliability, significantly saving costs, and enhancing factory productivity. To implement condition-based monitoring on industrial machines, a range of sensor data can be utilized, including electrical measurements, vibration, temperature, oil quality, acoustics, magnetic, and process measurements (such as flow and pressure). However, vibration measurement is currently the most common method, as it can reliably indicate mechanical issues such as imbalance and bearing faults. This article will introduce the Voyager4 evaluation kit (EV-CBM-VOYAGER4-1Z), a robust low-power wireless vibration monitoring platform that enables designers to quickly deploy wireless solutions to machines or test setups. The Voyager4 sensor utilizes edge AI algorithms to detect abnormal motor behavior, triggering machine diagnostics and maintenance, ultimately extending the motor’s lifespan. This article is the first part of a three-part series introducing the Voyager4 sensor. The sensor serves as a reference example to help developers accelerate the design of intelligent systems and understand the various trade-offs that need to be considered during the design process.
• The first part of this series will introduce the Voyager4 wireless condition monitoring sensor, including key elements of the sensor architecture, hardware design, power consumption analysis, and mechanical integration.
• The second part of this series will focus on the software architecture and AI algorithms, detailing a complete system-level approach to developing and deploying AI models on the Voyager4.
• The third part of this series will discuss the practical implementation of AI algorithms and the various faults that the Voyager4 can detect, such as imbalance, misalignment, and bearing defects.
Typical Operating Modes of Wireless Vibration Sensors
Currently available wireless industrial sensors typically operate at a very low duty cycle. Users set the sleep duration for the sensors, which periodically wake up to measure temperature and vibration, then wirelessly transmit the data back to the user’s data server. Commercial sensors often claim a battery life of 5 years, based on capturing data once every 24 hours or multiple times within that period. See Figure 1.
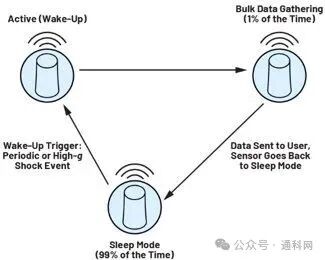
Figure 1. Typical operation of industrial wireless sensors
In most cases, sensors spend over 90% of their time in sleep mode. The Voyager4 sensor operates similarly but utilizes edge AI anomaly detection (using the MAX78000 AI microcontroller) to limit radio usage. When the sensor wakes up and measures data, it only transmits data back to the user if the microcontroller detects anomalies in the data. With edge AI, battery life can be extended by at least 50% (see the “Hardware System and Power Consumption Analysis” section).
How the Voyager4 Sensor System Works
The operation of the Voyager4 sensor is illustrated in Figure 2. The ADXL382 three-axis 8 kHz digital micro-electromechanical system (MEMS) is used to collect vibration data. First, the raw vibration data travels along path A to the MAX32666 low-power Bluetooth® (BLE) processor. The data can be sent to the user via wireless BLE or USB. Using the MAX78000 tool, this raw vibration data is used to train the edge AI algorithms.
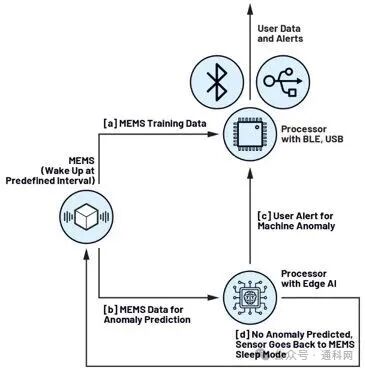
Figure 2. How the Voyager4 sensor works
The AI model is synthesized into C code using the MAX78000 tool. The edge AI algorithm is sent to the Voyager4 sensor via BLE wireless (OTA) updates and stored in memory using the MAX78000 processor equipped with an edge AI hardware accelerator. After the initial training phase of the Voyager4, ADXL382 MEMS data can follow path B as shown in Figure 2. The MAX78000 edge AI algorithm will predict whether the machine is operating normally based on the collected vibration data. If the vibration data is normal, there is no need to utilize the radio functionality of the MAX32666. The Voyager4 sensor operates along path D as shown in Figure 2, returning the MEMS to sleep mode. However, if the algorithm predicts anomalies in the vibration data, it operates along path C and sends a vibration anomaly alert to the user via BLE. The details of this edge AI implementation will be explained in the second part of this series.
Hardware System and Power Consumption Analysis
Figure 3 provides an overview of the Voyager4 hardware system. The ADXL382 is a low-noise density, low-power, three-axis MEMS accelerometer with selectable measurement ranges. This device supports ±15 g, ±30 g, and ±60 g ranges with an 8 kHz wide measurement bandwidth. The ADG1634 single-pole double-throw (SPDT) CMOS switch is used to transmit the raw vibration data from the MEMS to the MAX32666’s wireless BLE or MAX78000 AI microcontroller. The BLE microcontroller is used to control the SPDT switch. Several other peripherals are connected to the MAX32666, including the MAX17262 battery monitor for monitoring battery current and the ultra-low-power ADXL367 MEMS accelerometer. The ADXL367 is used to wake the wireless BLE from deep sleep mode during high vibration impact events. In motion-activated wake mode, it consumes only 180 nA of current. The BLE microcontroller can transmit the raw data from the ADXL382 MEMS to the host via BLE or USB using the FTDI FT234XD-R.
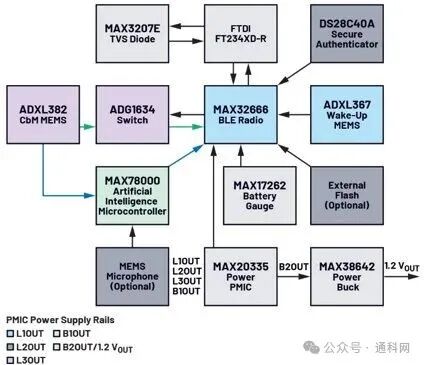
Figure 3. Voyager4 hardware system
The Voyager4 sensor utilizes the MAX20335 power management integrated circuit (PMIC), as shown in Figures 3 and 4. This PMIC features two ultra-low quiescent current buck regulators and three ultra-low quiescent current low-dropout (LDO) linear regulators. Each LDO and buck regulator’s output voltage can be individually enabled and disabled, and each output voltage value can be programmed via I2C (default values pre-configured). The BLE processor is used to enable or disable the various PMIC power outputs for different operating modes of the Voyager4.
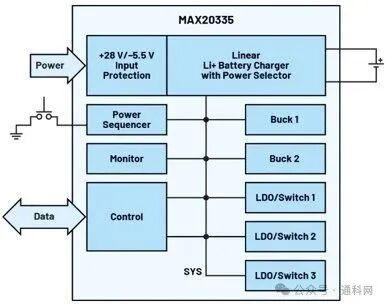
Figure 4. MAX20335 PMIC
Table 1 details the different operating modes of the Voyager4 sensor.
Table 1. Operating modes of the Voyager4 sensor and corresponding MAX20335 PMIC power configurations
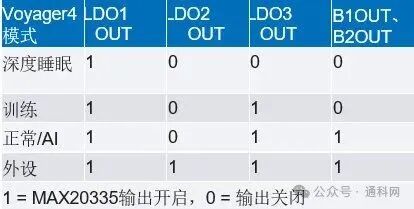
Table 2 details the activation of various features of the MAX32666 and MAX78000 in active or disabled modes. For example, in training mode, the BLE microcontroller must first broadcast its presence in the BLE network and then establish a BLE connection with the network server. The Voyager4 then transmits the raw data from the ADXL382 MEMS over the BLE network to train the AI algorithm on the user’s PC.
Table 2. Voyager4 BLE, AI, and deep sleep modes
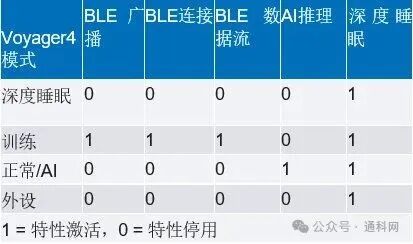
The Voyager4 sensor then returns to deep sleep mode. In normal (AI) mode, the broadcasting, connection, and streaming features of the wireless BLE are disabled by default. Every certain period, the MAX78000 wakes up and runs AI inference. If no anomalies are detected, the Voyager4 returns to deep sleep mode.
The average power consumption of the Voyager4 evaluation kit is measured based on its event interval times in deep sleep, training, and normal/AI modes. Figure 5 summarizes the average power consumption.
The Voyager4 evaluation kit (EV-CBM-VOYAGER4-1Z) includes several components for customer evaluation (LEDs, pull-up resistors). These components are powered by the LDO1OUT power rail, consuming 0.3 mW (in deep sleep mode), as shown in Figure 5.
When the evaluation kit operates in training mode, if the BLE is active, it consumes over 0.65 mW while broadcasting, connecting, and transmitting data once per hour. If the Voyager4 sensor operates in AI mode, even if the sensor is activated once per hour, the power consumption is only close to 0.3 mW.
Figure 5 shows that when the sensor does not need to transmit raw BLE data, its power consumption can be reduced by up to 50%.
At approximately 0.3 mW of power consumption, a 1500 mAh battery (such as TinyCircuits’ rechargeable ASR00073) can operate for up to two years; if using two standard AA 2.6 Ah LS14500 Saft batteries, it can operate for over 7 years. Saft’s LS 14500 batteries have low base current and periodic pulse characteristics, making them ideal for long-term applications (typically 5 to 20 years).
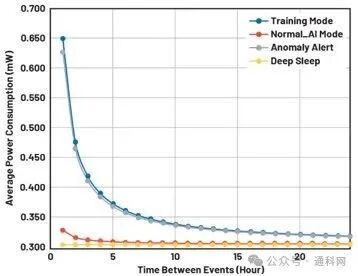
Figure 5. Relationship between average power consumption and event interval time
Mechanical Design of the Voyager4 Sensor
The Voyager4 sensor has a diameter of 46 mm and a minimum height of 77 mm. There is an M6 threaded hole on the base for mounting it to the motor housing via a screw or adhesive. Figure 6 shows an exploded view of the mechanical components, which includes an aluminum base and wall housing, with an ABS plastic cover to reduce the antenna shielding effect of BLE data transmission. The PCBs for the BLE and edge AI microcontroller are mounted vertically, with the battery secured in a bracket. The PCB for the MEMS sensor and power is placed on the base, close to the monitored vibration source.
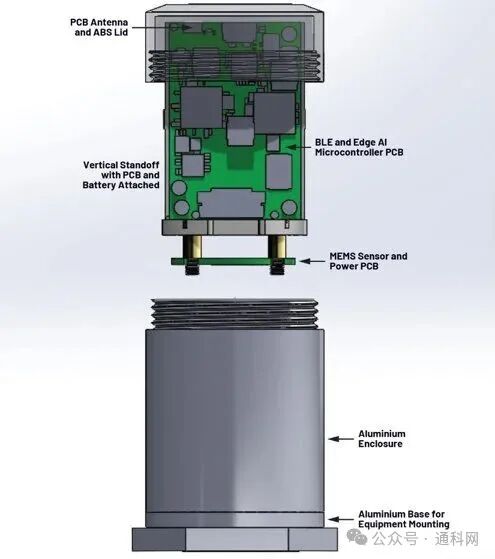
Figure 6. Voyager4 sensor housing, mechanical components.
Mechanical Modal Analysis
Designing a well-structured mechanical housing for the MEMS accelerometer is essential to ensure high-quality CbM vibration data is extracted from the measured object. Understanding modal analysis is a necessary condition for designing a good mechanical housing.
What is Modal Analysis and Why is it Important?
Modal analysis is used to understand the vibrational characteristics of structures. It can provide the natural frequencies and normal modes (relative to deformation) of the design. When using modal analysis, a key issue is to avoid resonance, where the natural frequency of the structural design is very close to the inherent frequency of the applied vibrational load. For vibration sensors, the natural frequency of the housing must be greater than the inherent frequency of the applied vibrational load measured by the MEMS sensor. The 3 dB bandwidth of the Voyager4 on the X, Y, and Z axes is 8 kHz. Below 8 kHz, the sensor housing should not exhibit significant resonance.
Natural Frequencies and Mode Shapes
ANSYS and other simulation tools provide modal analysis plugins that help designers explore the effects of geometry, material selection, and mechanical components on the frequency response of the sensor housing. The mass, stiffness, and natural frequency of the sensor housing are interrelated.
The equation 1 relates the mass matrix [M], stiffness matrix [K], angular frequency ωi, and mode shape {∅i} for calculations in FEM programs such as ANSYS. ωi divided by 2π can yield the natural frequency fi, and the mode shape {∅i} provides the relative deformation pattern of the material at a specific natural frequency.

For a single-degree-of-freedom system, the frequency can be simply expressed using equation 2.

Equation 2 provides a simple and intuitive design assessment method. If the height of the sensor housing is reduced, resulting in increased stiffness and decreased mass, the natural frequency will increase. Conversely, if the height of the housing is increased, stiffness decreases, mass increases, and the natural frequency decreases. Most designs have multiple degrees of freedom. Some designs have hundreds of degrees of freedom. Finite element methods can quickly yield results for equation 2, which would be very time-consuming if calculated manually.
Using simulation tools and equations 1 and 2, along with careful material selection, can ensure the design goals for frequency response are achieved. For more information, refer to the article “How to Use Modal Analysis to Design Excellent Vibration Sensor Housings,” which provides a comprehensive overview of modal analysis.
Mode Participation Factors
Mode participation factors (MPF) are used to determine which modes and natural frequencies are more important for the design. Equation 3 relates the mode shape {∅i}, mass matrix [M], and excitation direction vector D to solve for MPF. The square of the participation factor is the effective mass.

MPF and effective mass measure the mass that moves in each direction for each mode. A higher value in one direction indicates that the mode will be excited by a force (such as vibration) in that direction.
To complete the modal analysis, it is essential to understand that all points on the structure vibrate at the same frequency (global variable), but the amplitude of vibration (or mode shape) is different for each point. For example, an 18 kHz frequency has a greater impact on the top of the mechanical housing than on the bottom.
Voyager4 Modal Simulation and Laboratory Testing
The simulation of the Voyager4 sensor components used the following materials: the bottom and middle parts of the housing are made of 3003 aluminum alloy, and the cover is made of ABS-PC plastic.
The results of the modal analysis simulation are shown in Table 3, which obtained 14 mode results within the target frequency range. The MPFs in the X, Y, and Z directions are displayed in the table. The strongest modes are highlighted in blue. The simulation results are used to check the deformation locations of these relatively strong modes.
Table 3. Modal Analysis Simulation Results
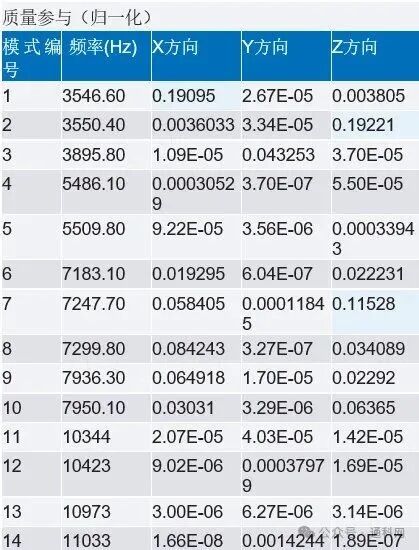
Modes 1 and 2 are similar and will affect the ABS-PC cover, as shown in Figure 7.
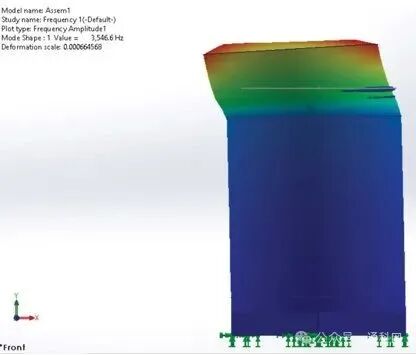
Figure 7. Mode 1, cover deformation, away from the rigid sensor base.
Based on the position of mode 1 being away from the base sensor PCB, this small resonance will not affect the performance of the ADXL382 MEMS.
Mode 7, highlighted in Table 3, occurs at approximately 7.25 kHz frequency on the Z (vertical) axis. Figure 8 shows its significant impact on the vertical walls of the housing. However, the base is not strongly affected by mode 7.
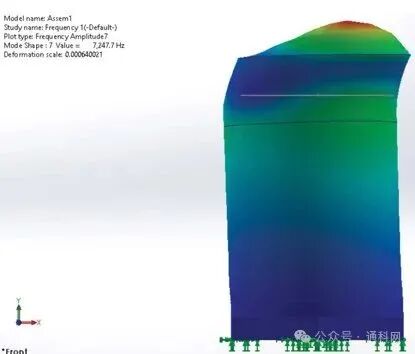
Figure 8. Mode 7, frequency of 7.25 kHz, has a significant impact on the aluminum walls of the housing.
This modal simulation indicates that no mode significantly affects the ADXL382 sensor PCB located on the base of the housing, and there is no significant mechanical resonance within the 8 kHz 3 dB bandwidth.
To validate the simulation results, we placed the Voyager4 sensor on a modal shaker, inputting vibrations at a constant 0.25 peak (g), with a frequency scan range from 0 kHz to 8 kHz. Within the maximum frequency range of 8 kHz, the frequency response of the Voyager4 sensor is within ±1.5 dB, as shown in Figure 9.
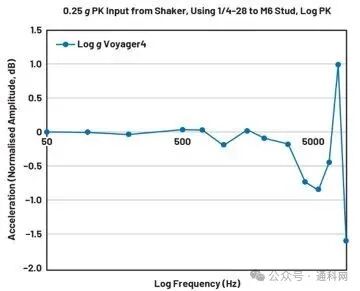
Figure 9. Frequency response of the Voyager4 sensor
Conclusion
Microcontrollers equipped with embedded AI hardware accelerators can enhance the decision-making capabilities of wireless sensor nodes and extend their battery life. With edge AI, battery life can be extended by at least 50%. Conducting modal analysis on vibration sensor housings can accelerate the sensor development cycle and ensure high-quality vibration data is obtained from the measured object.
Author Biographies
Richard Anslow is a Senior Manager in the Industrial Automation Division at ADI, engaged in software system design engineering. His areas of expertise include condition monitoring, motor control, and industrial communication design. He holds a Bachelor’s degree in Engineering and a Master’s degree in Engineering from the University of Limerick, Ireland. Recently, he completed a graduate program in Artificial Intelligence (AI) and Machine Learning (ML) at Purdue University, USA.
Danail Baylov is a Senior Systems Engineer in the Industrial Automation Division at ADI’s Limerick office, involved in system design and implementation as well as software development. He holds a Bachelor’s degree in Engineering and a Master’s degree in Engineering from Sofia Technical University. His areas of expertise include industrial wired/wireless communication, industrial Ethernet, and communication protocols.