First Work Showcase
First, I want to thank my aunt’s family for providing this platform, which serves as motivation for me. I have always wanted to create a temperature control device, but due to my busy work schedule and becoming a new dad (actually, it’s more about my laziness and procrastination), I lacked the motivation to start. Fortunately, my aunt’s family organized an event. Seeing the event introduction brought back memories of participating in the national electronics competition.
Tired, but we are relentless; frustrated, but we persist. The joy of success always makes us ecstatic! Long time no see! It seems like it’s time for everyone to get back to work!  No more excuses! Let’s get started! First is the project concept, as shown in the block diagram below:
 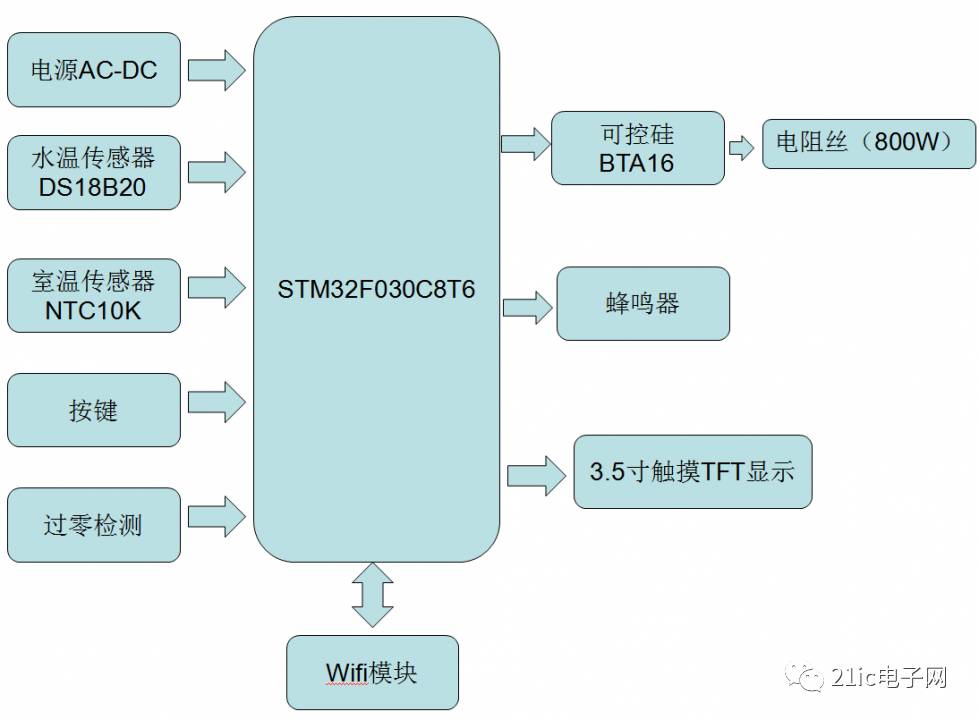 Based on this block diagram, I first laid out the schematic and PCB, planning to send it out for sampling, which is convenient and fast, haha~
Below are screenshots of the schematic 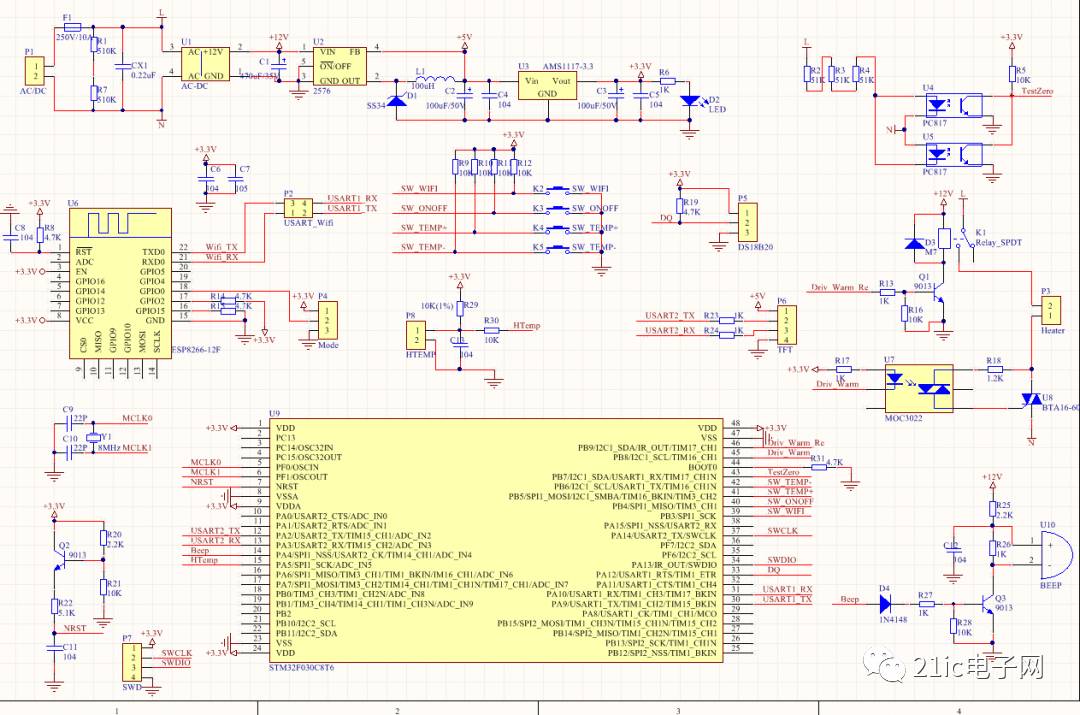 and PCB
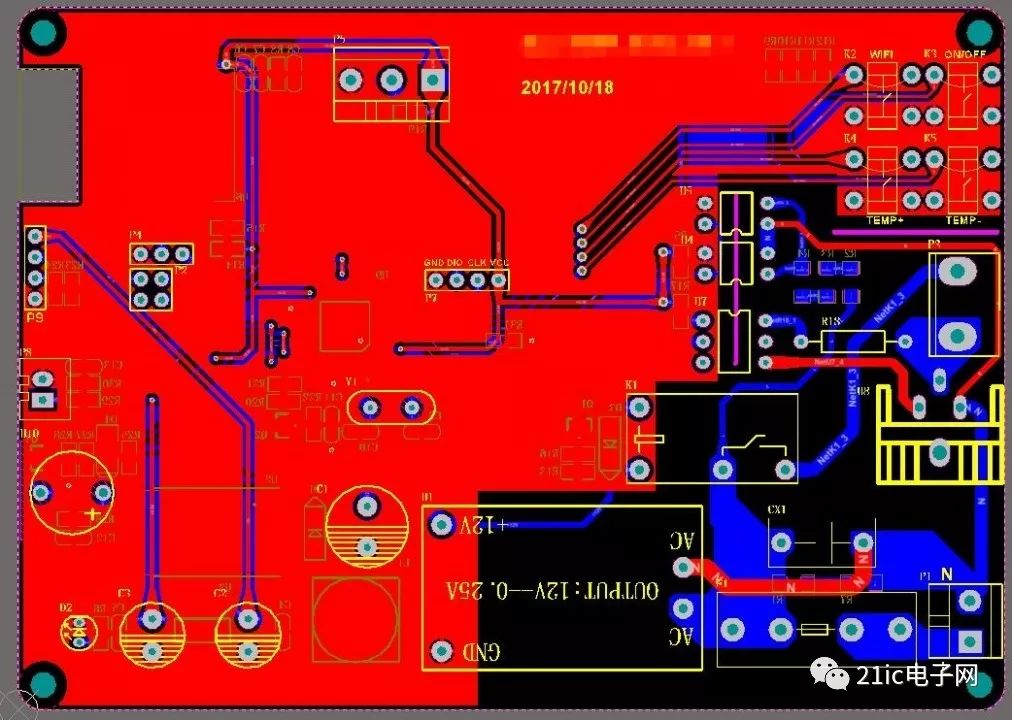
Sample boards returned 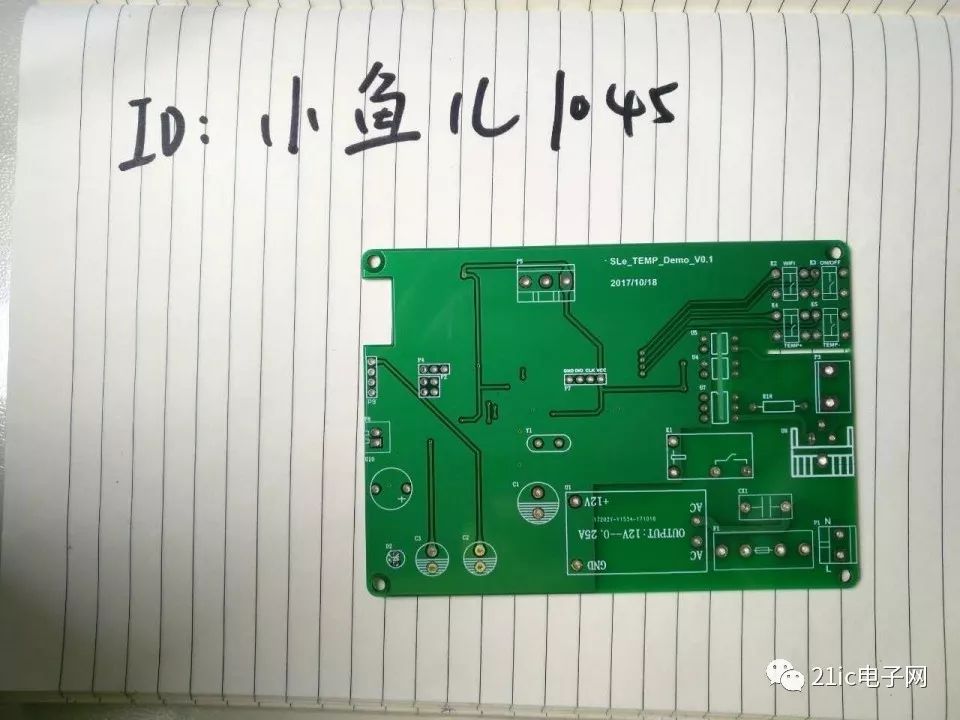 Soldering completed
 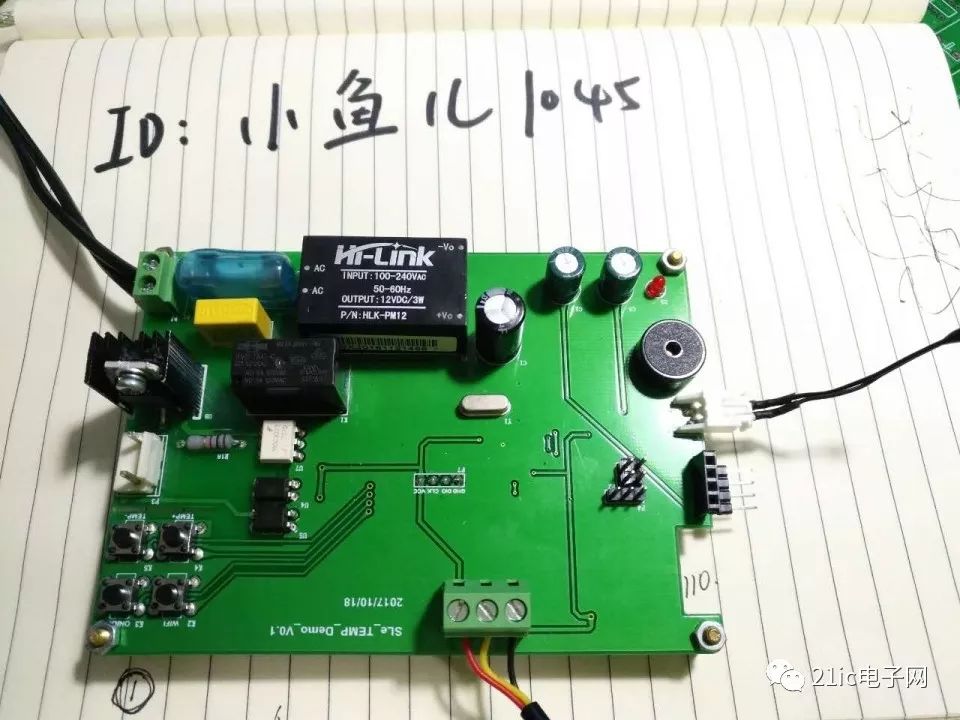 Added TFT screen, assembly completed
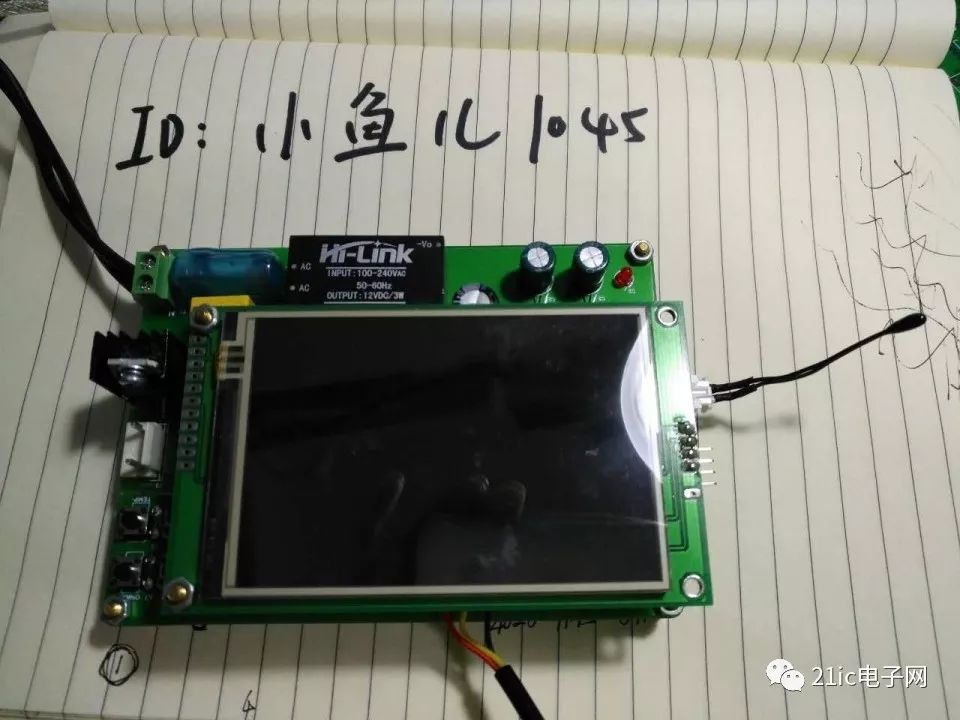
Rough program flowchart 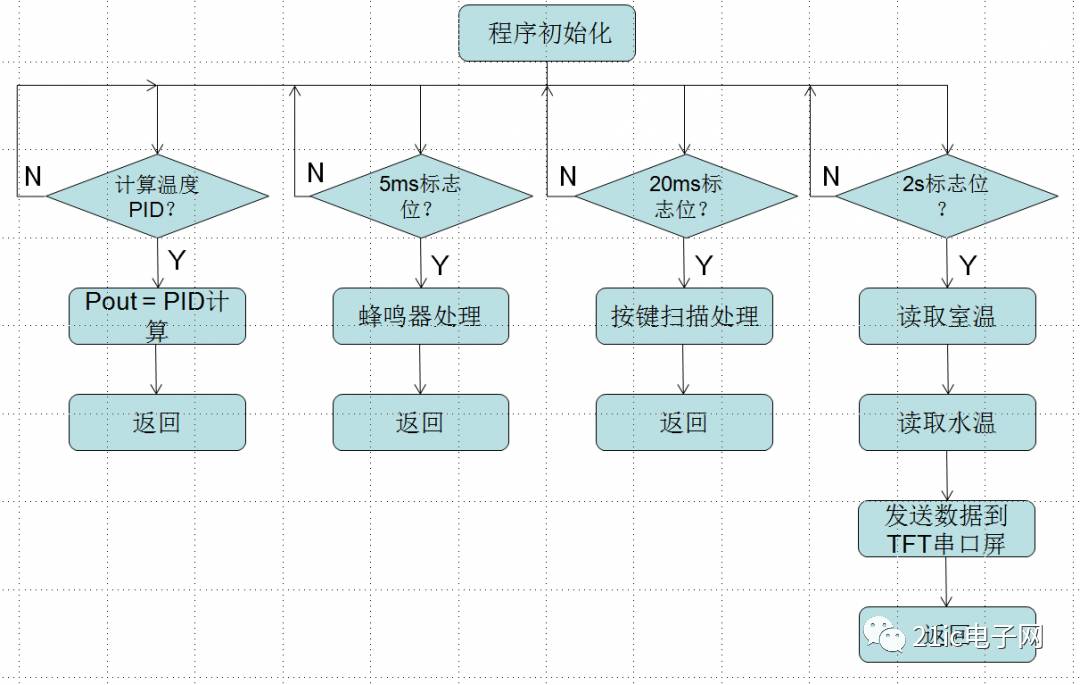 UI Introduction:
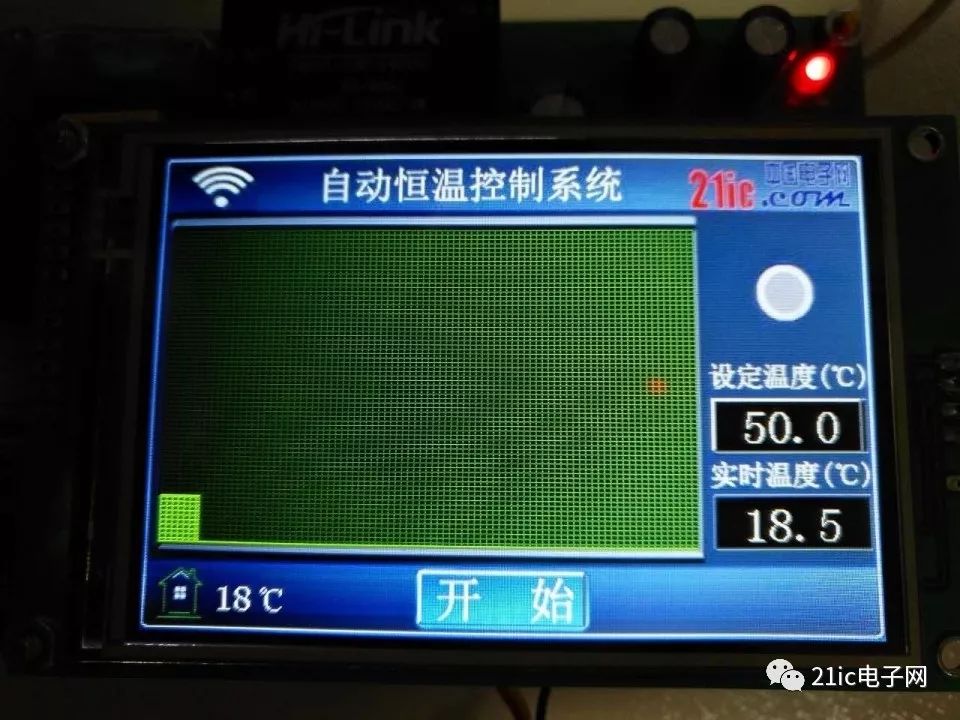
First page  Second page
 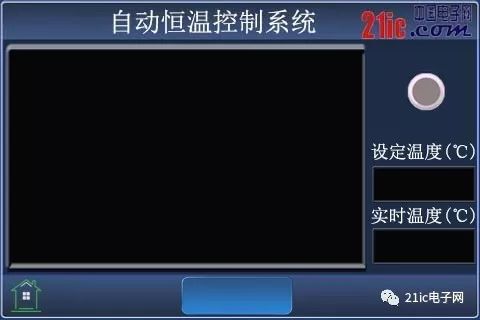 Since I had never done a UI diagram before, the materials above were pieced together from various sources I found online, involving a lot of screenshots and image editing. It took me more than two days to create these two images, and I also improved my PS skills in the process~ Haha, interface description:
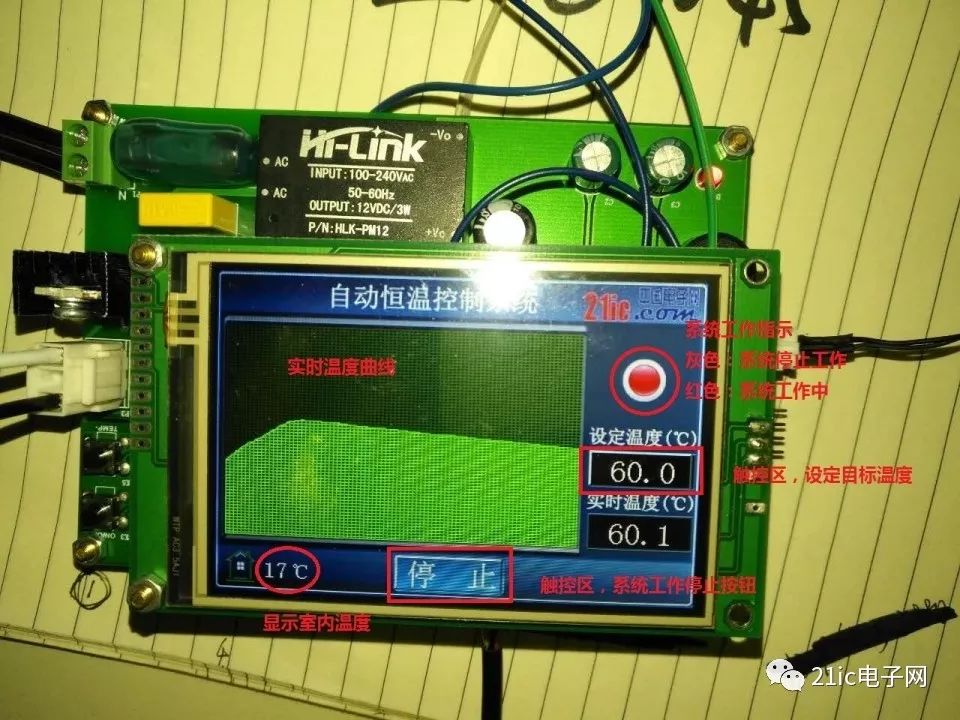
Tools: 1. 800W heating cup 2. 1L water 3. Heating control board 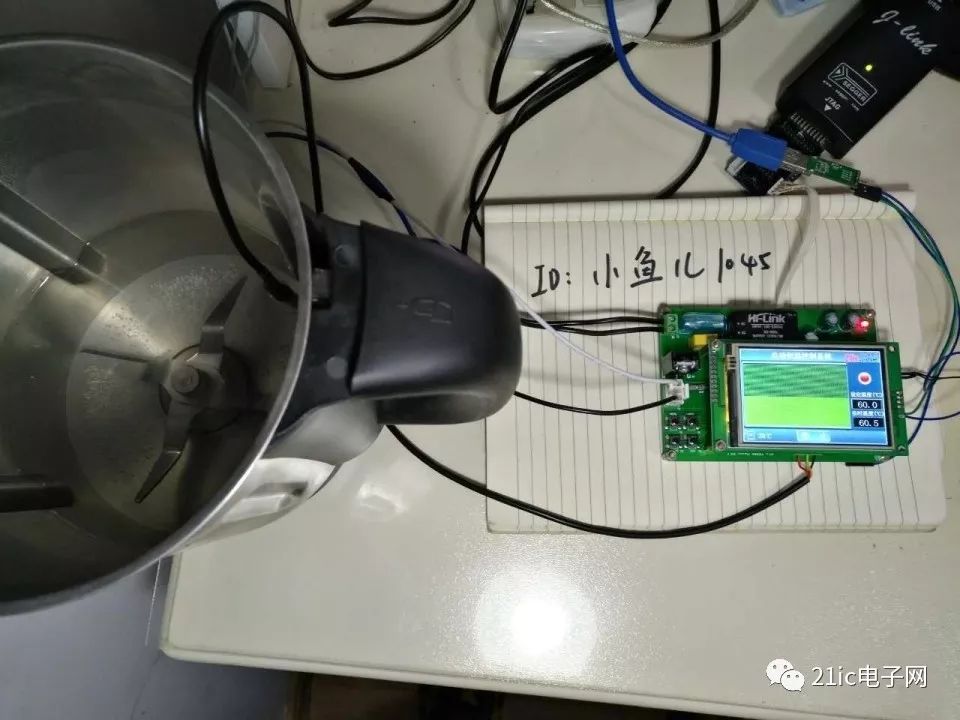 The core part of this system is temperature control, while other functions are more like icing on the cake, and this is the part I was particularly interested in for this competition.
The program’s temperature control section uses PID control (later I found that PD was sufficient, so I didn’t use I, and the system became a PD system). After several nights of hard work and debugging, the control accuracy can reach ±0.5 degrees. Now, let me share my entire PID program debugging thought process~
For the hardware part, I used a thyristor + zero-cross detection, and the heating method is burst mode, not chopping~ Since the calculation cycle is 5 seconds, one PID cycle corresponds to 500 sine waves, and the PID calculation is mapped to these 500 waveforms to determine the heating power.
For the software part, due to the hysteresis of temperature control, the sampling period and PID calculation period cannot be too fast
My program samples the temperature every 2 seconds (reading the temperature can be a bit slower or faster, but it should be less than the PID calculation period), and the PID calculation period is once every 5 seconds. Initially, for parameter tuning convenience, I fixed the target temperature at 60 degrees. The entire system runs for half an hour, so I only sampled the temperature values for half an hour. To facilitate calculations, the temperature values are uniformly scaled up by 10 times, so that floating-point calculations are not needed. Step one: tune the proportional coefficient Kp, setting the integral coefficient Ki and derivative coefficient Kd to zero. The order is Kp first, then Kd, and finally Ki; Of course, someone will ask, what kind of Kp coefficient is appropriate? My experience is based on two standards: (1) being able to oscillate within the specified time; (2) the oscillation peaks being as close to the target value as possible. It’s worth mentioning that if the system has response time requirements, the tuning process should also consider the system’s response time. Based on the above two conditions, I conducted many experiments and uploaded several waveforms for Kp tuning. The Y-axis represents temperature value (X10), and the X-axis represents time (X 2 seconds) Kp = 2, Ki = 0, Kd = 0;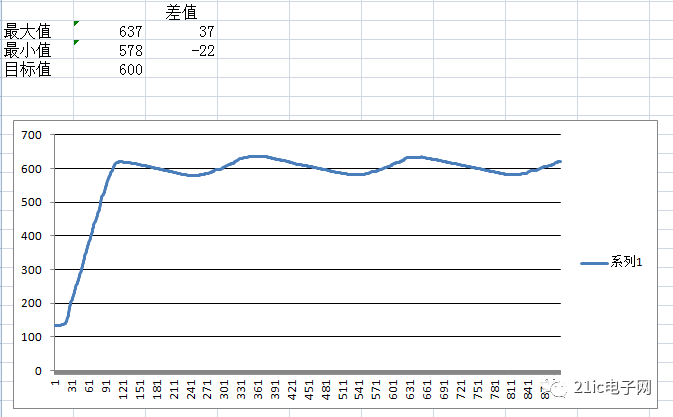 Kp = 4, Ki = 0, Kd = 0;
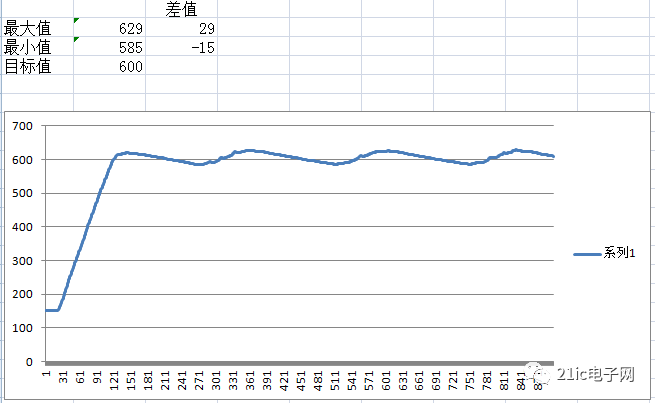 Kp = 6, Ki = 0, Kd = 0;
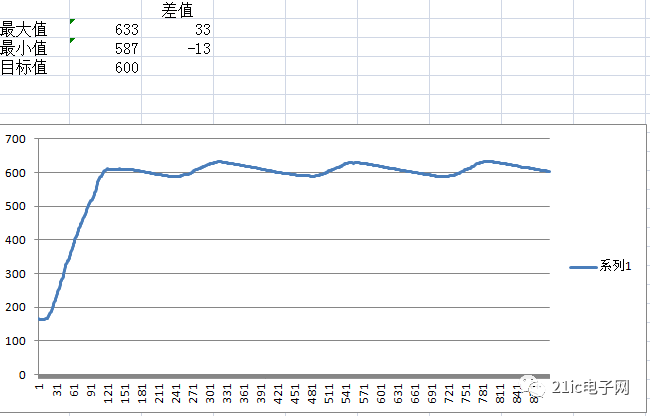 Kp = 8, Ki = 0, Kd = 0;
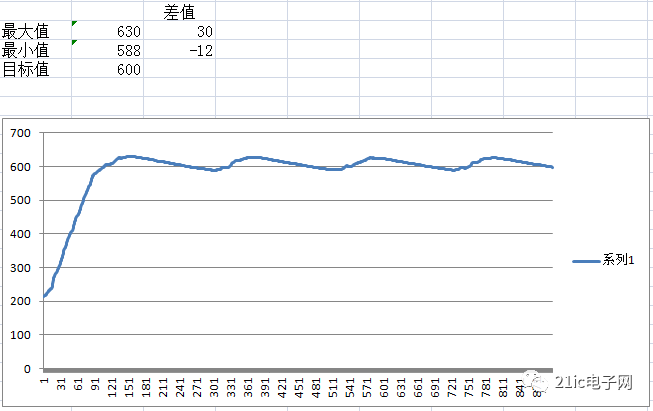
Kp = 10, Ki = 0, Kd = 0;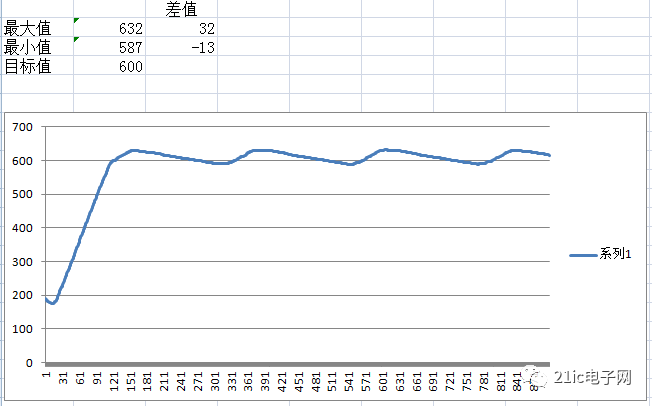 Since the temperature has been scaled up by 10 times, I generally choose integer coefficients for parameter tuning. After multiple experiments comparing the maximum and minimum oscillation values of different coefficients, I finally chose Kp = 4; Step two: with Kp determined, I started tuning Kd. I referenced the method shown in the following diagram
 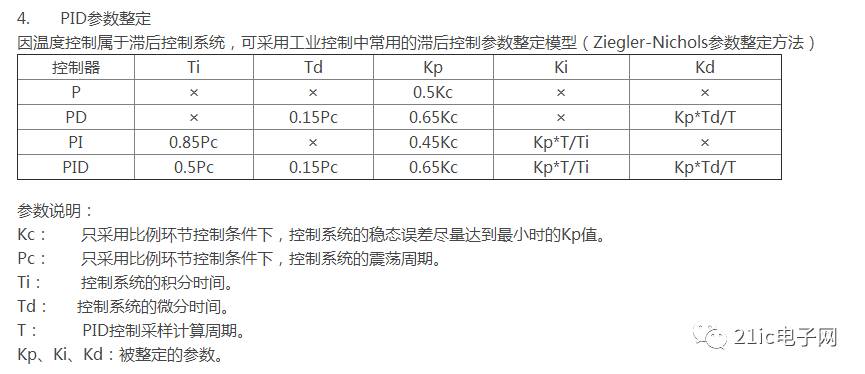 Following the diagram, I calculated as follows: Kc = 4Pc = 210 * 2 = 420 S (Pc oscillation period, I took the X-axis, (511—721) this one period Pc = 721- 511 = 210) Td = 0.15*Pc = 0.15 * 420 = 63T = 5S (PID calculation period) so Kd = (Kp*Td)/T = (4*63)/5 = 50.4 = 50. The PD system experiment produced the following waveform: Kp = 4, Ki = 0, Kd = 50; target temperature 60 degrees
 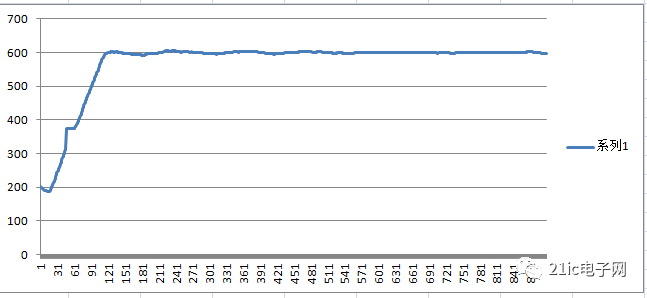 Kp = 4, Ki = 0, Kd = 50; target temperature 75.5 degrees
 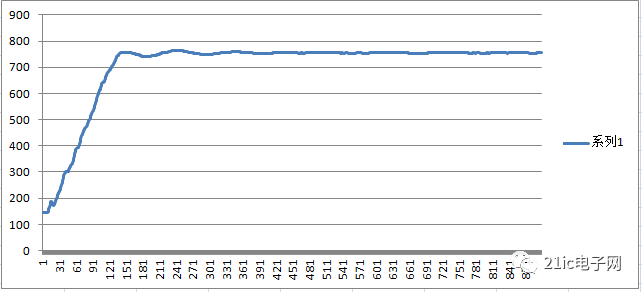 Kp = 4, Ki = 0, Kd = 50; target temperature 80 degrees
 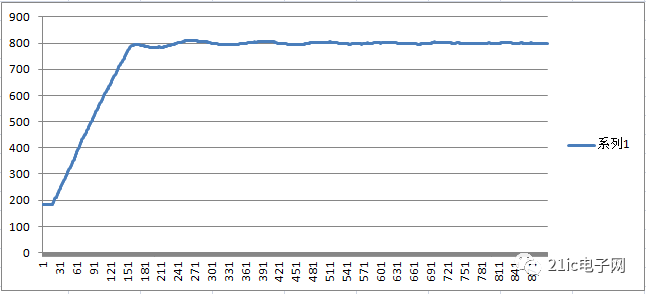 From the waveforms and the actual data collected, the system can generally achieve a target temperature within ±0.5 degrees. Therefore, I did not add the integral part I. With some time left, I am preparing to add a WiFi module. In today’s era of “Internet +”, we also need to keep up with the times~
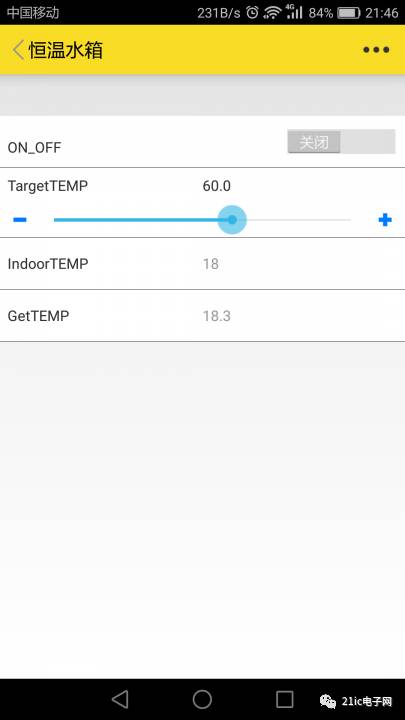
The WiFi solution adopted the platform from Smart Cloud, using the ESP8266 module. I registered an account on Smart Cloud’s official website and followed the steps to establish the “Automatic Temperature Control System”. The APP modules achieve the following functions: 1. Start and stop heating 2. Set target heating temperature 3. Display system working status (set temperature, real-time temperature, indoor temperature, system working status) The software part migrated the Smart Cloud protocol. I should mention that because the Smart Cloud protocol code is quite comprehensive, I did not use their code but instead read the protocol and rewrote it myself, streamlining the protocol content and code quantity. The touchscreen also displays a WiFi icon.
As for the APP interface, I had no prior experience in APP programming, and it was automatically generated by Smart Cloud, so it is relatively simple and can only serve as a rough demonstration.
Below is a demonstration video of the temperature control system
More project materials…
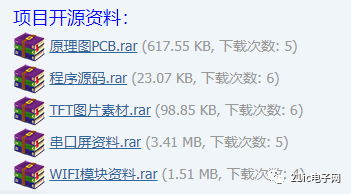
Read the full article for all resources