This article describes the main debugging methods for the Nordic nRF5 SDK to help everyone quickly locate and solve problems. Generally, you can debug your code using various methods such as logging, IDE debug mode, the app_error_check function provided by the SDK, and command line methods.
1. Debugging via Logging
The nRF5 SDK supports two low-level communication methods for printing logs: UART and SWD J-Link (RTT). After SDK14, logs can also be output and stored via Bluetooth or Flash. Generally, UART and SWD are commonly used, where UART uses a serial assistant to view logs, and SWD uses J-Link RTT Viewer (only for Windows) or J-Link RTT Client (for Windows/Mac/Linux) to view printed logs. Since the UART logging method occupies one UART port, and most nRF5 chips only have one UART port, which can lead to resource conflicts, we recommend usingRTT for logging. This way, the UART port can be reserved for normal applications. More importantly, the RTT logging method has very low power consumption (almost negligible), allowing it to be enabled in officially released products to discover potential issues after deployment (the UART logging method has very high power consumption and must be turned off in officially released products).
If you use the SWD interface for logging, you can use J-Link RTT Viewer or RTT Client to display logs; choose one of the two. On the Windows platform, it is recommended to use RTT Viewer; otherwise, use RTT Client.
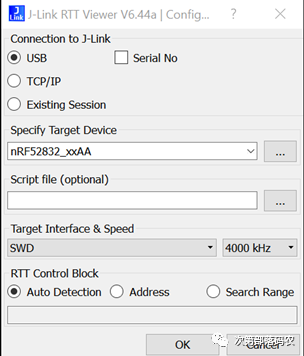
1.1 J-Link RTT Viewer
The configuration for RTT Viewer is shown below:
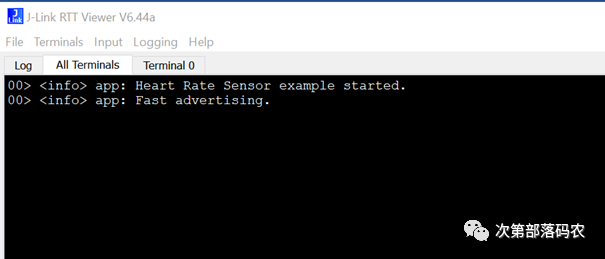
The log printing window of RTT Viewer is shown below: (The example used is from ble_app_hrs in SDK15.3, the same below)

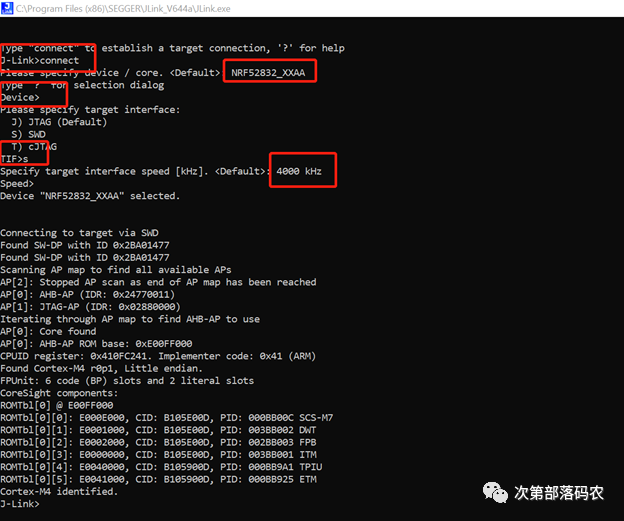
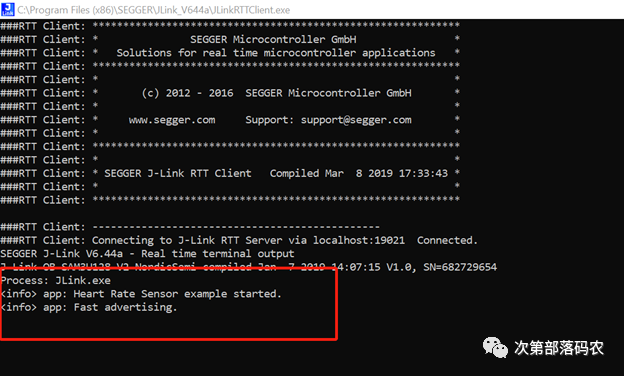
1.2 J-Link RTT Client
The configuration method for RTT Client is as follows (configured directly using the jlink command):
The printing window of RTT Client is shown below:
1.3 UART Serial Assistant
The configuration method for the serial assistant is shown below:
-
Baud rate: 115200
-
8 data bits
-
1 stop bit
-
No parity
-
HW flow control: None
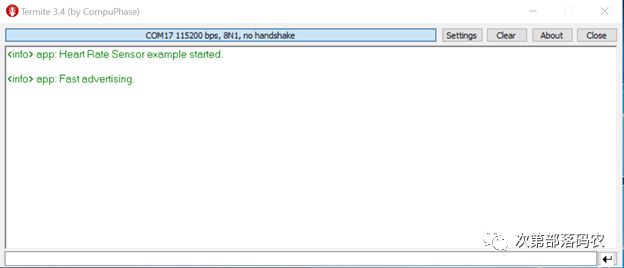
You can choose any serial assistant you are familiar with, such as Putty or Termite. The Termite printing window is shown below:
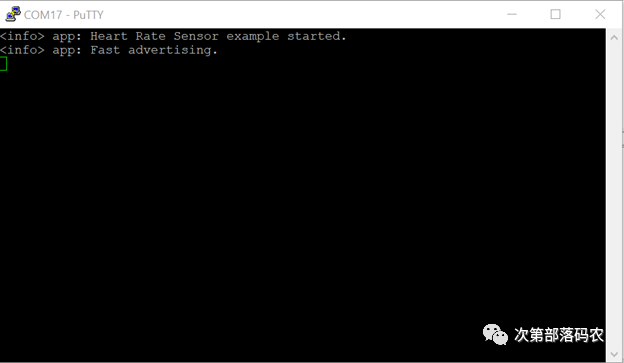
The Putty printing window is shown below:
1.4 Log Printing Module nRF_Log
The logging feature of the nRF5 SDK is implemented through the nRF_Log module (all logs shown above are printed via nRF_Log). Most examples included in the SDK come with logging functionality, meaning they include the nRF_Log module. Generally, examples default to using UART for printing. If you need to switch to RTT for printing, you need to configure the nRF_Log module. Before discussing the configuration options for the nRF_Log module, let’s briefly explain how the nRF_Log works.
How nRF_Log Works
The nRF_Log module consists of frontend and backend code. The frontend is the user-facing printing interface, such as NRF_LOG_INFO, which places the data to be printed in a block of RAM. The backend is responsible for implementing the printing functionality, which prints the data from the frontend RAM through different backend interfaces. Currently, the backend interfaces supported by nRF_Log include: UART, RTT, Flash, and Bluetooth. Regardless of which backend interface is used, the frontend API called by the user is the same. The nRF_Log module automatically adapts to the corresponding backend interface based on the user’s configuration, and users can enable multiple backend interfaces simultaneously, allowing logs to be printed to multiple backend ports at the same time. The nRF_Log module can enable or disable the printing function of a specific module, such as the advertising module. When debugging the advertising module, you can enable the log, and once debugging is complete, you can disable it to keep the log interface clean. The nRF_Log module also allows setting the printing level (Level). If levels are not used, the printing interface will contain a lot of information, requiring us to spend a lot of time searching for the logs we want during each debugging session. After setting levels, we can selectively print the needed log information. When there are no issues, we only print info-level logs; when there are issues, we can print all debug-level logs. The nRF_Log also has a Deferred feature: if Deferred is not enabled, calling NRF_LOG_INFO and other APIs will immediately flush the logs; if Deferred is enabled, calling NRF_LOG_INFO and other APIs will only place the printed data in RAM, and the actual printing is completed by NRF_LOG_PROCESS in the main function, which minimizes the impact of printing on the application itself, especially during critical timing operations. The nRF_Log also supports timestamp printing, adding timestamp information before each log.
nRF_Log Configuration
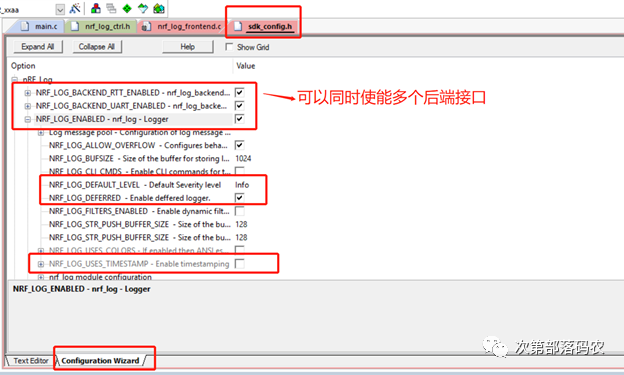
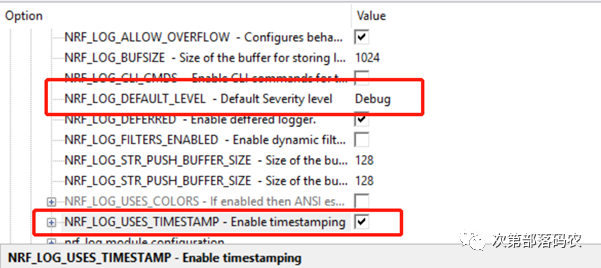
Since SDK12, the configuration of the nRF_Log module is mainly located in the sdk_config.h file. Taking the project nRF5_SDK_15.3.0_59ac345\examples\ble_peripheral\ble_app_hrs\pca10040\s132\arm5_no_packs as an example, the configuration options for nRF_Log are shown below:
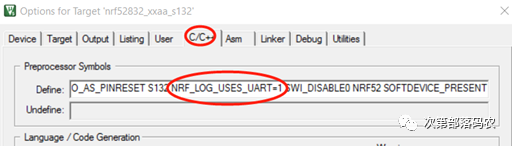
Note: nRF5 SDK v11.0.0 and earlier versions do not have the sdk_config.h file. In this case, you need to define a macro in options for target->C/C++->define (Keil project). If you define “NRF_LOG_USES_UART=1”, UART logging will be selected; if you define “NRF_LOG_USES_RTT=1”, RTT logging will be selected, as shown below:
Using nRF5_SDK_15.3.0_59ac345\examples\ble_peripheral\ble_app_hrs\pca10040\s132\arm5_no_packs as an example, when nRF_Log is configured to info level, without timestamp, the printed information is as follows (same as the previous configuration):
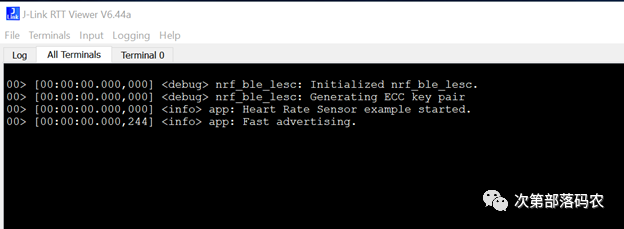
When nRF_Log is configured to debug level, with timestamp enabled, the printed information is as follows:
2. Debugging Using IDE Debug Interface
Nordic products support all conventional debugging methods such as step-by-step execution, breakpoints, register viewing, memory viewing, and call stack viewing. It is important to note that since the softdevice must maintain a certain clock and handle many interrupt events at the low level, once Bluetooth is running, you can only use one breakpoint to run at full speed. This means that after executing one breakpoint, the internal logic and timing of the program become chaotic, and you cannot continue to run a second breakpoint at full speed. If you want to see the content of the second breakpoint, you can only delete the first breakpoint and start execution again.
Keil IDE
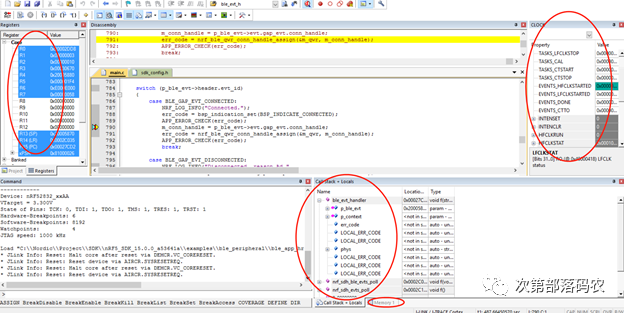
Open the internal register viewing window of nRF5 SoC as follows:
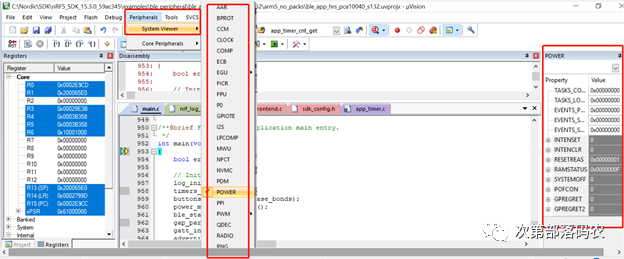
Several commonly used Keil windows:
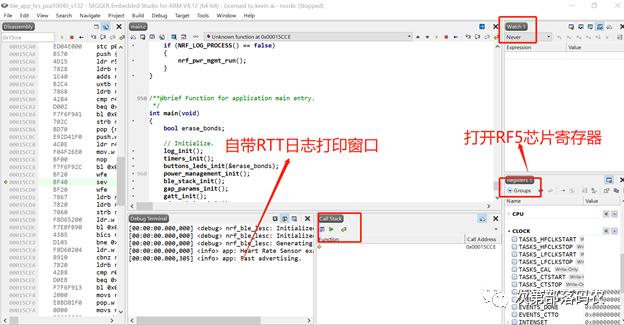
Segger Embedded Studio IDE
The debugging interface of SES is shown below (very similar to Keil):
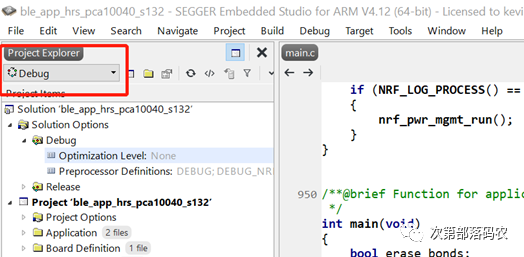
It is particularly important to emphasize that all SES projects include two versions: Release and Debug. The Release version does not contain debug information to save code space, so if you want to debug a project, please select the debug version first, and then proceed with debugging, as shown below:
3. The APP_ERROR_CHECK Function Provided by nRF5 SDK
APP_ERROR_CHECK is a function defined in the nRF5 SDK to check whether the return value of an API is correct. In the nRF5 SDK, NRF_SUCCESS (0) is the correct return value, and all other return values are error values. All protocol stack API calls and SDK library function calls in the nRF5 SDK will use APP_ERROR_CHECK to check the return value of the call. When an illegal call occurs, such as when the input arguments are incorrect, the API return value will not be NRF_SUCCESS, and at this point, APP_ERROR_CHECK will come in handy. By examining the definition of the APP_ERROR_CHECK function, as shown below:

NRF_BREAKPOINT_COND;

    // On assert, the system can only recover with a reset.

#ifndef DEBUG

    NRF_LOG_WARNING("System reset");

    NVIC_SystemReset();

#else

    app_error_save_and_stop(id, pc, info);

#endif // DEBUG
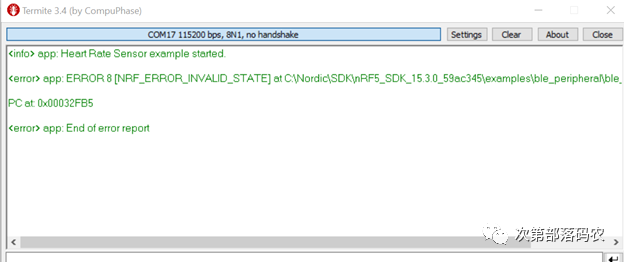
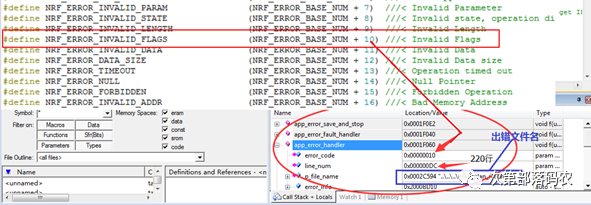
You will find that the behavior of APP_ERROR_CHECK is influenced by the macro DEBUG and whether a debugger is attached. When the DEBUG macro is not defined, the system will directly perform a soft reset; when the DEBUG macro is defined and no debugger is attached, the system will save the error information in the call stack. Regardless of the configuration, APP_ERROR_CHECK will print the corresponding error information to facilitate problem diagnosis, as shown below. By examining the printed error information, you can know which file and which line of code caused what type of error.
Note that before SDK14, app_error_check did not actively print error information but stored it in RAM, which could be directly viewed through debug mode, as shown below:
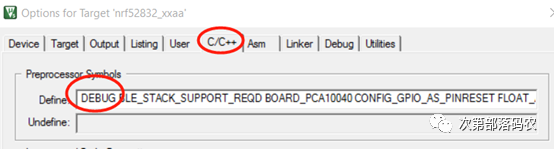
By default, the nRF5 SDK does not define the DEBUG macro, so once the function return value is incorrect, the system will reset. It is particularly pointed out that during your development and debugging process, you will frequently encounter resets, most of which are caused byAPP_ERROR_CHECK. For this type of reset, you only need to define a macro: DEBUG in options for target->C/C++->define to quickly identify which file and which line of code triggered the reset and what the reason for the reset is, as shown below:
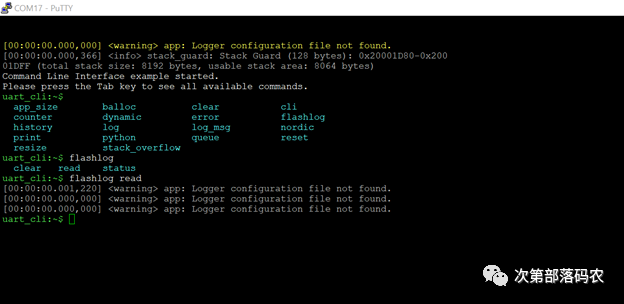
4. Debugging via Command Line (CLI)
The logging method can only output unidirectionally and cannot accept input from the terminal. In many cases, we need to dynamically adjust log information, such as dynamically changing the log level, dynamically changing the log color, etc. At this point, the nrf_cli module is needed. Similar to nRF_Log, nrf_cli supports five backend interfaces: UART, RTT, BLE, Flash, and USB CDC. Since nrf_cli also has logging output functionality, the nRF_Log module can directly select nrf_cli as its backend interface. Here, it is emphasized again that nrf_log and nrf_cli are two completely independent modules, but nrf_log can choose nrf_cli as its backend interface, with nrf_cli handling the backend printing functionality. The SDK provides three examples of CLI, which are:
-
\examples\peripheral\cli\pca10040\blank\arm5_no_packs
-
\examples\ble_peripheral\experimental\ble_app_cli\pca10040\s132\arm5_no_packs
-
\examples\ble_central_and_peripheral\experimental\ble_app_interactive\pca10040\s132\arm5_no_packs
If your application requires command line interaction, you can refer to the three examples above. For example, the interface after successful interaction is shown below: