Using serial ports to print debugging information is a common debugging method, known for its simplicity and ease of use, but it also has significant limitations:– It does not support advanced features such as breakpoints, single-step tracing, and memory read/write.– Excessive printed debugging information can impact performance, while too little information may be insufficient to resolve issues.– Modifying the information often requires code changes, leading to lower work efficiency.In summary, serial port printing is an auxiliary debugging method, and its debugging capabilities and efficiency cannot be compared to the “formal tools” based on hardware debuggers.So why do many development boards on the market label the serial port as the debugging port? For example, the Feiteng development board based on the Feiteng E2000Q does not have a JTAG port used by hardware debuggers, only a debug UART.A major reason for this phenomenon is that hardware debuggers are very expensive, and their usage is relatively low. In other words, the high cost has marginalized the formal debugging methods based on hardware debuggers, while serial port printing, which should only serve as an auxiliary method, has become the primary debugging tool.Lauterbach, a well-known hardware debugger supplier from Germany, has branches in China. For example, Lauterbach’s debugging solution for Feiteng SOC is said to cost around 80,000 yuan.Such a price is enough to deter many R&D teams.However, the situation is changing. The debugging tool developed by GeDu Technology, the WeiMaQiang debugger, has rapidly developed in recent years,based on ARM’s ADI and CoreSight technology,and offers rich debugging features, including:– Software and hardware breakpoints– Reading and writing system registers– Disassembly– Reading and writing memory, including virtual and physical memory– Support for SWD and JTAG interfacesIt also has powerful upper-level semantics, including:– Automatic recognition of common debugging targets such as the Linux kernel and U-BOOT– Strong symbol management capabilities, including on-demand downloading of symbol files from symbol servers based on the debuginfod protocol– Extremely rich debugging commands, supporting command plugins, allowing users to easily develop their own debugging commands– Common commands compatible with WinDBG and GDBFor example, the following image shows the scenario of using the WeiMaQiang’s accompanying software NDB (Nano Code Debugger) to debug the Linux kernel, with CPU 0 switching threads.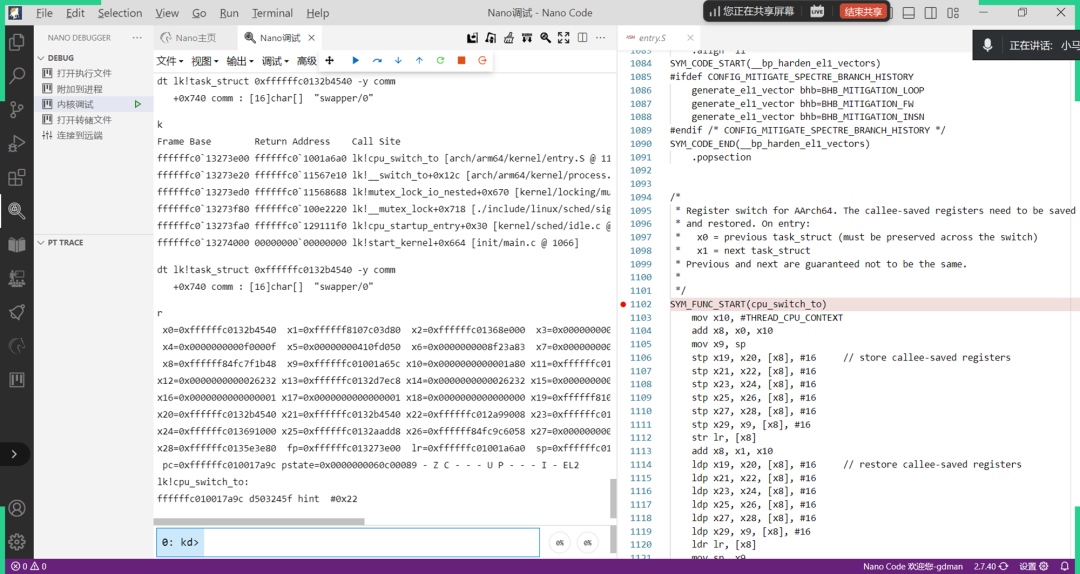 The next image shows the use of NDB to debug U-BOOT, with the command window in the middle and the source code window on the right.
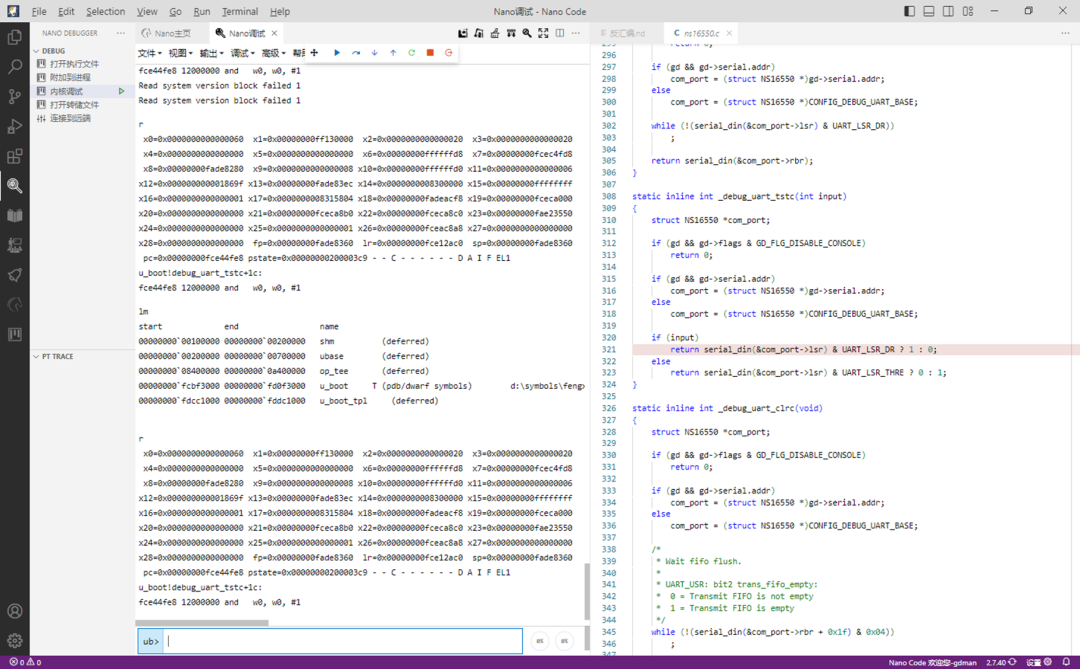 Recently, the WeiMaQiang debugger has begun to support domestic SoCs, including the Feiteng E2000. It is particularly suitable for colleagues engaged in software development based on the Xinchang SOC, including:– Device driver development– Firmware development, such as U-BOOT– Linux kernel development and maintenance– System testing and post-maintenance– Performance optimization, such as boot speed and software lag
 To do a good job, one must first sharpen their tools. A good debugging tool can not only improve debugging efficiency, quickly resolve difficult bugs, and save valuable product R&D and delivery time, but also contribute to the technical growth of software engineers, allowing for a deeper understanding of the software and hardware technology stack, knowing not only how things work but also why they work that way. This benefits the company by improving software quality and benefits individuals by aiding career development.(Writing articles is hard work, so I kindly ask all readers to click “See”, and feel free to share.)*************************************************
With sincerity and integrity, we explore knowledge and examine software with a humanistic perspective, using software technology to change lives.
Scan the QR code below or search for the “ShengGeShu” mini-program in WeChat to read more articles and audiobooks.

Also welcometo follow the GeYou public account