In CLion, you can open the disassembled code:
-
When the source code is available, you can open it for any frame as needed.
-
When the source code is not available, you can do so by using “Force Step Into”.
Open Disassembly View for a Frame
-
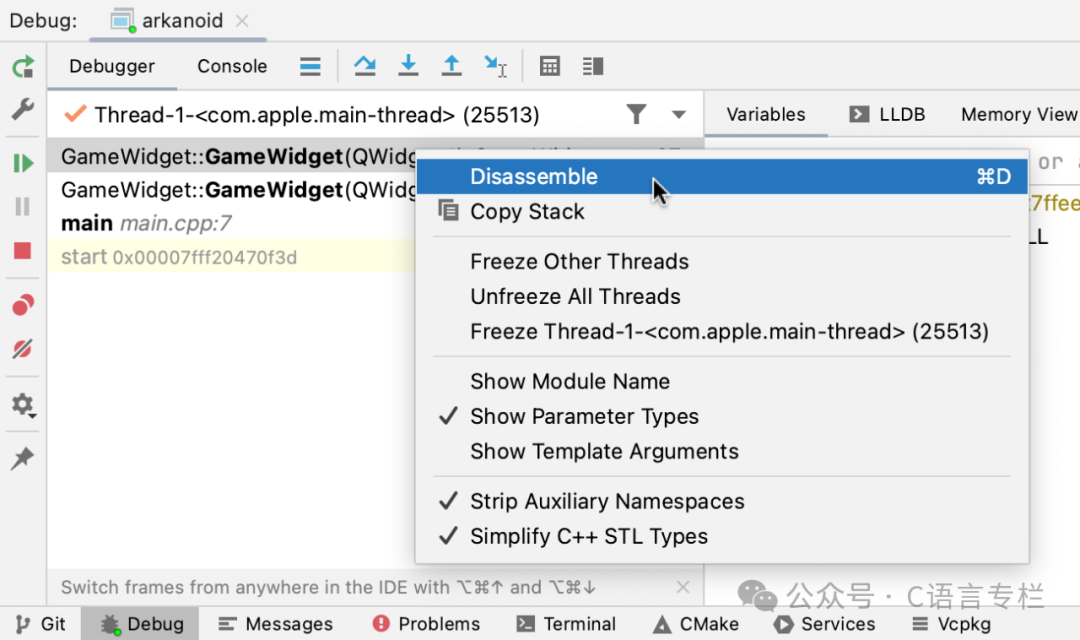
Right-click on the desired frame in the debug tool window and select “Disassemble”:
-
The disassembly view will open side by side with the source code:
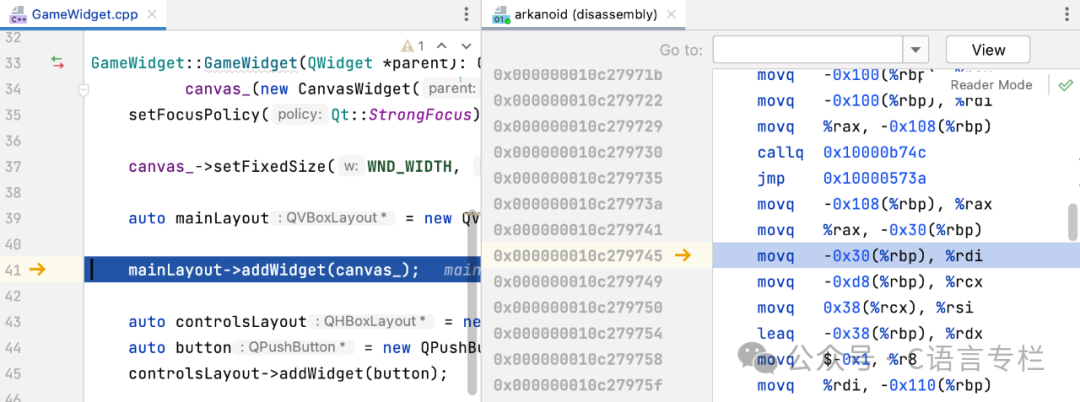
Once opened, the disassembly view will stay synchronized with the currently selected frame. When switching frames, both the editor and the disassembly view will scroll to the execution point.
All debugging operations described below apply to this side-by-side view, but CLion currently does not synchronize breakpoints between the source file and the disassembly view.
👇Click to Claim👇
👉C Language Knowledge Resource Collection
Open Disassembly View When Source is Unavailable
-
When debugging code, use the “Force Step Into”
 AltShiftF7 command, instead of “Step Into” F7. For functions without source code, the “Step Into” operation is similar to “Step Over”.
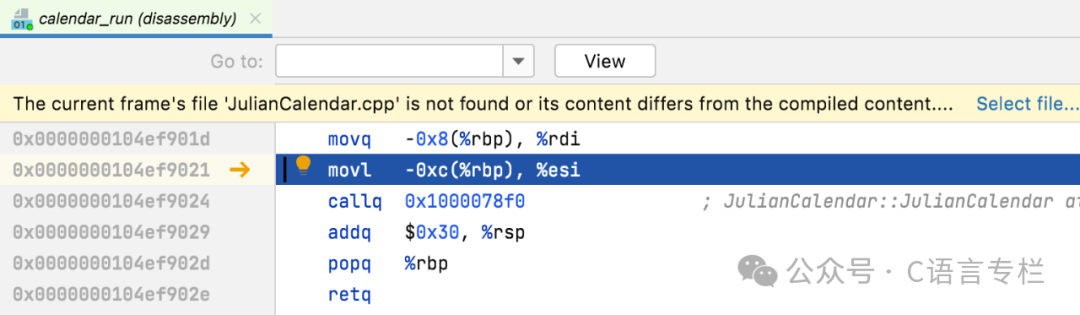
During debugging, if CLion cannot locate the source file, it will automatically open the disassembly view. This may occur, for example, when you are debugging a custom executable using a pseudo CMake project or when you have built a library without source code.
To explicitly specify the source file, click “Select File” in the notification:
-
Navigate to the desired frame in the debug tool window.
-
When starting a debug session for an additional process that does not provide debug information, the disassembly view will also open automatically.
Step Through in Disassembly
In the disassembly view, you can use the regular stepping operations to investigate the code.
The stepping behavior in disassembly and raw source code is different: while the debugger always steps line by line, a line in the source code usually contains multiple instructions, whereas a line in disassembly always corresponds to a single instruction.
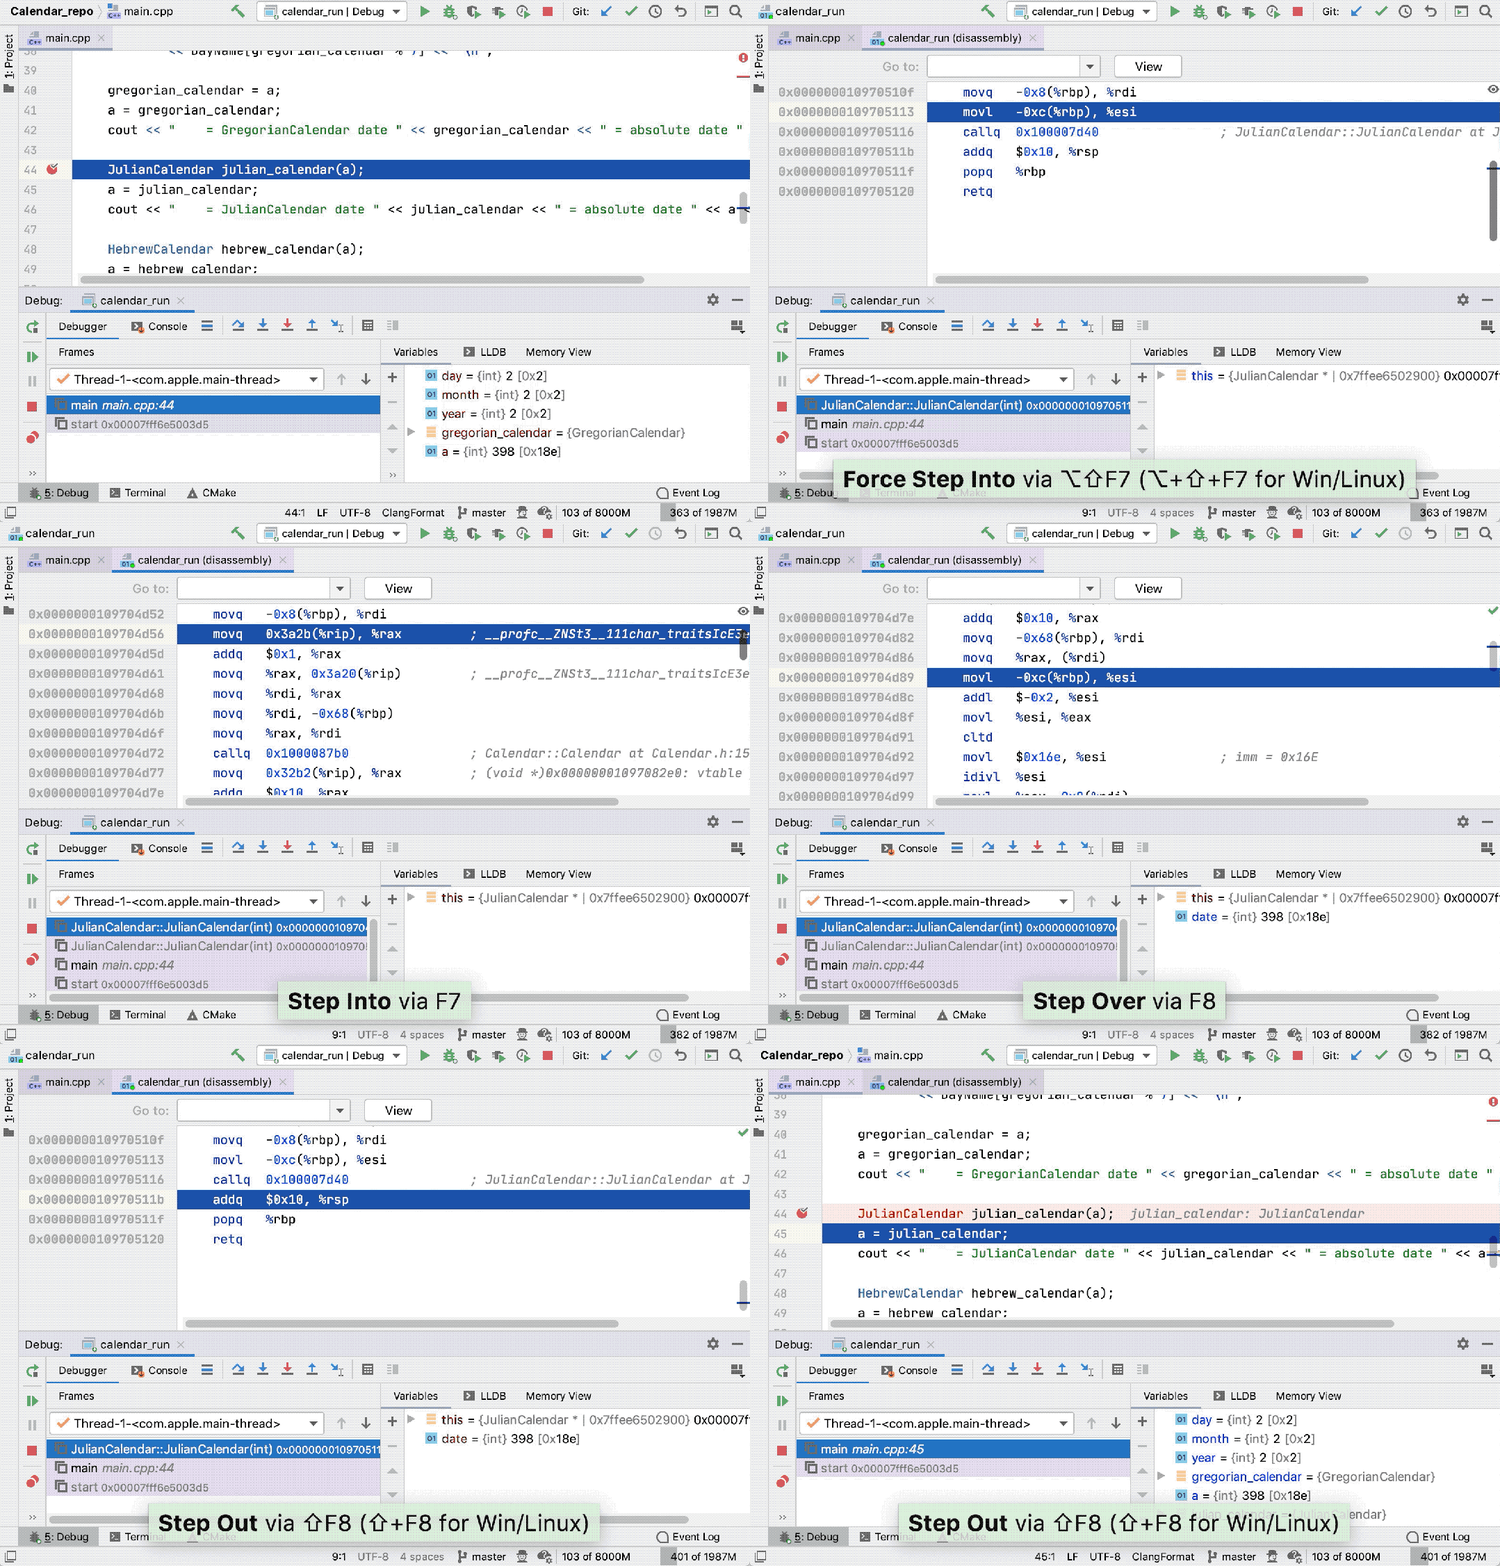
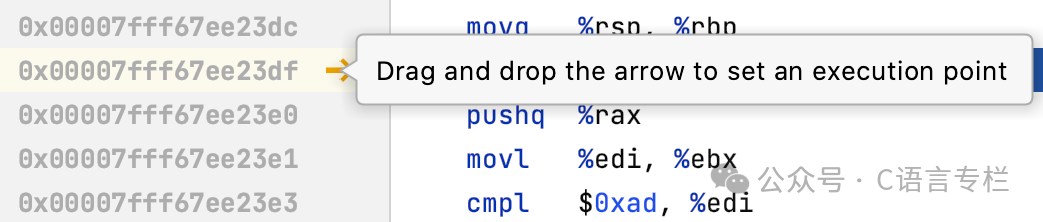
You can also use the set execution point operation to jump to any line of code in the disassembly:
Breakpoints in Disassembly
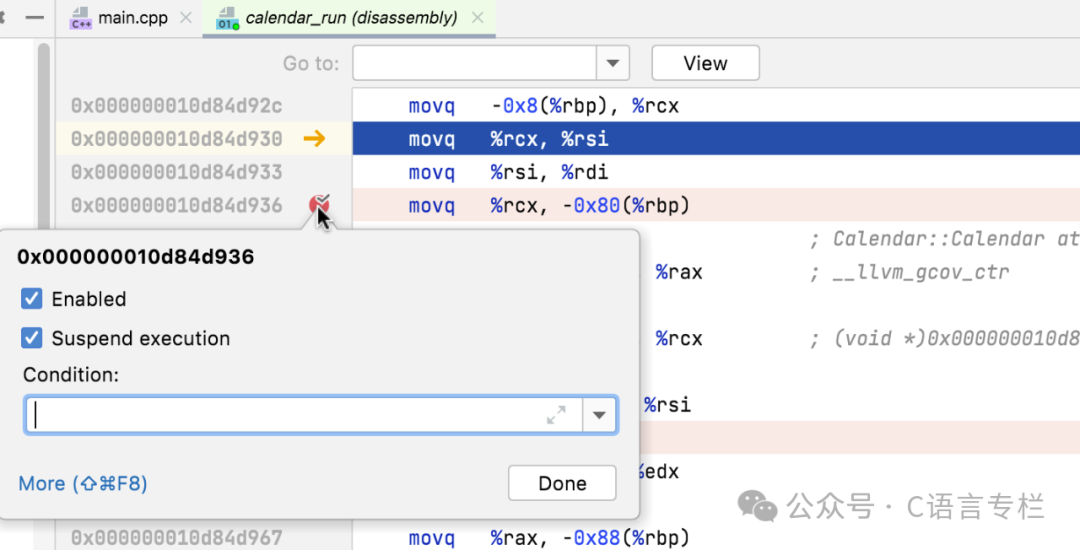
You can set breakpoints in disassembly just like in source code. These breakpoints are called address breakpoints.
Right-click on the breakpoint to see the available options:
Click “More” or press Ctrl+Shift+F8 to edit the address breakpoint in the breakpoint dialog:
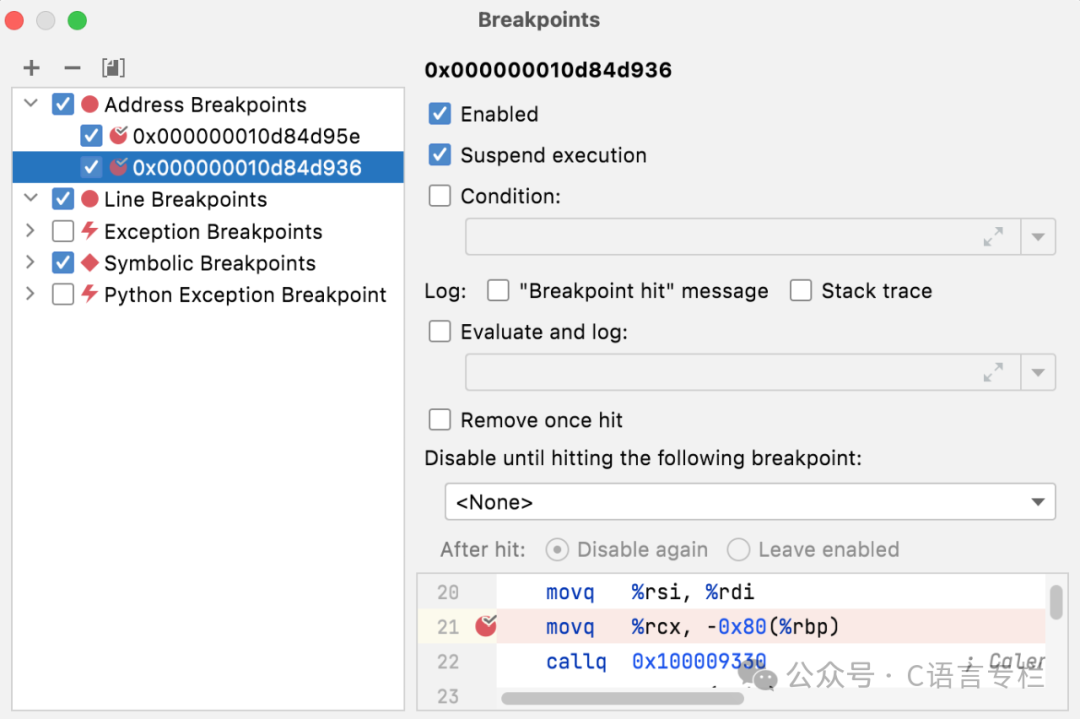
When you stop the debug session, address breakpoints are automatically removed, as in most cases, the address layout changes on the next startup. This is similar to watchpoints.
Go to Address
You can jump to the desired line of code using the “Go to” field. In this field, you can enter an address or any expression that can be evaluated as an address.
If you need to include registers in the expression, start with $ (GDB notation).
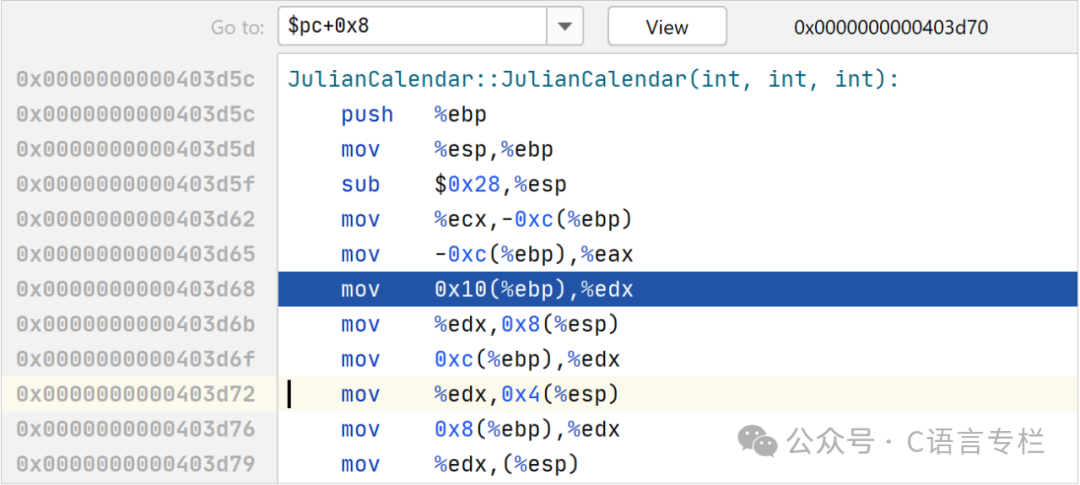
When debugging with LLDB, using registers in the “Go to” field requires explicit conversion to an address. For example, (void *)($pc + 0x8).
Syntax Highlighting for Assembly Files
AT&T assembly code supports syntax highlighting.
By default, .s and .asm files are recognized as assembly code files, but you can configure additional types:
-
Go to Settings | Editor | File Types.
-
Select Assembly Language from the list of recognized file types and add new extensions to the list.
Popular Recommendations
-
21,000 Stars! A Swiss Army Knife for Developers, now open-sourced~
-
Netizens complain: Are all recruitment apps dead except for the boss?
-
Why do some outsourcing jobs pay more than official positions?