Operating System: Linux / macOS / Windows
Project Format: CMake
Management Suite: Run | Manage Coverage Reports Ctrl+Alt+F6
Coverage Settings: Settings Ctrl+Alt+S | Build, Execution, Deployment | Coverage
In CLion, you can run CMake applications and tests with code coverage measurement. The code coverage results provide the percentage of code lines executed during runtime and the number of times specific lines were executed.
CLion relies on llvm-cov / gcov integration to collect and display code coverage data. These tools require special coverage compiler flags, which you can pass manually or let CLion add automatically.
Using Coverage to Run CMake Applications or Tests
The "Run with Coverage" action applies to CMake applications and test configurations (Boost.Test, Google Test, or Catch).
You can invoke "Run with Coverage" from the toolbar next to the configuration switcher or from the illustration menu:
When you invoke "Run with Coverage" but no coverage files (.gcov or .profraw) are found, CLion suggests adding coverage flags:
👇 Click to receive 👇
👉 C Language Knowledge Resource Collection
If you click "Fix and Rerun," CLion will do the following:
Search for existing CMake configurations with the same build type, toolchain, and CMake options as the currently used configuration but with added coverage compiler options. If found, CLion will switch to that configuration and use it to run your coverage configuration.
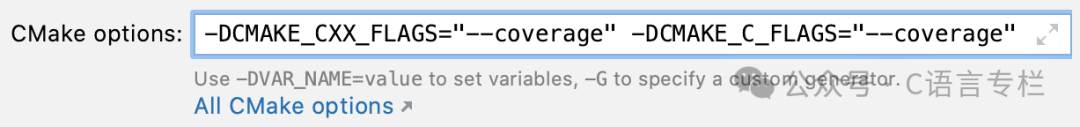
If no such configuration is found, CLion will create a new configuration, copying the build type, toolchain, and CMake option parameters from the current configuration and passing coverage flags as CMAKE_CXX_FLAGS and CMAKE_C_FLAGS in the CMake options. Then, CLion will switch to this newly created configuration and use it to run your coverage configuration.
Coverage Compiler Flags
If you pass coverage flags manually, you can choose one of the following options based on your preferred compiler and coverage tool:
-
GCC
-fprofile-arcs -ftest-coverage or –coverage
In this case, the gcov tool will be used.
-
Clang/Clang-cl
There are two options:
For Clang-cl, code coverage is only available for x86 architecture. Ensure you select it in the architecture field of the Visual Studio toolchain.
-
Use the same flags as GCC to get gcov-style coverage collected via llvm-cov gcov.
-
Use -fprofile-instr-generate -fcoverage-mapping to invoke Clang’s instrumentation-based analysis, which uses llvm-profdata merge and llvm-cov export commands.
You can provide these flags by setting the CMAKE_CXX_FLAGS variable (CMAKE_C_FLAGS for C projects) or using other methods like the add_compile_options command.
If you encounter linker errors when building the project with gcov compiler flags, try passing the same flags to the linker via add_link_options or set(CMAKE_EXE_LINKER_FLAGS “”).
Coverage Results
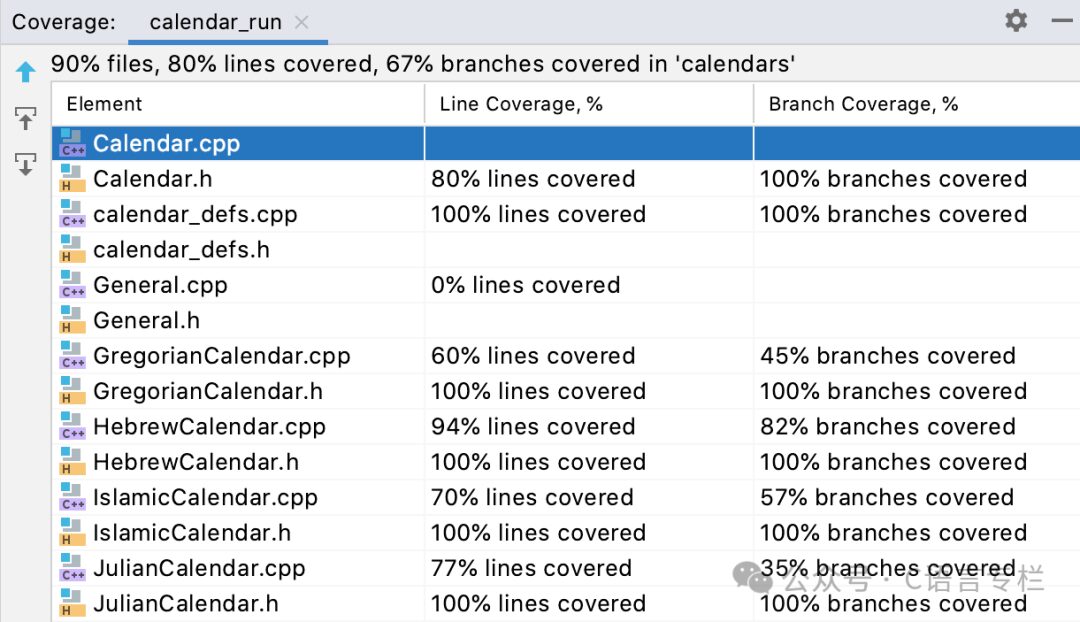
When coverage data is ready, the Coverage tool window will automatically open. Initially, it shows the percentage of files covered during startup. If you double-click a folder, you will see columns for line coverage and branch coverage.
-
Line coverage shows the number of lines covered in each file. Note that its behavior varies depending on the compiler and flags you use:
Using GCC/gcov (–coverage flag) provides precise line coverage. When there are multiple code blocks in a line, if at least some statements are executed, that line is considered fully covered (marked green in the editor).
Using Clang/llvm-cov, when the program is compiled with -fprofile-instr-generate and -fcoverage-mapping, it provides statement coverage. If not all statements in a line are executed, that line is marked as partially covered (yellow).
-
Branch coverage considers all branches of each control structure.
It applies to LLVM version 12.0.0 or higher and any version of GCC. On macOS, the AppleClang version corresponds to earlier LLVM versions. AppleClang 12.0.x corresponds to LLVM 10.0.x, which does not support branch coverage. To resolve this, you can switch to GCC or change the coverage compiler flags to –coverage:
GCC and gcov tools consider branches generated by the compiler when calculating branch coverage. This may affect results if you use exception handling, etc.
In any file, you can view the illustration indicators and click the indicator next to a specific line to see how many times it was hit:
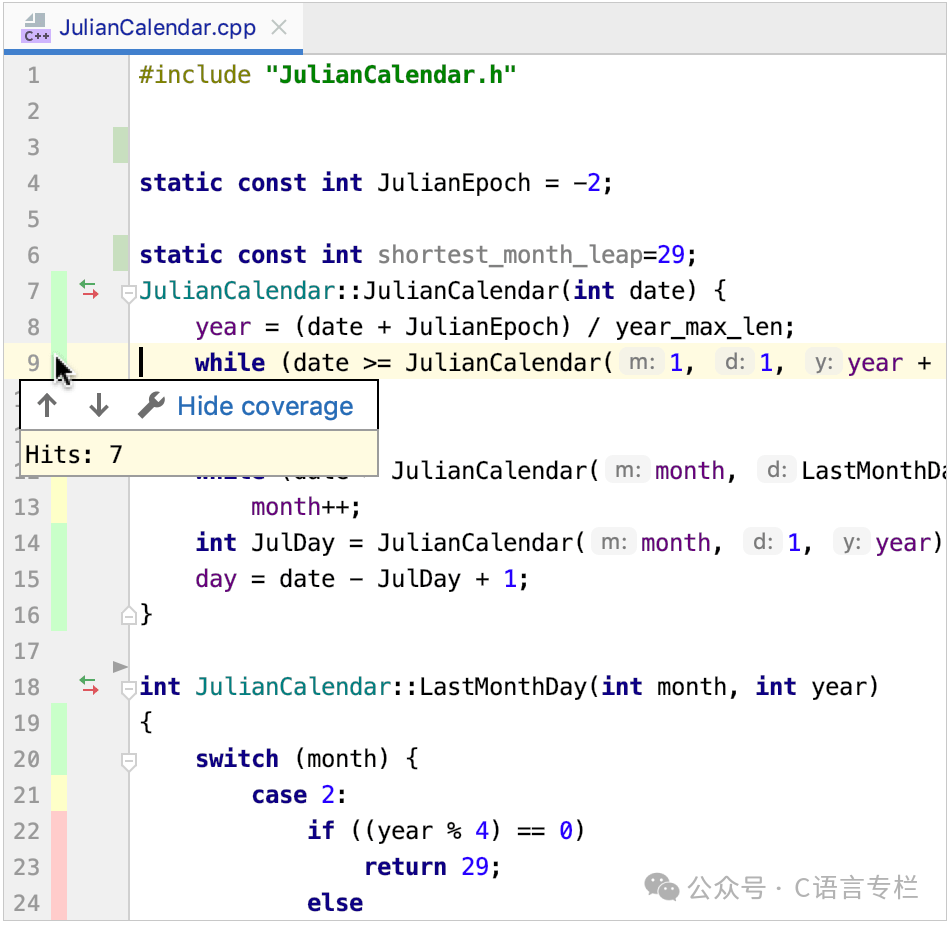
Fully executed lines are marked green. Yellow marks indicate they were only partially executed.
To modify the colors of the coverage highlights, click  or go to Settings | Editor | Color Scheme | General and expand the line coverage node.
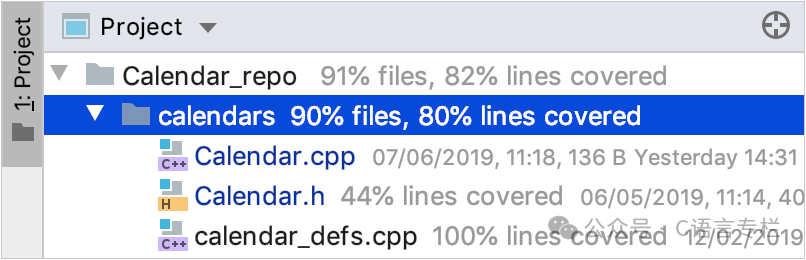
CLion also displays coverage statistics in the project view:
Coverage Suites
The coverage data collected for a specific run is called a coverage suite.
CLion can display the results of one or more coverage suites at a time. If multiple suites are selected, the IDE shows the combined results of those suites. This means that if a line was executed in at least one selected suite, it is considered covered.
The corresponding suite files are located in CLion’s system directory:
Windows
%LOCALAPPDATA%\JetBrains\CLion2024.1\coverageLinux
~/.cache/JetBrains/CLion2024.1/coveragemacOS
~/Library/Caches/JetBrains/CLion2024.1/coverageManage Suites
-
In the main menu, go to Run | Manage Coverage Reports Ctrl+Alt+F6.
-
In the “Select Coverage Suites to Display” menu:
-
Select active suites using checkboxes. Active suites define the coverage data currently displayed in the IDE.
-
Use
 to add imported external suite files, such as those generated in CI servers or sent to you by others. You can use .ic (CLion runner) and .exec (JaCoCo runner) files.
To view imported suites collected using the CLion runner, you do not need to compile or run the project.
-
Use
 to remove suites from the list but keep the files stored.
-
Use
 to delete suites from the list and remove files from storage.
Merge Results from Multiple Runs
When you rerun coverage analysis, CLion will prompt you to choose how to display the new results:
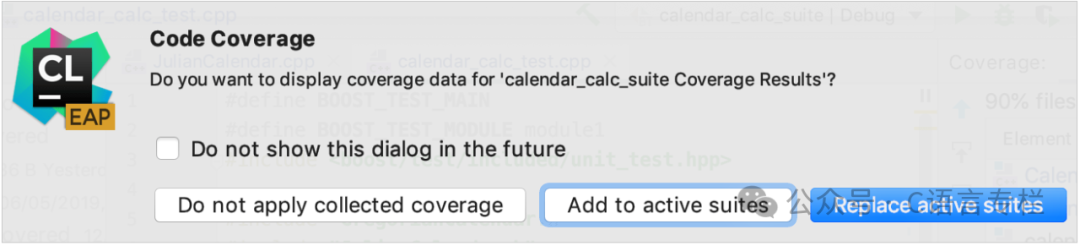
Add to Active Suite – New results will be added to previously collected statistics.
Replace Active Suite – Collected data will be overwritten.
Do Not Apply Collected Coverage Data – New results will be ignored.
Coverage Settings
The code coverage settings are located at Settings | Build, Execution, Deployment | Coverage:
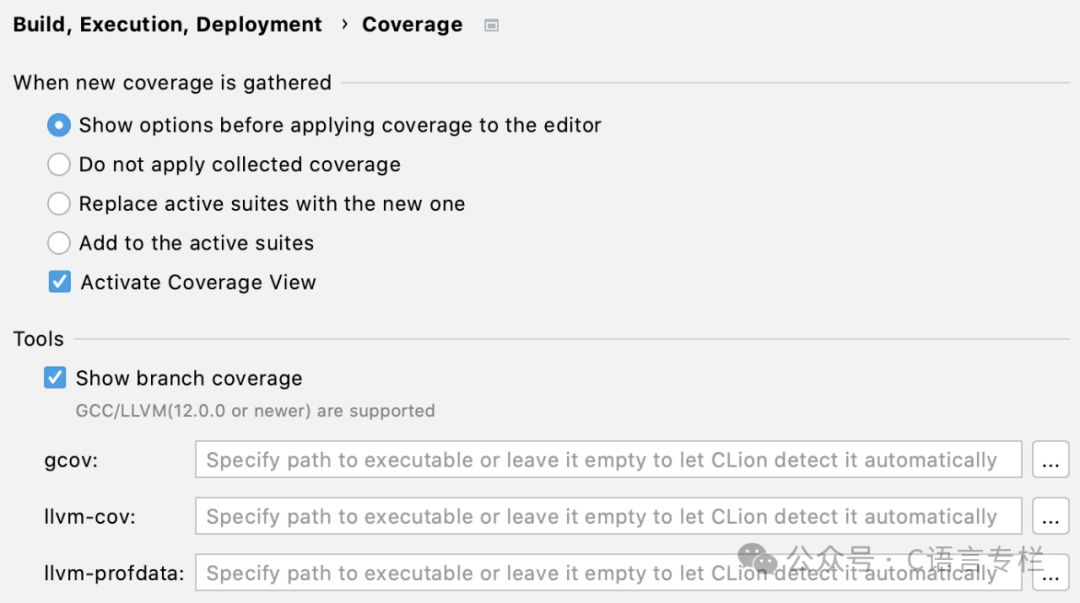
In the tools section, you can provide custom paths for gcov/llvm-cov/llvm-profdata. By default, CLion retrieves the path from the PATH environment variable.
Troubleshooting
-
If you get an empty coverage report, check if your compiler version matches the version of the gcov / llvm-cov tool (default or custom) you are using.
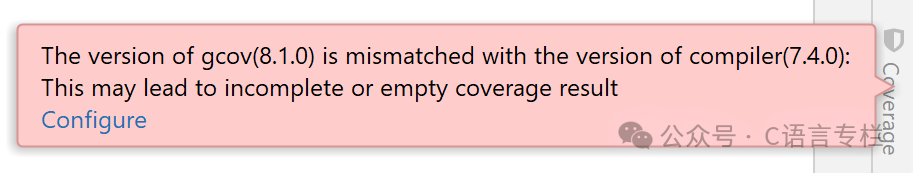
Keep this in mind when changing compilers or switching from one Windows toolchain to another.
Popular Recommendations
-
Why do parachuted leaders have to eliminate old employees first?
-
Why do some people have average work abilities but perform well in interviews…
-
Can one still pass background checks for large companies after being detained for soliciting?