Hello everyone, I am Pi Zi Heng, a serious technical guy. Today, I will share with you the experience of further improving code execution performance on i.MXRT.
The topic I want to discuss today is related to a large project based on i.MXRT1170 that I have been involved in recently. I am working on the boot animation feature, and I previously wrote an article titled “Reducing Refresh Rate is the Top Method for Locating LCD Display Issues” to introduce the implementation of the boot animation feature and considerations for LCD display. In this feature, I would like to further test the time it takes from powering on the chip to displaying the first complete image on the LCD screen, which we will temporarily call the 1st UI time. The duration of this time is of great significance to the project.
I tested the 1st UI time of the code execution under XIP and TCM respectively, and the surprising result was that XIP execution was 50ms faster than TCM execution. What is going on? This completely overturns our understanding. On i.MXRT, TCM runs at the same frequency as the core, and the Flash speed is much lower than TCM. If it is XIP execution, even with I-Cache acceleration, it should be at most as fast as TCM execution; how could it be so much faster than TCM execution? Therefore, I started to dig deeper into this strange phenomenon and discovered the secret to further improving code execution performance.
1. Introducing the Timing Discrepancy Issue
My boot animation program is based on the \\SDK_2.x.x_MIMXRT1170-EVK\\boards\\evkmimxrt1170\\jpeg_examples\\sd_jpeg example, with the SD card and libjpeg library related code removed. The project has two builds: one executes in TCM (i.e., debug), and the other executes in XIP (i.e., flexspi_nor_debug).
The Flash model on the project board is MX25UW51345G, which I configured in Octal mode, DDR, 166MHz for booting. There are also two LED lights on the project board. I flew two wires to the LED lights and connected them along with the POR pin to an oscilloscope for precise measurement of the time composition of each part of the 1st UI.
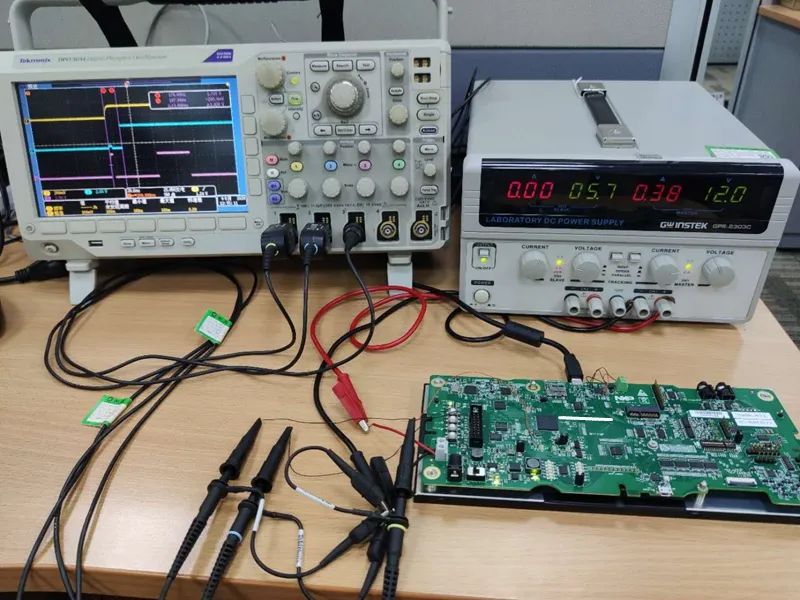
Oscilloscope channel 1 is connected to the POR pin, indicating the starting point of the 1st UI time; channel 2 is connected to LED1 GPIO, indicating the ROM startup time (the point when the user APP starts); channel 3 is connected to LED2 GPIO, with two level changes indicating the start and end time points of the 1st image frame. The code for flipping the LED GPIO is as follows:
void light_led(uint32_t ledIdx, uint8_t ledVal);

void SystemInit (void) {
    // Set LED1 to 1, indicating ROM startup time
    light_led(1, 1);

    SCB->CPACR |= ((3UL << 10*2) | (3UL << 11*2));

    // ...
}

void APP_InitDisplay(void)
{
    // ...

    g_dc.ops->enableLayer(&g_dc, 0);

    // Set LED2 to 1, indicating the start time point of the 1st image frame
    light_led(2, 1);
}

int main(void)
{
    BOARD_ConfigMPU();
    BOARD_InitBootPins();
    BOARD_BootClockRUN();
    BOARD_ResetDisplayMix();

    APP_InitDisplay();

    while (1)
 {
     // ...
 }
}

static void APP_BufferSwitchOffCallback(void *param, void *switchOffBuffer)
{
    s_newFrameShown = true;

    // Set LED2 to 0, indicating the end time point of the 1st image frame
    light_led(2, 0);
}
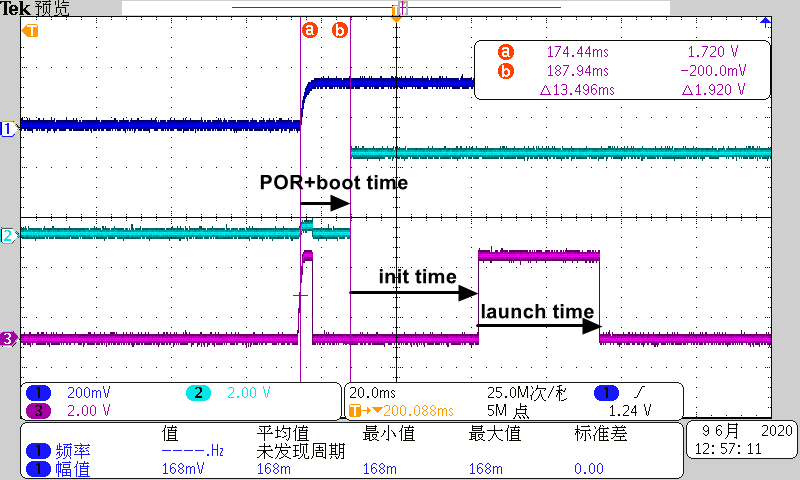
The above figure shows the waveform I captured (30Hz, XIP). I conducted four tests in total, under 30Hz LCD refresh rate for XIP/TCM and 60Hz LCD refresh rate for XIP/TCM, and the results are shown in the table below. The Init Time column in the table indicates the execution time of the boot animation program code (from the start of SystemInit() function execution to the end of APP_InitDisplay() function). It can be seen that TCM execution is nearly 50ms slower than XIP execution, which is the strange issue.
| Code Location | LCD Refresh Rate | POR Time | Boot Time | Init Time | Launch Time |
|---|---|---|---|---|---|
| XIP | 30Hz | 3.414ms | 10.082ms | 34.167ms + 153ms | 32.358ms |
| TCM | 30Hz | 3.414ms | 10.854ms | 33.852ms + 203ms | 32.384ms |
| XIP | 60Hz | 3.414ms | 9.972ms | 18.142ms + 153ms | 16.166ms |
| TCM | 60Hz | 3.414ms | 10.92ms | 17.92ms + 203ms | 16.104ms |
2. Locating the Timing Discrepancy Issue
For the boot animation code, the result that XIP execution is faster than TCM execution is something I do not believe. Therefore, I used a binary search method to gradually investigate and found that the time difference is caused by the DelayMs() call in the BOARD_InitLcdPanel() function. These artificially inserted delays are required by the LCD controller manual, and the total delay time should be 153ms. However, the execution of this function differs between XIP (153ms) and TCM (203ms).
static void BOARD_InitLcdPanel(void)
{
    // ...

#if (DEMO_PANEL ==  DEMO_PANEL_TM103XDKP13)
    // ...

    /* Power LCD on */
    GPIO_PinWrite(LCD_RESET_GPIO, LCD_RESET_GPIO_PIN, 1);
    DelayMs(2);
    GPIO_PinWrite(LCD_RESET_GPIO, LCD_RESET_GPIO_PIN, 0);
    DelayMs(5);
    GPIO_PinWrite(LCD_RESET_GPIO, LCD_RESET_GPIO_PIN, 1);
    DelayMs(6);
    GPIO_PinWrite(LCD_STBYB_GPIO, LCD_STBYB_GPIO_PIN, 1);
    DelayMs(140);
#endif
    // ...
}
So now the question is why does executing DelayMs(153) in TCM take 203ms, while it is accurate under XIP execution. Let’s further examine the prototype of the DelayMs() function, which actually calls the SDK_DelayAtLeastUs() function. The name SDK_DelayAtLeastUs() is quite interesting; ‘At Least’ guarantees that the soft delay will definitely meet the user-specified time, but it may also exceed this time. The reason for the ‘At Least’ design actually involves a very important feature of the Cortex-M7 core – instruction dual-issue. The software delay essentially relies on the CPU executing instructions to consume time, but whether the CPU fetches instructions in single-issue or dual-issue has a certain degree of uncertainty, which makes it impossible to achieve precision. If we calculate based on full dual-issue, we can derive the minimum delay time.
#define DelayMs                  VIDEO_DelayMs

#if defined(__ICCARM__)
static void DelayLoop(uint32_t count)
{
    __ASM volatile("    MOV    R0, %0" : : "r"(count));
    __ASM volatile(
        "loop:                          \n"
        "    SUBS   R0, R0, #1          \n"
        "    CMP    R0, #0              \n"
        "    BNE    loop                \n");
}
#endif

void SDK_DelayAtLeastUs(uint32_t delay_us, uint32_t coreClock_Hz)
{
    assert(0U != delay_us);
    uint64_t count = USEC_TO_COUNT(delay_us, coreClock_Hz);
    assert(count <= UINT32_MAX);

#if (__CORTEX_M == 7)
    count = count / 3U * 2U;
#else
    count = count / 4;
#endif
    DelayLoop(count);
}

void VIDEO_DelayMs(uint32_t ms)
{
    SDK_DelayAtLeastUs(ms * 1000U, SystemCoreClock);
}
At this point in the analysis, the question has transformed into why the probability of executing instruction dual-issue under XIP is greater than that under TCM. There is no relevant information found in the official ARM documentation regarding this phenomenon. The DelayLoop() loop only contains 3 instructions, and executing under XIP should be within a Cache line, which is not much different from executing in TCM. Let’s take a look at the map files of the two projects to find the linked address of the DelayLoop() function. The linking addresses of this function differ under the two test projects, which means that the test conditions are not completely the same, and this may be a clue to solving the problem.
For the XIP execution project (flexspi_nor_debug), the address of the DelayLoop() function is aligned to an 8-byte boundary:
*******************************************************************************
*** ENTRY LIST
***
Entry                       Address   Size  Type      Object
-----                       -------   ----  ----      ------
DelayLoop               0x3000'3169    0xa  Code  Lc  fsl_common.o [1]
For the TCM execution project (debug project), the address of the DelayLoop() function is aligned to a 4-byte boundary:
*******************************************************************************
*** ENTRY LIST
***
Entry                       Address   Size  Type      Object
-----                       -------   ----  ----      ------
DelayLoop                    0x314d    0xa  Code  Lc  fsl_common.o [1]
3. Finding the Essence of Timing Discrepancy
Having found that the difference in the linking address of the DelayLoop() function is a clue, we can conduct tests based on this clue. Instead of allowing the linker to automatically allocate the address of the DelayLoop() function, we specify the address in the link file. The following code is an example in the IAR environment; we use the debug project (i.e., executing in TCM) for testing.
In the C source file, we add #pragma location = “.myFunc” before the definition of the DelayLoop() function, defining this function to be in the .myFunc section, and then in the link file (icf), we use the place at statement to specify the .myFunc section to link to a fixed address starting from m_text_func_start:
#if defined(__ICCARM__)
#pragma location = ".myFunc"
static void DelayLoop(uint32_t count)
{
    // ...
}
#endif
define symbol m_text_func_start        = 0x00004000;

place at address mem: m_text_func_start     { readonly section .myFunc };

define symbol m_text_start             = 0x00002400;
define symbol m_text_end               = 0x0003FFFF;

place in TEXT_region                        { readonly };
Based on the different starting addresses of m_text_func_start, we obtained different results, as shown in the table below. Thus, the truth is revealed: the fundamental reason for the different execution times of the DelayMs() function is not the XIP/TCM execution difference, but the difference in linking address alignment. Functions aligned to 8-byte boundaries are more likely to trigger CM7 instruction dual-issue, which results in a 24.8% performance improvement compared to functions aligned to 4-byte boundaries.
| m_text_func_start value | Link Address Alignment | Function Call Statement | Actual Execution Time |
|---|---|---|---|
| 0x00004000 | 8n bytes | DelayMs(100) | 100ms |
| 0x00004002 | 2 bytes, not linked | N/A | N/A |
| 0x00004004 | 4 bytes | DelayMs(100) | 133ms |
| 0x00004008 | 8 bytes | DelayMs(100) | 100ms |
Now we have an interesting conclusion: linking functions to 8-byte aligned addresses on Cortex-M7 is beneficial for instruction dual-issue, which is the secret to further improving code execution performance.
Thus, I have shared my experience of further improving code execution performance on i.MXRT. Where’s the applause~~~