Introduction
EasyMultiOmics is a comprehensive platform developed by our team that integrates statistical analysis, multi-omics analysis, and visualization functions based on phyloseq structured datasets. The R package contains over 300 functions, providing 14 single-omics data analysis workflows covering relevant omics in microbial research, such as microbiome, metabolomics, transcriptomics, and metagenomics. In terms of multi-omics joint analysis, this tool offers 7 workflows, supporting individual analysis of microbiome, metagenome, metabolome, and transcriptome, as well as pairwise joint analysis and integrated analysis of the four core omics. In our recent update tweet, we would like to share some special features of the EasyMultiOmics analysis workflows, which include our new ideas and methods in the process of omics analysis, hoping to present a more convenient and robust analysis workflow. The package is now open-source on GitHub (we welcome everyone to star and follow): https://github.com/taowenmicro/EasyMultiOmics.

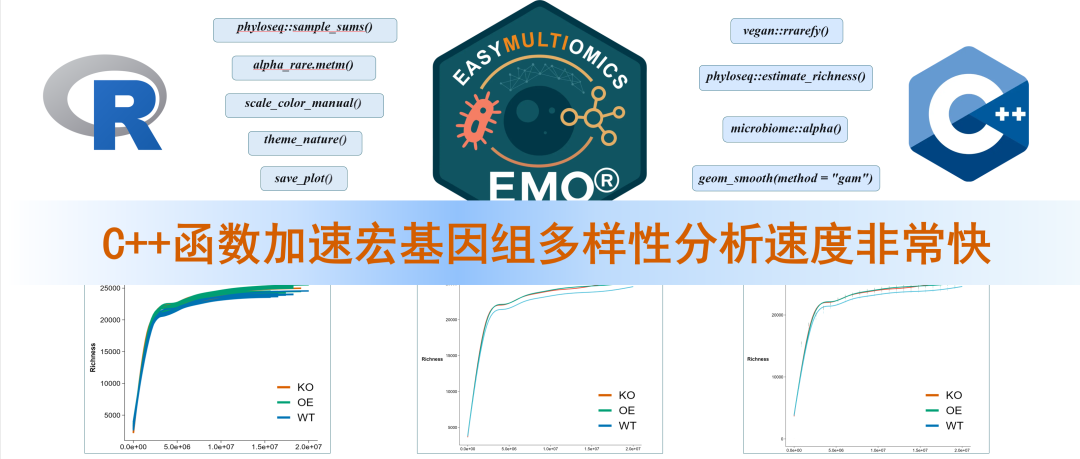
In actual scientific research, many researchers engaged in microbial multi-omics analysis encounter the same problem: some analysis workflows (especially those involving large-scale OTU matrices and multiple index calculations) are extremely slow, often requiring hours or even longer, severely affecting the efficiency of data exploration and result iteration, such as in the analysis of species rarefaction curves in metagenomics. To address this pain point, we introduced C++ computational logic into the conventional R analysis workflow, with all core numerical calculations handled by underlying C++ (via libraries like Rcpp/RcppEigen), preserving the readability and usability of R code while maximizing the reduction of computation time, achieving a 100-fold speedup in rarefaction curve calculations. Thanks to this, in scenarios with large OTU/species tables and numerous samples, alpha rare.metm can significantly shorten runtime while ensuring result consistency, greatly enhancing the feasibility and efficiency of rarefaction curve analysis under large data volumes.
Note: Our R package has undergone internal code optimization recently, so remember to update before use.
Executing alpha diversity rarefaction curve calculations with alpha_rare.metm
The drawing of the rarefaction curve is implemented based on the custom function alpha_rare.metm. This function takes a phyloseq object as the core input (also supports independent input of OTU/tax/map), performing repeated rarefaction sampling of samples at different sequencing depths and calculating various alpha diversity indices (such as species richness, ACE, Shannon, Simpson, etc.), ultimately outputting:
-
Rarefaction curves at the individual sample level;
-
Rarefaction curves averaged by group after grouping;
-
Grouped rarefaction curves with standard deviation error bands.
In implementation, this function uses the phyloseq object as the core data structure, looping through and calling C/C++ functions encapsulated by Rcpp/RcppEigen such as vegan:rrarey, estimate richness, microbiome.alpha to complete rarefaction sampling and numerical calculations of diversity indices, with R only responsible for process control and result visualization. This R-C++ mixed programming approach significantly enhances the computational efficiency of large-scale OTU data analysis.
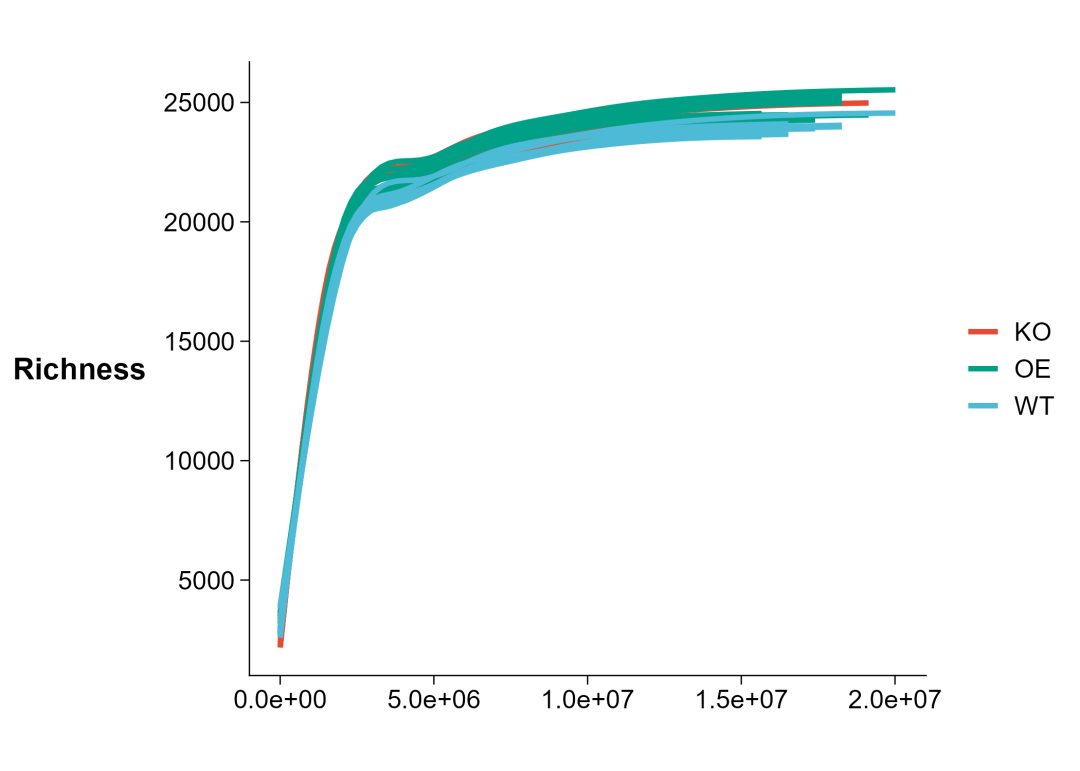
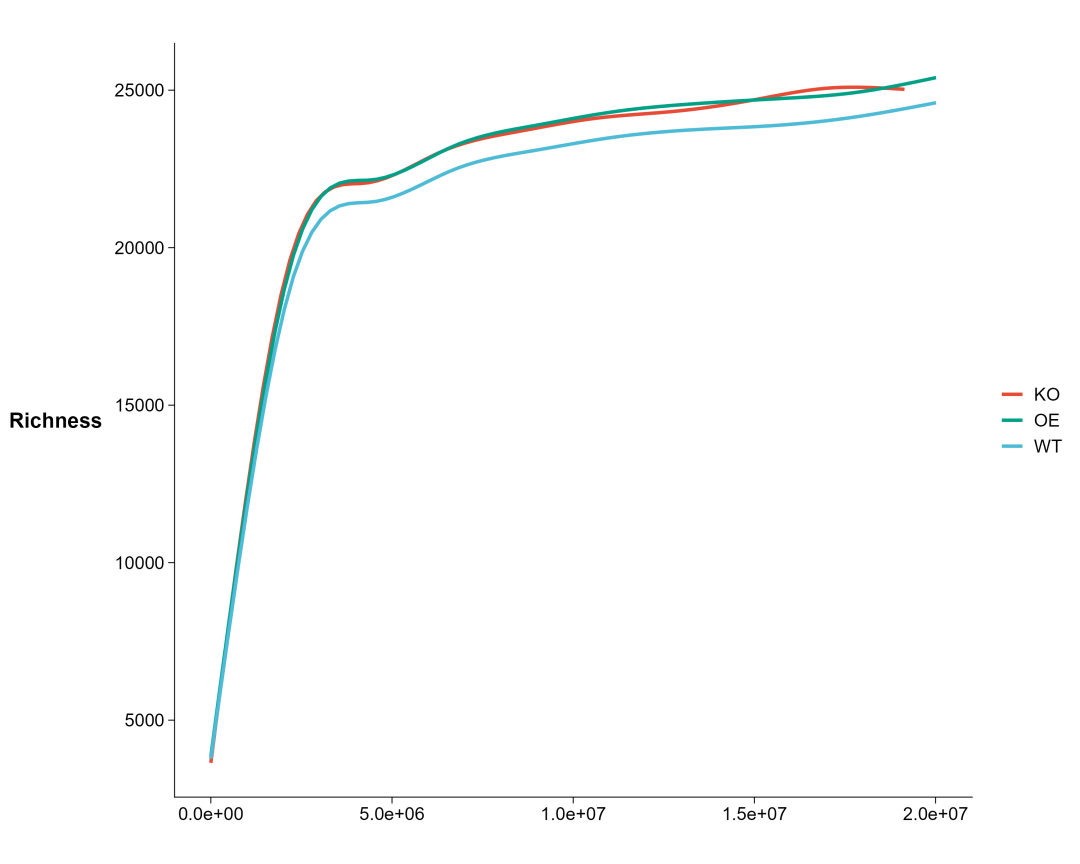
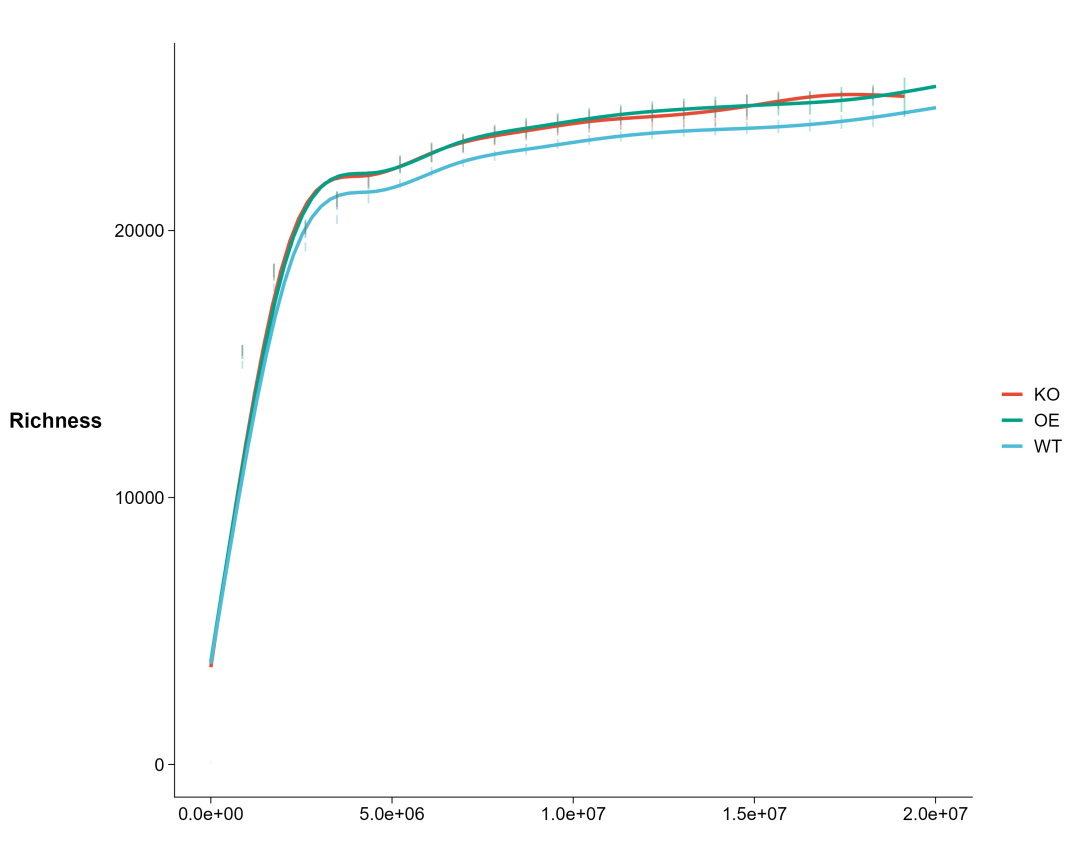
Complete Code
# ===================== Metagenomic Species Analysis (Based on EasyMultiOmics) =====================rm(list = ls())
## ===================== 0. Basic Setup & Load Packages =====================# BiocManager::install("MicrobiotaProcess")library(EasyMultiOmics)library(phyloseq)library(tidyverse)library(ggClusterNet)library(ggrepel)library(ggsci)library(openxlsx)library(fs)library(microbiome)library(vegan)
## ===================== 1. Read phyloseq object & Basic Information =====================# Modify to your own ps_bac.rds pathps.micromap <- sample_data(ps.micro)head(map)
# Simple checksample_sums(ps.micro)phyloseq::tax_table(ps.micro) %>% head()
# Number and order of groupsgnum       <- phyloseq::sample_data(ps.micro)$Group %>% unique() %>% length()axis_order <- phyloseq::sample_data(ps.micro)$Group %>% unique()
# Group color col.g <- get_group_cols(axis_order, palette = "npg")col.gscales::show_col(col.g)
# Theme & Colorpackage.amp()res     <- theme_my(ps.micro)mytheme1 <- res[[1]]mytheme2 <- res[[2]]colset1  <- res[[3]]colset2  <- res[[4]]colset3  <- res[[5]]colset4  <- res[[6]]
# Main result path (modify as needed)mg_path <- "working_path"dir_create(mg_path)
## ===================== 2. Alpha Diversity Analysis ===========mg_alpha_path <- file.path(mg_path, "01_alpha_diversity")dir.create(mg_alpha_path, recursive = TRUE, showWarnings = FALSE)
alpha_xlsx_path <- file.path(mg_alpha_path, "alpha_diversity_results.xlsx")
if (file.exists(alpha_xlsx_path)) {  mg_alpha_wb <- openxlsx::loadWorkbook(alpha_xlsx_path)} else {  mg_alpha_wb <- openxlsx::createWorkbook()}
rare_step <- mean(phyloseq::sample_sums(ps.micro)) / 20
res_rare <- alpha_rare.metm(  ps     = ps.micro,  group  = "Group",  method = "Richness",  start  = 100,  step   = rare_step)
p2_1 <- res_rare[[1]] +  scale_color_manual(values = col.g) +  theme_nature()
raretab <- res_rare[[2]]
p2_2 <- res_rare[[3]] +  theme_nature()
p2_3 <- res_rare[[4]] +  theme_nature()
# ---- Save rarefaction curve plots ----save_plot2(p2_1, mg_alpha_path, "alpha_rarefaction_individual", width = 7,  height = 5)save_plot2(p2_2, mg_alpha_path, "alpha_rarefaction_group",      width = 10, height = 8)save_plot2(p2_3, mg_alpha_path, "alpha_rarefaction_group_sd",   width = 10, height = 8)
# ---- Save rarefaction data ----write_sheet2(mg_alpha_wb, "rarefaction_data", raretab)openxlsx::saveWorkbook(mg_alpha_wb, alpha_xlsx_path, overwrite = TRUE)
Outlook
We have established a learning and discussion group for EasyMultiOmics users to facilitate the exchange of usage experiences, raise questions, and share insights. We welcome you to scan the code to join and learn together!
Technical Support Team: Niu Guoqing, Teng Xinyang, Zhou Kecheng, Ma Jie, Shi Jingjing, Liu Qingze
As our WeChat discussion group has reached 200 members and cannot accept new members directly, if you are interested in joining the group for discussion, please scan to add my personal WeChat, and I will invite you to the group as soon as possible.

At the same time, we will regularly publish the latest tweet links on this public account every week; and share the latest literature and academic conference information related to multi-omics from time to time. Stay tuned!
Root Interaction Biology Research Laboratory Introduction
The Root Interaction Biology Research Laboratory is a research group within Academician Shen Qirong’s team that focuses on root interactions, led by Professor Yuan Jun, mainly focusing on: 1. The role of plant-microbe interactions in overcoming continuous cropping obstacles; 2. Integration analysis of environmental microbial big data; 3. Development and application of environmental metabolomics to analyze microbial processes. The research group has published multiple articles in journals such as Nature Communications, ISME J, Microbiome, SCLS, Protein & Cell, Fundamental Research, SBB, New Phytologist, iMeta, PCE, JAFC (cover), Horticulture Research, SEL (cover), including 7 ESI highly cited papers.
Written by: Ma Jie, Liu Qingze, Niu Guoqing
Reviewed by: Wen Tao, Yuan Jun