The software development of DSP systems usually includes the simulation phase and the emulation phase. Simulation begins at the initial stage of design, requiring no hardware support; it can be performed using a software simulator on a computer to achieve preliminary debugging of the code. Emulation involves downloading the code to the target board for debugging and running, generally requiring the use of JTAG. One end of the JTAG is connected to the DSP, and the other end is connected to the host, enabling code downloading, code execution, variable viewing, and variable setting.
However, debugging multiple DSP systems using JTAG is inconvenient due to: ① multiple DSPs requiring multiple JTAGs and multiple hosts; ② viewing variables through JTAG usually necessitates pausing the DSP operation.
The author previously developed a channel board with multiple DSPs for a certain base station system: each channel board has 1 MPC860 and 3 TMS320VC5416 (referred to as “VC5416”). The MPC860 is connected to each VC5416 via the HPI interface, with each VC5416 occupying a chip select of the MPC860 and utilizing different address spaces of the MPC860. The logical structure of the channel board is shown in Figure 1.
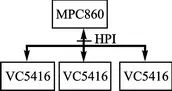
Figure 1: Logical Structure of the Channel Board
For such a structure, using JTAG for debugging would require 3 JTAGs and 3 hosts, and the debugging personnel would need to frequently operate one of the three hosts, which is quite inconvenient. In response to this structure, the author explored a method that does not use JTAG, requiring only one host to achieve debugging of the codes for 3 DSPs, making the entire debugging process simple and fast.
This article introduces the principles of HPI and focuses on how to implement DSP code downloading, code execution, and variable viewing.
1. Introduction to the HPI Interface
1.1 Overview of HPI
The HPI of the DSP is an 8-bit or 16-bit parallel interface primarily used for interfacing with the master device or master processor (referred to as “host”). The DSP has a certain amount of dual-port RAM that can be accessed by both the DSP itself and the host through the HPI interface, thereby enabling communication between the host and the DSP.
Through the HPI interface, the host can also access the VC5416 registers. The VC5416 supports both 8-bit HPI interface (referred to as “HPI8”) and 16-bit HPI interface (referred to as “HPI16”), with the latter being an enhanced version of the former. Unless otherwise specified, HPI in this article refers to HPI16.
1.2 HPI Loading Principle
The internal ROM of the VC5416 is hard-coded with TI’s bootloader, used to load user code from external memory into the internal RAM and execute it during power-on reset. The VC5416 supports various boot modes, such as HPI boot, parallel EEPROM boot, parallel I/O boot, serial port boot, etc. The boot mode adopted by the DSP depends on the hardware design.
After powering on and resetting the VC5416, it first checks the MP/MC pin. If MP/MC = “0”, it indicates that the internal ROM is used for booting. At this point, the DSP starts executing TI’s internal boot program from address 0xFF80. Once in the boot program, the HINT pin goes low, and it begins to check whether INT2 is low (valid). If valid, it enters HPI boot mode; otherwise, it checks the INT3 pin. If there is an INT3 interrupt request, it enters serial boot mode; otherwise, it enters parallel boot mode. The boot program flow is depicted in Figure 2.
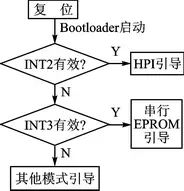
Figure 2: Boot Mode Discrimination Flow
In this system, the bootloader is used for booting. To do this, the MP/MC pin should be connected to a low level, and the HINT and INT2 pins should be connected together to ensure that the bootloader can detect INT2 as valid. When it detects a low level, it enters HPI boot mode. Once in HPI boot mode, the bootloader repeatedly checks the content of the 0x7f unit (the contents of the 0x7e and 0x7f units are cleared at the start of bootloader execution). When it detects that the content is not zero, it assigns the content of 0x7e to XPC and the content of 0x7f to PC, jumping to the address pointed to by PC to execute the user code. This achieves the program loading startup of the VC5416.
2. Generation and Downloading of User Code
In this system, the MPC860 acts as the host required for the loading and startup of the 3 VC5416s.
2.1 User Code Generation
After the project files (including library files, configuration files, and source code files) are compiled and linked by CCS, an .out file is generated. The .out file is in the Common Object File Format (COFF) and cannot be used for HPI boot loading, thus requiring format conversion. This conversion can be performed on the MPC860 or on the local computer. In this implementation, the latter method was chosen. The conversion work consists of two steps:
① Convert the COFF format file to Hex format, which requires the file format conversion tool hex500.exe.
② Convert the Hex format file to Bin format. The Hex file generated by hex500.exe is in ASCII format and cannot be used for HPI boot loading; it needs to be converted to binary (Bin) format. The conversion program hex2bin.exe is implemented by programming.
2.2 User Code Download
The Bin format file must be uploaded to the MPC860 first, and then the MPC860 writes it into the corresponding RAM area of the DSP (the specific location is determined by the configuration file in the project). The Bin file can be uploaded from the local computer to the MPC860 in various ways, either through programming or using existing tools (such as ftp).
The address specified in the configuration file is the address in the DSP address space, while the writing of user code is performed by the MPC860, so the address in the DSP address space must be converted to the address in the MPC860 address space. The DSP unit width is 16 bits, which is twice that of the MPC860, so the conversion formula is:
MPC860 address space address = DSP address space address × 2 + DSP chip select address
3. Running User Code
To run the user code, simply write the entry address of the code into the DSP’s 0x7e and 0x7f units. There are two methods for setting the entry address: one is the address of c_int00, which can be obtained from the compiled .map file; however, the address of c_int00 may change whenever the file is modified. This means that any modification to the DSP code requires a corresponding modification in the MPC860 code, which is quite inconvenient. The other method is the power-on reset interrupt handler entry address. For the VC5416, the address stored at the interrupt handler entry is the interrupt handler function, and the power-on reset interrupt handler function is c_int00, so this method is effectively equivalent to the first method, but since the power-on reset interrupt handler entry address (determined by the configuration file) is fixed, the value of the entry address remains unchanged. This article chooses the latter.
4. Variable Viewing
Variable viewing is a fundamental means of program debugging, especially in the later stages of system debugging when bugs become fewer and more hidden; viewing state variables is the most commonly used debugging method.
Through the HPI interface, the host can access the RAM and registers of the DSP. Therefore, as long as the address of the variable is known, the value of the variable can be viewed. The addresses of the variables are recorded in the symbol table, and there are two methods to obtain the symbol table.
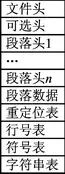
Figure 3: Structure of COFF File
① Export from the .out file generated by CCS compilation. The COFF file structure contains the symbol table segment and string segment, as shown in Figure 3. According to the COFF file structure, the entire symbol table can be exported.
② Export from the .map file generated by CCS compilation. By configuring the CCS compilation options, a .map file can be generated. The .map file contains the entire symbol table, including user variables, user functions, system variables, system functions, etc., with a considerable number (over a thousand). However, the debugging personnel only need to care about user variables, and this part is not many, so the symbol table can be filtered. The filtering implementation idea is that the symbol table of user variables (divided into initialized variables .data and uninitialized variables .bss) can only appear in the object files (.obj) generated from the source code compilation, and the symbol tables of the .data and .bss segments of different object files are detailed in the .map file.
Below is an example of a .map file generated from a compiled project. The project includes a source program mcbsp.c, and the .bss segment of the compiled mcbsp.obj starts from address 0x4080 and ends at address 0x41e2, containing the variables mcbspq, sp, xmt_cnt, rcv_cnt, start_demodule, with lengths of 0x158, 2, 2, 2, and 4 respectively.
.bss 1 00004080 000002e6 UNINITIALIZED
00004080 00000162 mcbsp.obj(.bss)
00004080 _mcbspq
000041d8 _sp
000041da _xmt_cnt
000041dc _rcv_cnt
000041de _start_demodule
000041e2 _HWI_dispatchTab
Create a new symbol table, where each record corresponds to a variable. Each record contains three items: variable name, starting address, and length. The symbol table is downloaded to the MPC860 along with the user code. When viewing a variable, the starting address and length of the variable can be obtained by querying the symbol table based on the variable name, and the contents of the corresponding address space can be read. Since the filtered symbol table is quite small (only a few dozen), the download and query speeds are very fast. This method was adopted in the system implementation.
Setting variables is similar to the process of viewing variables and will not be elaborated on.
Conclusion
The debugging method described above fully utilizes the features of the VC5416 and MPC860, achieving software debugging of multiple DSPs without using JTAG; the entire debugging process is simple and fast, making it a good method.