
Click on the above blue text to follow us
Click on the above “Miller’s Voice” → Click the top right corner“…” → Select “Set as Favorite “★ ”, to mark Miller’s Voice as a favorite, making it easier to find us in the future!
This article is authorized for reprinting by “Medical Coffee Meeting”
The intraclass correlation coefficient (ICC) is commonly used to evaluate the similarity of a certain quantitative attribute among individuals with a defined kinship (such as twins, siblings, etc.). It is also applied to assess the repeatability or consistency of different measurement methods or raters for the same quantitative measurement results. In diagnostic tests, we often use the ICC metric to evaluate the repeatability of different researchers diagnosing the same set of test results.
1. Problem and Data
Assume two researchers measure the blood glucose levels of 25 subjects using the same diagnostic test. Some of the raw data is shown in Table 1.
Table 1: Partial Raw Data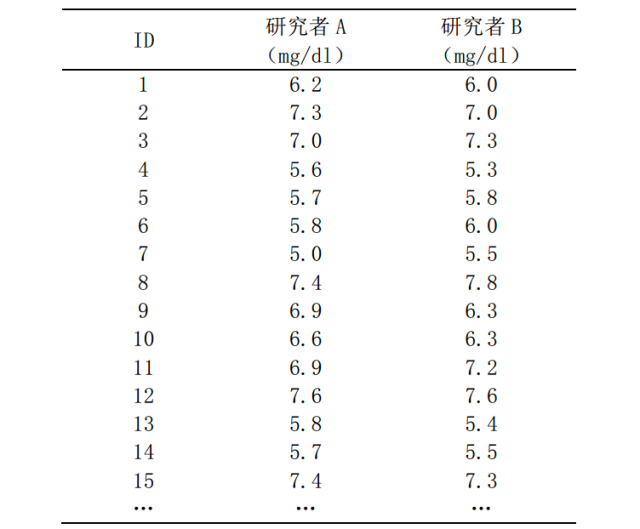
Of course, to evaluate the repeatability of this diagnostic test, we can set a diagnostic cutoff point, artificially converting blood glucose levels into a binary variable, and then use the Kappa analysis discussed earlier to make judgments. However, converting continuous variables into binary variables results in a loss of information. So what should we do?
Next, we will introduce the analysis method of the intraclass correlation coefficient for diagnostic tests, taking SPSS statistical software as an example.
2. SPSS Analysis Method
1. Data Entry into SPSS

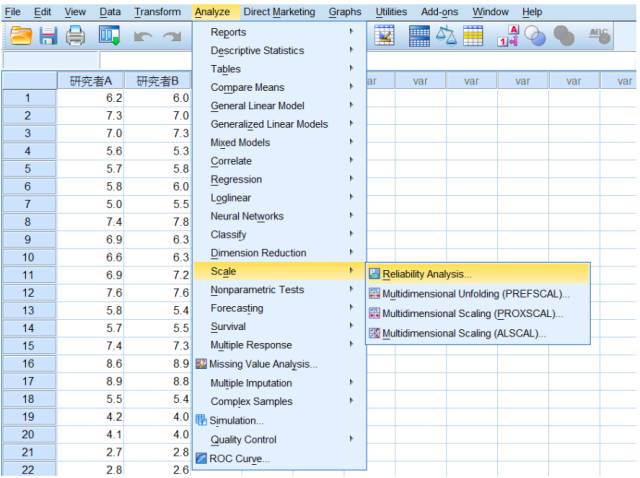
2. Select Analyze → Scale → Reliability Analysis
3. Option Settings
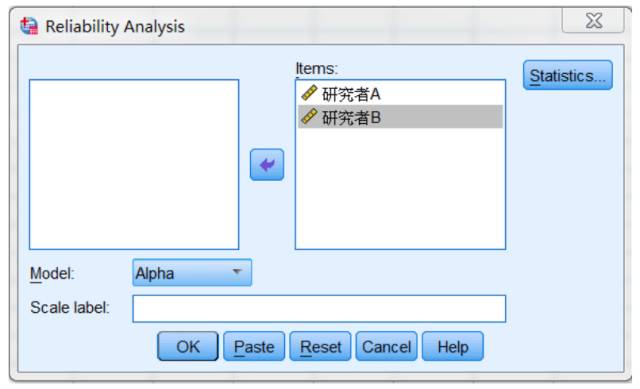
(1) Main Dialog Box Settings
We will place the two groups of data to be observed in the Items box.
(2) Statistics Settings
Click on Statistics and select Intraclass correlation coefficient.
Model settings:
There are three models for calculating the intraclass correlation coefficient: One-way random, Two-way random, and Two-way mixed. Among them, the One-way random model is used to test whether the means of each subject are completely equal and should not be used to evaluate the repeatability of diagnostic tests. The Two-way random model and the Two-way mixed model are similar, as they both consider the influence of subjects and researchers and can theoretically be used for evaluating the repeatability of diagnostic tests. However, there are differences in the inference scope of the results of these two models. The results of the Two-way random model can be inferred to all similar, possible researchers; while the results of the Two-way mixed model are limited to the given researchers and cannot be inferred to others.
Therefore, for evaluating the repeatability of diagnostic tests, the Two-way random model should be chosen.
Evaluation type settings:
The Two-way random model has two calculation types: absolute agreement and consistency. Absolute agreement considers the systematic error of researchers and can be used to measure whether different researchers give the same absolute values to subjects. In contrast, consistency does not consider the systematic error of researchers and is only suitable for evaluating whether the scores of different researchers are highly correlated.
Specifically, if we have two groups of results: 2, 4, 6 and 4, 6, 8, the absolute values are not equal, and calculating the ICC value using absolute agreement yields only 0.67 (only the absolute values 4 and 6 are the same); however, these two groups of results are highly correlated, and calculating the ICC value using consistency yields 1 (these two sets of numbers are highly correlated).
For evaluating the repeatability of diagnostic tests, we want different researchers to obtain consistent results, rather than just being “highly correlated.”Therefore, we should choose the absolute agreement calculation type.
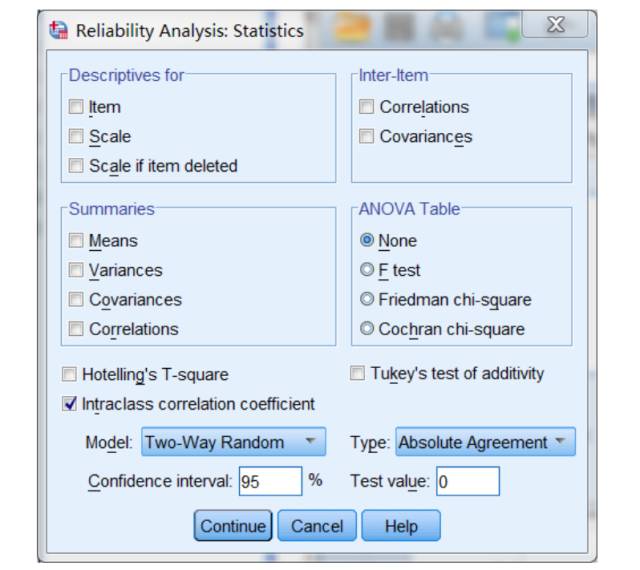
→ Continue→ Return to Main Interface→ OK
3. Result Interpretation
The calculation results of the intraclass correlation coefficient in SPSS have three tables, and we only need to focus on one of them, as shown below:
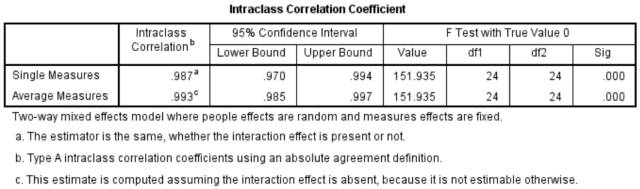
This table provides two estimates of the intraclass correlation coefficient: Single Measures and Average Measures. What is the difference between these two estimates? The analysis unit of Single Measures is the result of each researcher, which can estimate the situation of a single researcher. In contrast, the analysis unit of Average Measures is the mean of multiple researchers’ results, which is limited in its application.
Therefore,we judge the intraclass correlation coefficient for the evaluation of the repeatability of the diagnostic test based on the estimate of Single Measures, which is ICC=0.987 (P<0.001).
4. Writing the Conclusion
Generally speaking, the ICC value ranges from 0 to 1. For diagnostic tests, if the ICC value is less than 0.4, we consider the repeatability of the diagnostic test to be poor; if the ICC value is greater than 0.75, then the repeatability of the diagnostic test is good.
In summary, the ICC value for this blood glucose level diagnostic test is 0.987 (P<0.001), indicating good repeatability.
Recommended Reading
1. McGraw K O, Wong S P. Forming inferences about some intraclass correlation coefficients. [J]. Psychological Methods, 1996, 1(4):390-390.
2. Shrout P E, Fleiss J L. Intraclass correlations: uses in assessing rater reliability. [J]. Psychological Bulletin, 1979, 86(2):420.
Disclaimer:

The original or reprinted content published on this WeChat public platform does not represent the views or positions of Miller's Voice. The content related to drug use, disease diagnosis and treatment is for reference only.

—END—

Miller's Voice Editorial Department
Miller's Voice, always with you

Follow Miller's Voice
Stay updated on new developments in anesthesia and perioperative fields
Miller's Voice, one day, your voice will be heard