👉Introduction
Delve is the most widely used debugger in Go. This article introduces debugging in Go based on Delve. If you are frustrated with log-based debugging, you might want to check this out. After reading the full article, you can also participate in the Lunar New Year red envelope cover lottery at the end!
👉Table of Contents
1.2 Disabling Inlining and Optimizations
1.3 Defining Locations in dlv
1.4 Supported Expressions in dlv
1.5 Ways to Start Debugging with dlv
2 Related Commands in dlv
2.2 Running Related Commands
2.3 Breakpoint Related Commands
2.4 Variable and Memory Viewing
2.6 Query Related Commands
3.2 Variable and Memory Viewing
3.3 Goroutines and Stack Related
Go language supports several debuggers including GDB, LLDB, and Delve. Among them, GDB is the earliest supported debugging tool, while Delve is specifically designed for Go. When debugging Go programs, Delve is a better alternative to GDB as it understands Go’s runtime, data structures, and expressions better than GDB. Its source code is located in the Delve repository.
1.1 Installing dlv
See dlv installation: https://github.com/go-delve/delve/tree/master/Documentation/installation
1.2 Disabling Inlining and Optimizations
To debug with dlv, you need to disable the compiler’s inlining and optimizations:
-
For Go 1.10 and later, specify -gcflags=”all=-N -l” during compilation
-
For Go versions before 1.10, specify -gcflags=”-N -l” during compilation
1.3 Defining Locations in dlv
Most commands in dlv involve locations (referred to as locspec below), and the definition of locations supports the following methods:
list aa/aa.go:15 // Print 5 lines of code around aa.go:15
-
Specify by package name and function name, formatted as package.function, for example:
trace content-service/iteminfo.GetItemV2 // Add a trace breakpoint for the GetItemV2 function in the content-service/iteminfo package
-
Specify by absolute or relative position in the current file, formatted as lineNo or +offset/-offset, for example:
./iteminfo/itemv2.go:52 (hits goroutine(970048):1 total:1) (PC: 0x22e0f46)
=> 52: func (i *ItemInfoServiceImpl) GetItemV2(ctx context.Context,
53: req *iteminfopb.GetItemV2Request, rsp *iteminfopb.GetItemV2Reply) (err error) {
57: err = i.getItemV2Impl(ctx, req, rsp)
(dlv) b 55 // After hitting the breakpoint, add a breakpoint again at line 55 of this file, with id 2
Breakpoint 2 set at 0x22e0f73 for iteminfo.GetItemV2() ./api/iteminfo/itemv2.go:55
(dlv) b +5 // After hitting the breakpoint, add a breakpoint again at line 57, which is 5 lines after 52, with id 3
Breakpoint 3 set at 0x22e0f78 for iteminfo..GetItemV2() ./api/iteminfo/itemv2.go:57
(dlv) b -5 // After hitting the breakpoint, add a breakpoint again at line 47, which is 5 lines before 52, with id 4
Breakpoint 4 set at 0x22e0ecc for iteminfo.getItemV2Impl() ./api/iteminfo/itemv2.go:47
1.4 Supported Expressions in dlv
Currently, dlv supports expressions (referred to as expr below), including:
-
Unary and binary operations for basic types (++ and — are not supported), comparison operations, etc., such as p 1+1, p 1<<2, p 1<2 etc.;
-
Type conversions, including conversions between numeric types, conversions between string and []byte, etc., such as p float32(1), p []byte(“aaa”);
-
Member access, including access to struct, map, and array type members, such as p mp[“k”], p arr[1]. Note that by default, only 2 levels of data are printed for structs; to access multi-level data, you need to use member access;
-
Pointer-related operations, including obtaining access addresses, dereferencing pointers, etc., such as p x.i, p *(x.i) etc.
-
Some built-in functions, including cap, len, etc., such as p len(“aaa”);
-
Interface type assertions, such as p iface1.(*struct astruct).B or p iface1.(data).B, note that the two expressions are equivalent;
-
Some built-in variables, such as p runtime.curg.sched, specific common parameters can be seen in the following table:
| Built-in Variables |
Description |
| runtime.defaultGOROOT |
Go default root path |
| runtime.buildVersion |
Go version number of the built code |
| runtime.argc, runtime.argv |
argc, argv information |
| runtime.gomaxprocs |
Number of logical processors |
| runtime.ncpu |
Number of CPUs |
| runtime.curg |
Information about the current thread, refer to curg definition for details |
| time.Local |
Current timezone information |
| ………. |
|
Note that the above p command is a shorthand for the print command; for specifics, refer to section 2.3.1
As follows:
Breakpoint 1 set at 0x4bf4a7 for main.main() ./main.go:48
> main.main() ./main.go:48 (hits goroutine(1):1 total:1) (PC: 0x4bf4a7)
50: mp := make(map[string]string)
52: if reflect.TypeOf(intData).AssignableTo(reflect.TypeOf(mp).Elem()) {
(dlv) p -a // Unary operator, print negative a
(dlv) p %3.2f float32(a) // Forced type conversion, print the result after forced type conversion
(dlv) p []byte(“aaa”) // Conversion between string and byte, print []byte type “aaa”
[]uint8 len: 3, cap: 3, [97,97,97]
(dlv) p x.i // Member access, print the value of x.i
(dlv) p &x.i // Get variable address, print the address of x.i
(dlv) p *((*int)(0xc000193e30)) // Pointer dereferencing, print the value of x.i
(dlv) p len(“abc”) // Built-in function call, print the length of abc
(dlv) p animial.(*main.Cat).s // Interface assertion
(dlv) p animial.(data).s // Interface assertion, member access
(dlv) p runtime.curg.sched // Access built-in variable, print the value of runtime.curg.sched
runtime.gobuf {sp: 0, pc: 4438237, g: 824633745824, ctxt: unsafe.Pointer(0x0), ret: 0, lr: 0, bp: 0}
1.5 Ways to Start Debugging with dlv
1.5.1 Optional Parameters When Starting Debugging
-
Parameter passing, when passing parameters during debugging, you need to use — (its main function is to separate commands and parameters). As follows:
[root@b0f67f8932a2 /mnt/code/gotest667]# dlv exec main — -cfg config.yaml // Pass parameter config.yaml for cfg
You can also specify parameters when restarting, as follows:
[root@b0f67f8932a2 /mnt/code/gotest667]# dlv exec main
Type ‘help’ for list of commands.
(dlv) r -cfg config.yaml // At this point, no need for —
Process restarted with PID 29548
-
–headless, –listen start a debug server, set the debug server listening address, –headless, –listen are usually used in conjunction with dlv attach for remote debugging.
Currently, the testing environments (testing, pre) of 123 are connected to the devCloud network, allowing for remote debugging. Refer to section 1.5.3 for operational steps
1.5.2 Ways to Start Debugging
Note that the flags parameter in this section refers to the parameters in 1.5.1.
By default, dlv debug will look for main.main in the current directory, compile it, and start debugging. Its format is as follows:
dlv debug [package] [flags]
Note that you can specify the package to debug using package
In contrast, dlv exec requires specifying an executable program. As follows:
dlv exec <path/to/binary> [flags]
dlv provides support for attaching to processes, allowing you to debug running processes. Considering that the network between the 123 testing environment and devCloud has been opened, this mechanism can facilitate remote debugging, as follows:
The steps for remote debugging between 123 and devCloud are:
-
123 starts the debug server:
-
devCloud connects to the remote server for debugging:
root@b0f67f8932a2 /mnt/code/content_service]# dlv connect xx.xx.xx.xx:2346 // Connect to the remote debug server
Type ‘help’ for list of commands.
git.code.oa.com/ForwardIndex/content-service/api/service/iteminfo.(*ItemInfoServiceImpl).GetItemV2
git.code.oa.com/ForwardIndex/content-service/api/service/iteminfo.(*ItemInfoServiceImpl).GetItemV2Data
Note that devCloud can only connect to the testing and pre-release environments of 123, and cannot connect to the production environment. The office network cannot connect to the 123 environment
dlv also provides support for core dump debugging, allowing for easy debugging and analysis of online core dumps to identify related issues. Its usage is as follows:
dlv core <executable> <core> [flags]
// executeable refers to the executable program, core refers to the related core dump file
The general steps for using dlv for core dump debugging in Go are:
1. Modify the operating system limits, omitted. Currently, related images have already been configured;
2. Set GOTRACEBACK, for 123 service set the environment variable GOTRACEBACK=crash, as follows:
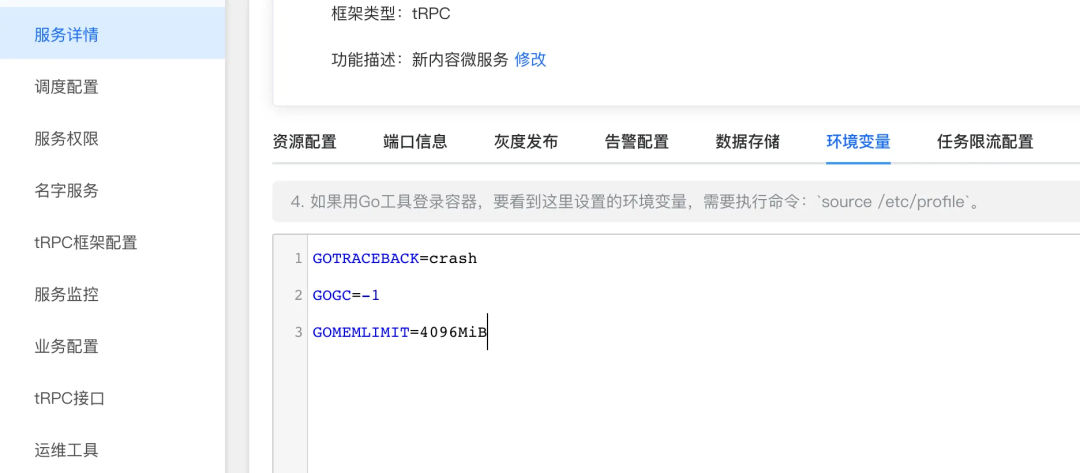
Note that if the recovery mechanism is enabled at this time, panic within the coroutine will not cause a core dump; at this time, you can check the related reasons in /usr/local/app/serverHistory.log. Note that by default, core dump files will be located in the directory where the executable program resides. If you need to change the location, please modify /proc/sys/kernel/core_pattern
3. Use bt to check the call stack and locate the possible location of the issue.
[root@b0f67f8932a2 /mnt/code/gotest667]# dlv core main core.28183
Type ‘help’ for list of commands.
0 0x0000000000460fe1 in runtime.raise
at /usr/local/go1.20/go/src/runtime/sys_linux_amd64.s:154
10 0x0000000000497358 in gotest667/aa.(*Xxx).TestC // The user logic closest to panic is the most likely cause of panic
11 0x0000000000497358 in main.main
12 0x0000000000434507 in runtime.main
at /usr/local/go1.20/go/src/runtime/proc.go:250
13 0x000000000045f6c1 in runtime.goexit
at /usr/local/go1.20/go/src/runtime/asm_amd64.s:1598
4. Use the frame command to move to the relevant stack frame and collect various data at the time of the issue using args -v, locals -v, etc.
(dlv) frame 10 // Move to the possible function stack frame
> runtime.raise() /usr/local/go1.20/go/src/runtime/sys_linux_amd64.s:154 (PC: 0x460fe1)
Warning: debugging optimized function
Frame 10: ./aa/aa.go:26 (PC: 497358)
22: func (x *Xxx) TestC(i int) {
30: func (x *Xxx) TestE() {
(dlv) locals -v // View local variables
j = (unreadable could not find loclist entry at 0x7076 for address 0x497358)
(dlv) args -v // View function parameters
i = (unreadable could not find loclist entry at 0x6ff1 for address 0x497358)
(dlv) vars -v gotest667/aa.y // View global variables
gotest667/aa.y = []int len: 3, cap: 3, [4,4,4]
5. Based on the existing data, locate and analyze the issue.
2.1 Configuring dlv
dlv configuration includes two default methods: command-based and configuration file-based. Note that command-based modifications are session-level, and restarting the debug-related configurations will result in loss of changes.
On Linux, the dlv configuration file is typically located at $HOME/.config/dlv/config.yml, and common configuration items include:
substitute-path: // Used to configure code lookup and replacement paths. For example, code released on Mac, debugging in devcloud
– {from: $HOME/go/src/content-service, to: /mnt/code/content_service}
max-string-len: 99999 // Maximum length for printing strings; if the full value cannot be printed during debugging, modify this variable
max-array-values: 99999 // Maximum length for printing arrays, etc.
command: [“alias”] // Set alias for command “command” as “alias”, for example display: [“dis”]
Corresponding commands include:
config -list // List all configuration items
config -save // Save configuration information to file
config max-string-len 9999 // Set maximum string length for printing to 9999
config max-array-values 9999 // Set maximum array length for printing to 9999
config substitute-path <from> <to> // Set code lookup and replacement paths. Note that if you do not execute the save command, the related configuration will not be updated
Using substitute-path as an example (different paths for Mac compilation and devCloud debugging), the comparison before and after configuration is as follows:
Before configuration:
(dlv) b api/service/iteminfo.(*ItemInfoServiceImpl).GetItemV2
Breakpoint 1 set at 0x183d006 for api/service/iteminfo.(*ItemInfoServiceImpl).GetItemV2() api/service/iteminfo/itemv2.go:51
> api/service/iteminfo.(*ItemInfoServiceImpl).GetItemV2() api/service/iteminfo/itemv2.go:51 (hits goroutine(6999):1 total:1) (PC: 0x183d006) // At this point, hitting the breakpoint did not print any information
Warning: debugging optimized function
(dlv) b api/service/iteminfo.(*ItemInfoServiceImpl).GetItemV2
Breakpoint 1 set at 0x183d006 for api/service/iteminfo.(*ItemInfoServiceImpl).GetItemV2() ./api/service/iteminfo/itemv2.go:51
> api/service/iteminfo.(*ItemInfoServiceImpl).GetItemV2() ./api/service/iteminfo/itemv2.go:51 (hits goroutine(5462):1 total:1) (PC: 0x183d006) // Hitting the breakpoint printed relevant debugging information
Warning: debugging optimized function
=> 51: func (i *ItemInfoServiceImpl) GetItemV2(ctx context.Context,
52: req *iteminfopb.GetItemV2Request, rsp *iteminfopb.GetItemV2Reply) (err error) {
54: err = i.getItemV2Impl(ctx, req, rsp)
2.2 Running Related Commands
2.2.1 restart, exit
restart, exit are used to restart the process and exit debugging, respectively, with the following command formats:
restart // Restart the debugged process, at this point debugging has not yet started, and the continue command needs to be run
Note that restart only restarts the process and does not actually start debugging. To start debugging, continue needs to be used
Related aliases (abbreviations) are as follows:
| Command |
Abbreviation |
Description |
| restart |
r |
Restart the debug process |
| exit |
q |
Exit debugging |
2.2.2 continue
continue will run until a breakpoint, location, or program ends, with the following command format:
Note that the continue command supports running directly to a certain line in a file or a certain function
The alias for the continue command is: c.
Its usage is as follows:
(dlv) c main.go:48 // Run debugging until main.go:48
Breakpoint 1 set at 0x4bf4a7 for main.main() ./main.go:48
> main.main() ./main.go:48 (hits goroutine(1):1 total:1) (PC: 0x4bf4a7)
=> 48: x.TestB() // At this point, it will pause running at line 48 of main.go
2.2.3 next, step, step out
The next command is used for single-step execution, and when a function is called, it does not enter the function for debugging. The corresponding step command can enter the called function for debugging, while step out is used to exit the debugged function. As follows:
| Command |
Abbreviation |
Description |
| next |
n |
Single-step debugging |
| step |
s |
Single-step debugging (enter debugging function) |
| step out |
so |
Single-step debugging (exit debugging function) |
The effects are slightly different.
2.3 Breakpoint Related Commands
2.3.1 Breakpoints in dlv
Breakpoints in dlv include the following types:
Trace breakpoints are used to print relevant prompt information when hitting a breakpoint. They are useful when viewing implementations or call paths.
The command format for trace breakpoints is as follows:
// name is the name of the breakpoint
// Omitting all parameters will default to adding a trace breakpoint at the current line
The effect is as follows:
(dlv) trace test api/service/iteminfo.(*ItemInfoServiceImpl).GetItemV2 // Set a trace breakpoint named test
Tracepoint test set at 0x1843446 for api/service/iteminfo.(*ItemInfoServiceImpl).GetItemV2() ./api/service/iteminfo/itemv2.go:51
> goroutine(2935359): [test] api/service/iteminfo.(*ItemInfoServiceImpl).GetItemV2((“*api/service/iteminfo.ItemInfoServiceImpl”)(0x3da4940), context.Context(*context.valueCtx) 0xbeef000000000108, (“*fwd_content_service_iteminfo.GetItemV2Request”)(0xc02ebbf5c0), (“*fwd_content_service_iteminfo.GetItemV2Reply”)(0xc06eae7b30)) // Trace breakpoint hit, relevant information is printed, program does not pause
>> goroutine(2935359): => ((unreadable empty OP stack))
Note that trace breakpoints will only print relevant information and will not pause program execution
Break breakpoints (abbreviated as b) will pause the program execution when hit. The command format is as follows:
// name is the name of the breakpoint
The effect is as follows:
(dlv) b test api/service/iteminfo/itemv2.go:51 // Add a breakpoint named test at itemv2.go:51
Breakpoint test set at 0x1843446 for api/service/iteminfo.(*ItemInfoServiceImpl).GetItemV2() ./api/service/iteminfo/itemv2.go:51
> [test] api/service/iteminfo.(*ItemInfoServiceImpl).GetItemV2() ./api/service/iteminfo/itemv2.go:51 (hits goroutine(2941592):1 total:1) (PC: 0x1843446)
Warning: debugging optimized function
=> 51: func (i *ItemInfoServiceImpl) GetItemV2(ctx context.Context,
52: req *iteminfopb.GetItemV2Request, rsp *iteminfopb.GetItemV2Reply) (err error) { // Hit the breakpoint, pausing program execution
Note that both trace breakpoints and break breakpoints can be named when added
Watch breakpoints will pause program execution and print relevant information when the watched object (or address) is read or written. The command is as follows:
-r stops when the memory location is read
-w stops when the memory location is written
-rw stops when the memory location is read or written
// expr refers to the expression in section 1.4
The execution effect is as follows:
Breakpoint 1 set at 0x4bf48a for main.main() ./main.go:41
> main.main() ./main.go:41 (hits goroutine(1):1 total:1) (PC: 0x4bf48a)
39: time.Sleep(1 * time.Second)
42: for i := 0; i < 10; i++ {
=> 44: x.TestC(i) // The program pauses when a is written for the first time
(dlv) watch -rw * (*uint8) (0x59d241) // Add watch point
Watchpoint * (*uint8) (0x59d241) set at 0x59d241
> watchpoint on [* (*uint8) (0x59d241)] main.main() ./main.go:44 (hits goroutine(1):1 total:1) (PC: 0x4bf70f)
39: time.Sleep(1 * time.Second)
42: for i := 0; i < 10; i++ {
=> 44: x.TestC(i) // The program pauses when a is written for the first time
2.3.2 Breakpoint Related Commands
The condition (abbreviated as cond) command is used to pause program execution only when the condition is met, for example, when the slice or map to be debugged contains many elements, we only care about one of them. The command is as follows:
condition <breakpoint name or id> <boolean expression>
// <breakpoint name or id> is the name or id of an existing breakpoint
// dlv will pause program execution when <boolean expression> is true
Note that the cond command must act on an existing breakpoint
As follows:
(dlv) b main.go:43 // Add a breakpoint at main.go:43, its id is 1
Breakpoint 1 set at 0x4bf704 for main.main() ./main.go:43
(dlv) cond 1 i==3 // Breakpoint 1 pauses when i==3
> main.main() ./main.go:43 (hits goroutine(1):1 total:1) (PC: 0x4bf704)
39: time.Sleep(1 * time.Second)
42: for i := 0; i < 10; i++ {
=> 43: a = uint8(i) // Pause when i==3
The on command is used to execute some operations when hitting a breakpoint, currently supported operations include: print, stack, goroutine, trace, cond.
The command format is as follows:
on <name or id> <command>
Note that the on command can only act on existing breakpoints and can be used for trace breakpoints
For example, when hitting a breakpoint, print some variable values, the specific operation is as follows:
(dlv) b main.go:43 // Add breakpoint, its id is 1
Breakpoint 1 set at 0x4bf704 for main.main() ./main.go:43
(dlv) on 1 p a // Print value of a when hitting breakpoint 1
> main.main() ./main.go:43 (hits goroutine(1):1 total:1) (PC: 0x4bf704)
a: 10 // Print value of a first
39: time.Sleep(1 * time.Second)
42: for i := 0; i < 10; i++ {
Other breakpoint-related commands are as follows:
| Command |
Abbreviation |
Usage |
Description |
| breakpoints |
bp |
bp |
Print information about all breakpoints (all types) |
| toggle |
– |
toggle <breakpoint name or id> |
Disable breakpoint |
| clear |
– |
clear <breakpoint name or id> |
Delete breakpoint |
| clearall |
– |
clearall |
Delete all (all types) breakpoints |
2.4 Variable and Memory Viewing
2.4.1 print
print is used to print the value of a variable or expression, its usage is as follows:
Note that print supports fmt series options, commonly including: %f %x %v %T, etc.
The execution effect is as referenced in 1.4
2.4.2 args, locals, vars
args command is used to print function parameters, its usage is as follows
args -v [<regex>] // args command will print more detailed data under -v parameter
locals is used to print local variables, its usage is as follows:
locals [-v] [<regex>] // -v is used to print more detailed information
vars is used to print package-level variables, its usage is as follows:
vars [-v] [<regex>] // -v parameter can print more detailed data
Note that vars can print not only custom package-level variables but also built-in package-level variables, such as runtime.curg, etc.
Using args as an example, its output is as follows:
i = (“*api/service/iteminfo.ItemInfoServiceImpl”)(0x3da4940)
ctx = context.Context(*context.valueCtx) 0xbeef000000000108
req = (“*fwd_content_service_iteminfo.GetItemV2Request”)(0xc03b80aa80)
rsp = (“*fwd_content_service_iteminfo.GetItemV2Reply”)(0xc03bf10960)
err = (unreadable empty OP stack)
i = (“*api/service/iteminfo.ItemInfoServiceImpl”)(0x3da4940)
*api/service/iteminfo.ItemInfoServiceImpl {}
ctx = context.Context(*context.valueCtx) *{
Context: context.Context(*context.valueCtx) *{
Context: context.Context(*context.valueCtx) …,
key: interface {}(go.opentelemetry.io/otel/trace.traceContextKeyType) *(*interface {})(0xc0cf8d6e20),
val: interface {}(go.opentelemetry.io/otel/trace.nonRecordingSpan) *(*interface {})(0xc0cf8d6e30),},
key: interface {}(go.opentelemetry.io/otel/trace.traceContextKeyType) currentSpanKey (0),
val: interface {}(*go.opentelemetry.io/otel/sdk/trace.recordingSpan) *{
mu: (*sync.Mutex)(0xc03b1a0f00),
Note that args, locals, vars, etc. are usually used together with dlv core for issue localization and analysis
Using args as an example, its output is as follows:
2.4.3 display
display command will print the value of the relevant expression every time the program pauses. If you want to see the changes in variables during single-step debugging, you can use the display command. Its usage is as follows:
display -a [%format] <expr> // Add the expression or variable to be displayed
display -d <number> // Delete relevant display information
// %format is a fmt series formatted string
The execution effect is as follows:
(dlv) display -a %v tools.isProdEnv // Print the value of tool.isProdEnv every time the program pauses, its id is 0
0: pkg/tools.isProdEnv = true
> api/service/iteminfo.(*ItemInfoServiceImpl).GetItemV2() ./api/service/iteminfo/itemv2.go:51 (hits goroutine(2945141):1 total:1) (PC: 0x1843446)
Warning: debugging optimized function
=> 51: func (i *ItemInfoServiceImpl) GetItemV2(ctx context.Context,
52: req *iteminfopb.GetItemV2Request, rsp *iteminfopb.GetItemV2Reply) (err error) {
54: err = i.getItemV2Impl(ctx, req, rsp)
0: pkg/tools.isProdEnv = true // Print pkg/tools.isProdEnv
(dlv) display -d 0 // Remove relevant display mechanism
Display related mechanisms are similar to the on command’s print, but the on command supports more functionality than print
2.4.4 set
set command is used to modify the value of a variable during runtime, its usage is as follows:
Note that if the related variable’s set can affect the execution path of the function, the set command needs to be executed in advance
> main.main() ./main.go:39 (hits goroutine(1):1 total:1) (PC: 0x4bf480)
=> 39: time.Sleep(1 * time.Second)
42: for i := 0; i < 10; i++ {
(dlv) p t // t’s value at this time is false
(dlv) set t=true // Set t’s value to true
> main.main() ./main.go:42 (PC: 0x4bf493)
39: time.Sleep(1 * time.Second)
=> 42: for i := 0; i < 10; i++ { // At this point, it can enter the if
2.4.5 whatis
whatis is used to print the type of a variable or expression, its usage is as follows:
Breakpoint 1 set at 0x4bf46f for main.main() ./main.go:30
> main.main() ./main.go:30 (hits goroutine(1):1 total:1) (PC: 0x4bf46f)
27: var animial Animial = Cat{s: “test”}
=> 30: flag.StringVar(cfg, “cfg”, “default”, “-cfg”)
(dlv) whatis animial // Print the type of animial
(dlv) whatis animial.s // Print the type of animial.s
2.4.6 examinemem
examinemem is used to print information at a specified address, its abbreviation is x, and its usage is as follows:
examinemem [-fmt <format>] [-count <count>] [-size <size>] <address>
Where fmt supports bin, hex, oct, -count and -size are used to specify the number of times to print and the size of the space, as follows:
Breakpoint 1 set at 0x4bf704 for main.main() ./main.go:43
> main.main() ./main.go:43 (hits goroutine(1):1 total:1) (PC: 0x4bf704)
39: time.Sleep(1 * time.Second)
42: for i := 0; i < 10; i++ {
(dlv) x -fmt hex -count 2 -size 1 0x59d241 // Print content starting from address 0x59d241 in hexadecimal format 2 times, each time 1 byte
(dlv) x -fmt hex -count 1 -size 2 0x59d241 // Print content starting from address 0x59d241 in hexadecimal format 1 time, each time 2 bytes
2.5 Stack Related
2.5.1 stack
stack command is used to print the call stack, its abbreviation is bt, and its usage is as follows:
[goroutine <n>] stack [<depth>] [-full]
// goroutine <n> specifies the goroutine to print the stack
// depth prints the stack up to depth layers
// -full prints relevant parameters and local variables
(dlv) grs // List all goroutines
Goroutine 19 – User: /root/go/pkg/mod/github.com/panjf2000/ants/[email protected]/pool.go:69 github.com/panjf2000/ants/v2.(*Pool).purgePeriodically (0x95552b) [chan receive]
(dlv) gr 19 bt 3 -full // Print the first 0-3 function stack frame information of goroutine 19
0 0x000000000043de36 in runtime.gopark
at /usr/local/go1.20/go/src/runtime/proc.go:382
1 0x0000000000408cbd in runtime.chanrecv
at /usr/local/go1.20/go/src/runtime/chan.go:583
c = (*runtime.hchan)(0xc000168060)
ep = unsafe.Pointer(0xc00013a798)
selected = (unreadable empty OP stack)
received = (unreadable empty OP stack)
~R0 = (unreadable empty OP stack)
gp = (*runtime.g)(0xc000207380)
mysg = (*runtime.sudog)(0xc0001680c0)
2 0x00000000004087f8 in runtime.chanrecv2
at /usr/local/go1.20/go/src/runtime/chan.go:447
c = (unreadable could not find loclist entry at 0x10dde for address 0x4087f8)
elem = (unreadable could not find loclist entry at 0x10e11 for address 0x4087f8)
3 0x000000000095552b in github.com/panjf2000/ants/v2.(*Pool).purgePeriodically
p = (“*github.com/panjf2000/ants/v2.Pool”)(0xc0002cdb20)
heartbeat = (unreadable could not find loclist entry at 0x7668bf for address 0x95552b)
2.5.2 frame, up, down
frame, up, down are used to move the stack frame and execute commands; frame is used to move to a specified stack frame, while up and down are used to move up and down the stack frame, respectively. Their usage is as follows:
frame <m> command // Move to stack frame m, execute command
up <m> command // Move up m stack frames, execute command
down <m> command // Move down m stack frames, execute command
The execution effect is as follows:
6 0x0000000001cffc5d in main.glob..func1
(dlv) frame 6 args -v // Print parameters of stack frame 6
ctx = context.Context(*context.valueCtx) *{…}
req = interface {}(*git.woa.com/trpcprotocol/forwardindex/fwd_content_service_iteminfo.GetItemV2Request) *{
state: google.golang.org/protobuf/internal/impl.MessageState {
NoUnkeyedLiterals: google.golang.org/protobuf/internal/pragma.NoUnkeyedLiterals {},
DoNotCompare: google.golang.org/protobuf/internal/pragma.DoNotCompare [],
DoNotCopy: google.golang.org/protobuf/internal/pragma.DoNotCopy [],
atomicMessageInfo: *(*”google.golang.org/protobuf/internal/impl.MessageInfo”)(0xc001323fb0),},
unknownFields: []uint8 len: 0, cap: 0, nil
2.6 Query Related Commands
2.6.1 Common Query Commands
Note that the following commands support regular matching.
| Command |
Abbreviation |
Description |
| funcs |
– |
Print all function information |
| goroutines |
grs |
Print all goroutine information |
| threads |
– |
List all thread information |
| sources |
– |
List all source files |
| types |
– |
List all types |
2.6.2 groutine
groutine command is used to print current goroutine information or switch to a specified goroutine to execute commands, its usage is as follows:
goroutine [<id>] [<command>] // Switch to the corresponding groutine, execute command
(dlv) gr 6 bt 2 -full // Print stack information of goroutine with id 6
0 0x000000000043de36 in runtime.gopark
1 0x000000000044e51e in runtime.selectgo
2 0x000000000118dc87 in github.com/RussellLuo/timingwheel.(*TimingWheel).Start.func2
2.6.3 list
list command is used to print the source code, it will print 5 lines of code around the specified location, its usage is as follows:
[goroutine <n>] [frame <m>] list [<locspec>] // View the source code of a certain function call stack frame of a certain goroutine
Goroutine 6 frame 1 at /usr/local/go1.20/go/src/runtime/select.go:327 (PC: 0x44e51e)
322: // Signal to anyone trying to shrink our stack that we’re about
323: // to park on a channel. The window between when this G’s status
324: // changes and when we set gp.activeStackChans is not safe for
326: gp.parkingOnChan.Store(true)
=> 327: gopark(selparkcommit, nil, waitReasonSelect, traceEvGoBlockSelect, 1)
328: gp.activeStackChans = false
330: sellock(scases, lockorder)
332: gp.selectDone.Store(0)
Goland provides support for dlv related mechanisms.
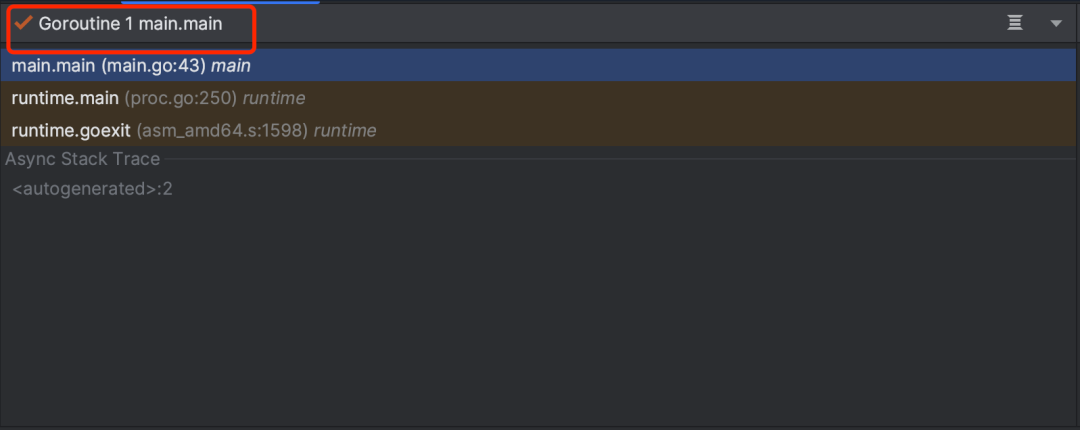
In Goland, the debug related mechanisms are located in the debug panel, which can be opened via view->tool windows->debug. The debug panel typically includes two parts, used to display goroutine information, stack information, and data information, as follows:
3.1 Breakpoint Related
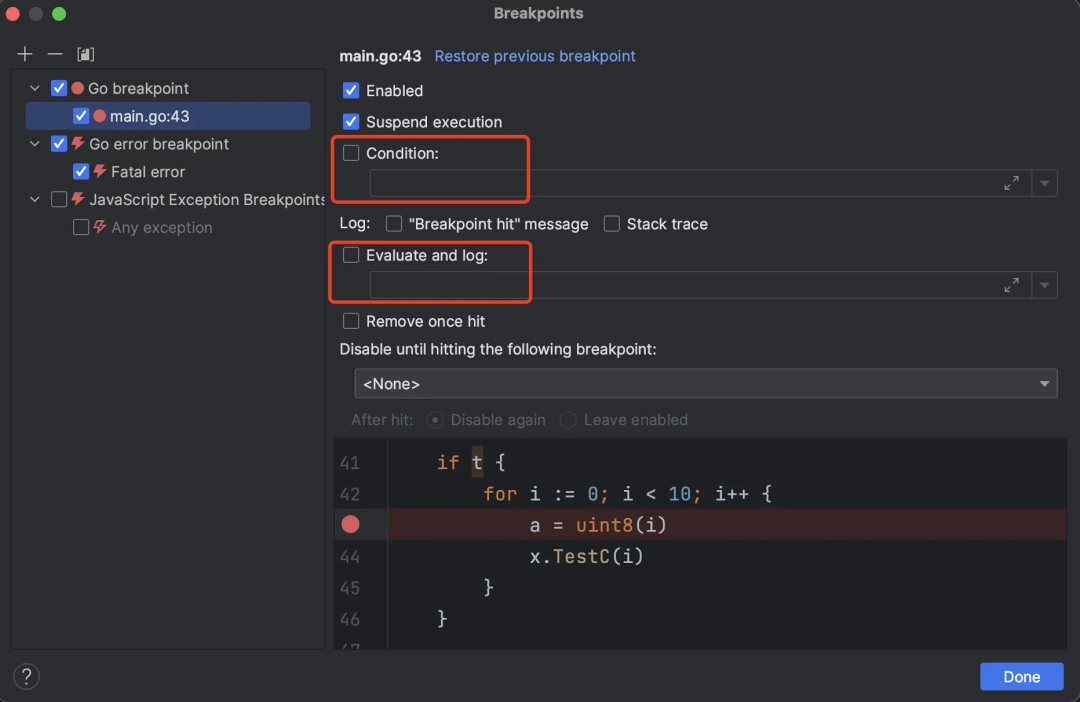
Goland supports breakpoint-related features, mainly evaluate and log, condition related mechanisms, as follows:
-
evaluate and log, print the value of relevant expressions or variables during debugging in the console;
-
condition, the program will pause only when hitting a breakpoint && the relevant condition is met.
After adding a breakpoint in Goland, you only need to right-click on the relevant breakpoint and click More in the pop-up dialog to use the related mechanisms:
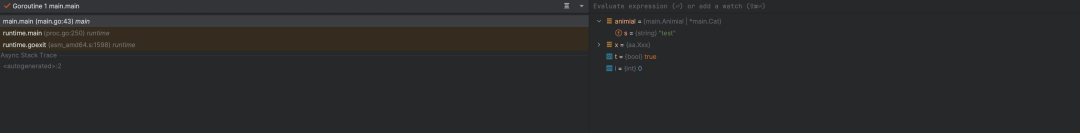
3.2 Variable and Memory Viewing
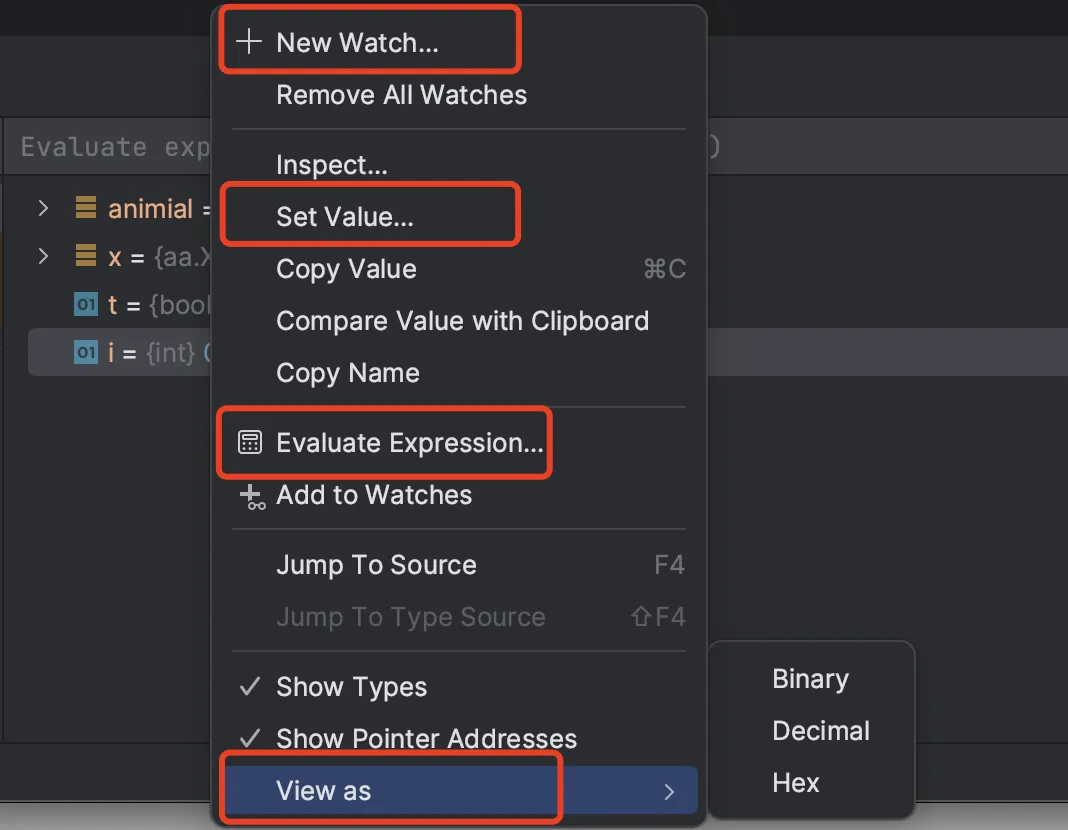
Goland supports variable and memory viewing in debugging, mainly evaluate expression, watch, view as, set related mechanisms, which can be added by right-clicking in the debug panel, as follows:
3.3 Goroutines and Stack Related
Goland also provides support for goroutines and stacks in debugging, with the default display being the call stack of the current goroutine, which can be selected through a drop-down list, as follows:
Original Author|Zhang Yuxin
Recommended Reading
I have compiled a Go learning material package from beginner to advanced, including learning suggestions: what to watch for beginners and what to watch for advanced learners.Follow the WeChat public account “polarisxu”, reply ebook to obtain; you can also reply “Join Group” to communicate and learn with tens of thousands of Gophers.