Hello everyone, this is IoT Heart. I have always wanted to write an article related to Linux memory leaks for two reasons: memory leaks are a common issue in software development, and many beginners do not know how to troubleshoot Linux memory leak problems; over the years, I have mastered many debugging methods for memory leaks, which are quite scattered. This article aims to organize this fragmented knowledge into a Linux memory debugging guide to help everyone solve Linux memory leak issues.1. Starting with Linux Memory Management Many of my articles have introduced the Linux memory management mechanism. The reason for repeatedly introducing this knowledge point is that it is very important. Whenever it involves Linux memory-related issues, we need to rely on the Linux memory management mechanism to solve them.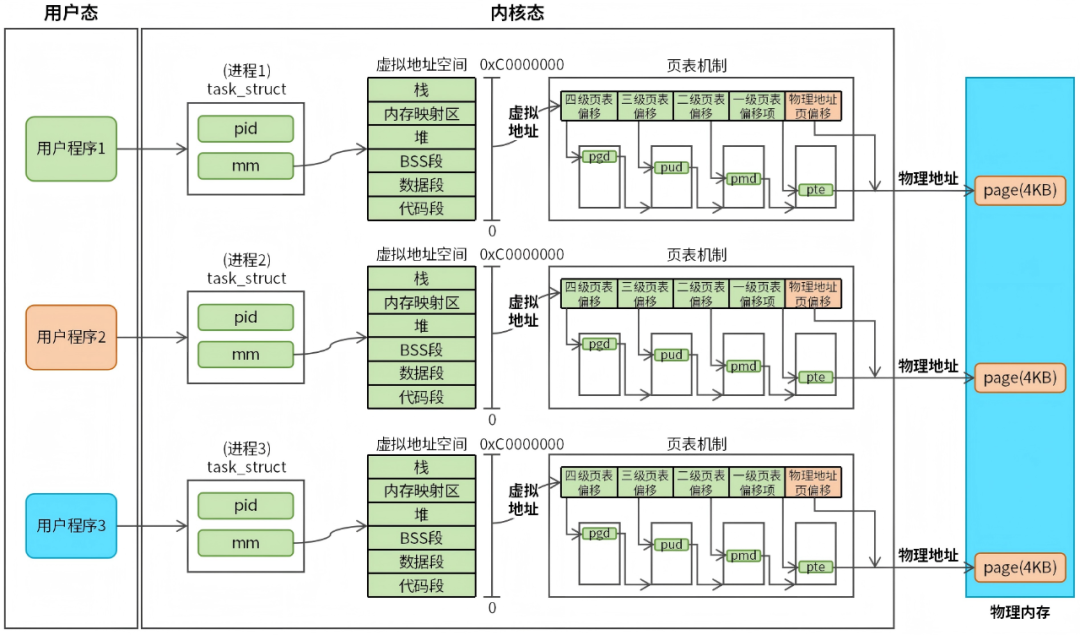 Figure 1 Linux Memory Management As shown in Figure 1, Linux memory management is divided into: virtual memory management and physical memory management. I have previously introduced this point in my article: Understanding mmap Implementation Principles with One Image (Easy to Understand), so I will not repeat the same knowledge point here. This article will explore Linux memory management from the perspective of memory leaks. The core of Linux memory management includes: virtual memory (corresponding to virtual addresses), page table mechanism, and physical memory (corresponding to physical addresses). Physical memory is a scarce resource, while virtual memory is relatively unrestricted. When a user program requests memory, the system first allocates virtual memory to the user, and only allocates physical memory when the user actually needs to use it. This means that there is a certain lag in the mapping of virtual memory to physical memory. This lag is a memory safety protection mechanism of the Linux system; if physical memory were allocated immediately to each process when memory is allocated, physical memory would be quickly exhausted. Due to the lag in memory mapping, we must also consider this when troubleshooting memory errors. When a memory error occurs, we need to check both virtual memory and physical memory usage.2. System Physical Memory Physical memory is a system-level resource, and processes and threads on the system share physical memory. Any process or thread that experiences a physical memory leak will cause the physical memory resources to decrease. Therefore, we need to regularly monitor the health of physical memory.
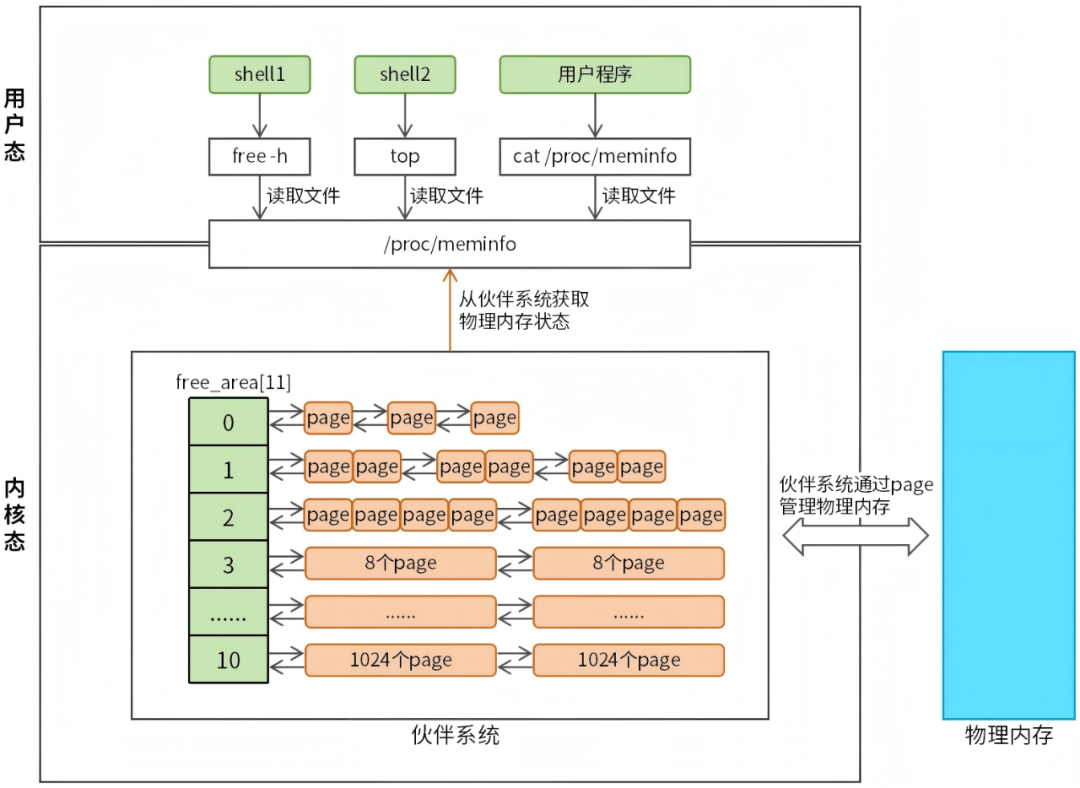 Figure 2 Checking System Physical Memory As shown in Figure 2, common ways to check system physical memory include:
- free command
- top command
- cat /proc/meminfo
In fact, these three methods are not fundamentally different; they all read the /proc/meminfo file, so we need to understand the /proc/meminfo file in depth to understand the system’s physical memory usage. The /proc/meminfo file provides detailed information about the system’s memory usage, which is generated in real-time by the kernel, thus reflecting the current state of the system’s physical memory. Relevant output examples are as follows: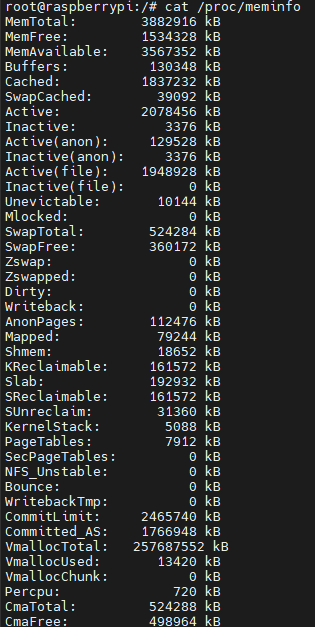 Since the output information of the meminfo file is quite extensive, and some information is rarely used and difficult for beginners to understand, we will only explain some key fields as follows:
- MemTotal: Total physical memory size.
- MemFree: Size of free physical memory (not in use).
- MemAvailable: Estimated size of physical memory available for new applications (including cache and buffers).
- Buffers: Size of physical memory used for filesystem buffers (temporary storage of disk data).
- Cached: Size of physical memory used for page cache (cached file data).
The Linux system divides physical memory into small memory units (pages, usually 4KB), and the kernel describes pages through the struct page structure. Since there are many pages, Linux uses a buddy system to manage these pages uniformly. When we want to understand the system’s physical memory usage, we only need to count the usage of all pages in the buddy system. Those interested in the buddy system can refer to my article: Illustrated Linux Memory Management – Buddy System. When a user program reads the /proc/meminfo file, it is essentially checking the usage of pages in the buddy system.3. Process Virtual Memory Many readers often confuse virtual memory and physical memory. Physical memory is system-level, while virtual memory is process-level. Each process has its own independent virtual memory (corresponding to the virtual address space), and the range of virtual addresses is the same. Different processes can use the same virtual address to access memory; although they use the same virtual address, the system will map the same virtual address to different physical addresses through the page table mechanism, thus accessing different physical memory.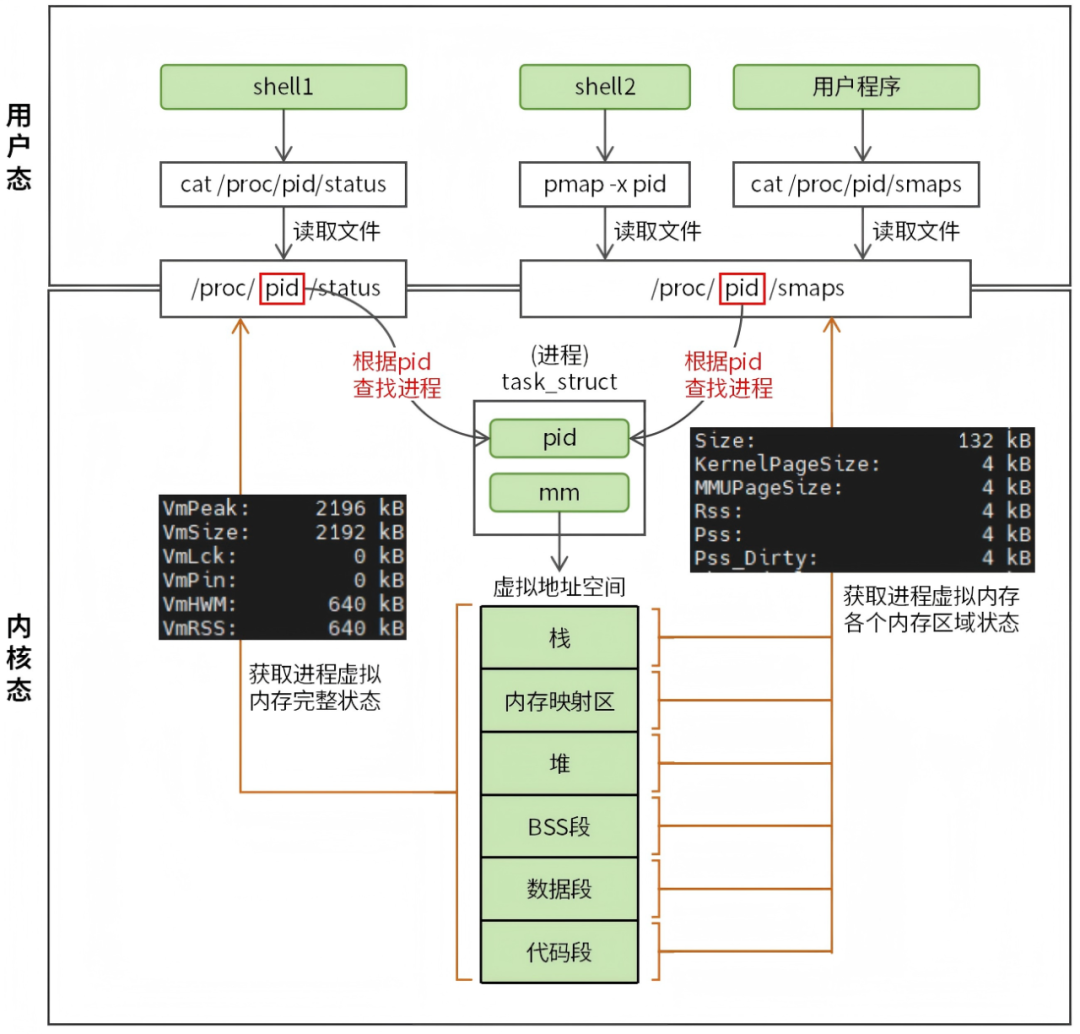 Figure 3 Checking Process Virtual Memory As shown in Figure 3, when we want to check the virtual memory usage of a certain process, there are usually the following methods (where represents the process ID):
- Check the overall status of virtual memory: cat /proc/<pid>/status.
- Check the status of each memory area of virtual memory: pmap -x <pid> or cat /proc/<pid>/smaps.
The /proc/<pid>/status file provides detailed status information about the specified process. This information is generated in real-time by the kernel and can reflect the current running state and resource usage of the process. Output examples are as follows: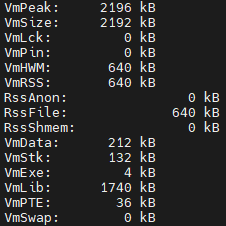
Common field introductions are as follows:
-
VmPeak: Peak virtual memory usage of the process, including all allocated memory, regardless of whether it is used.
-
VmSize: Current total virtual memory of the process (including all mapped areas such as code, data, stack, shared libraries).
-
VmHWM: Peak physical memory usage of the process (historical maximum RSS, reflecting physical memory pressure).
-
VmRSS: Current physical memory usage of the process.
-
RssAnon: Physical memory used by the process’s anonymous mapping (memory not belonging to any file, usually the program’s heap and stack).
-
RssFile: Physical memory used by the process’s file mapping (shared libraries, mmap files, etc.).
-
RssShmem: Physical memory usage of the process’s shared memory.
-
VmData: Size of the data segment (including dynamically allocated memory and global variables).
-
VmStk: Size of the stack.
-
VmExe: Size of the code segment.
-
VmLib: Size of the virtual memory of shared libraries.
Next, let’s take a look at the usage of each area of the process’s virtual memory. Since the pmap method relies on the /proc/<pid>/smaps file, we will focus on the /proc/<pid>/smaps file.
The /proc/<pid>/smaps file provides detailed information about the memory mapping of the specified process. This information includes the size, access permissions, usage, etc., of each memory segment.
Relevant output examples are as follows:
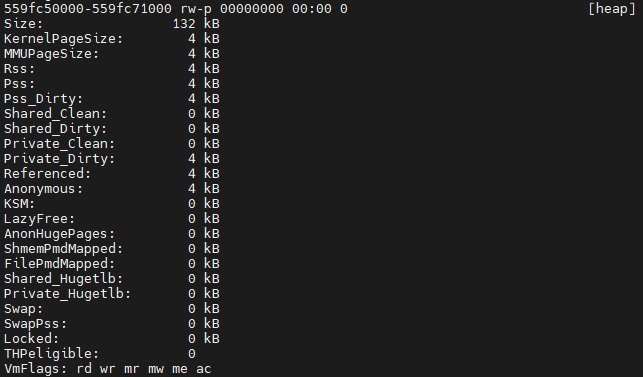 Since the output information of the smaps file is quite extensive, we will only extract the heap area for explanation. 559fc50000-559fc71000 rw-p 00000000 00:00 0 [heap]
- 559fc50000-559fc71000: Indicates the starting and ending addresses of this memory area.
- rw-p: Indicates the access permissions of this memory area, rw means readable and writable, p means private.
- 00000000: Indicates the offset of this memory area in the file.
- 00:00 0: Indicates that this memory area has no associated file, 00:00 is the device number, and 0 is the inode number of the file.
- [heap]: Indicates that this memory area is the process’s heap.
Common field explanations are as follows:
- Size: Total size of the virtual memory of this memory area.
- Rss: Current physical memory usage of this memory area.
- Pss: Physical memory usage of this memory area calculated by shared ratio.
4. Practical Memory Allocation Having introduced many theoretical knowledge points related to Linux memory management, to give everyone a more intuitive understanding, we will verify these theoretical knowledge through testing. The test program is as follows:
#define SIZE (100 * 1024 * 1024)

int main(int argc, char *argv[]) {
    void *p = malloc(SIZE); // Request 100MB of memory
    while(1) sleep(1);

    return 0;
}
The test program calls the malloc function to request 100MB of memory and does not release it. Compile the test program and execute it, then check the program’s virtual memory and physical memory usage. Execute cat /proc/<pid>/status command to check the overall status of virtual memory, the output is as follows:
# cat /proc/2604694/status
......
VmPeak: 104596 kB
VmSize: 104596 kB
VmLck: 0 kB
VmPin: 0 kB
VmHWM: 640 kB
VmRSS: 640 kB
RssAnon: 0 kB
RssFile: 640 kB
RssShmem: 0 kB
VmData: 102616 kB
VmStk: 132 kB
VmExe: 4 kB
VmLib: 1740 kB
VmPTE: 36 kB
VmSwap: 0 kB
VmPeak (peak virtual memory usage of the process) and VmSize (current virtual memory usage of the process) are both 100MB, indicating that the system has already allocated 100MB of virtual memory to the process. Next, we will check the memory usage of each virtual memory area using cat /proc/<pid>/smaps, the output is as follows:
5597713000-5597734000 rw-p 0000000000:000           [heap]
Size: 132 kB
KernelPageSize: 4 kB
MMUPageSize: 4 kB
Rss: 4 kB
Pss: 4 kB
Pss_Dirty: 4 kB
......
VmFlags: rd wr mr mw me ac
7f7973f000-7f7fb40000 rw-p 0000000000:000
Size: 102404 kB // Allocated 100MB of memory through mmap anonymous mapping
KernelPageSize: 4 kB
MMUPageSize: 4 kB
Rss: 4 kB
Pss: 4 kB
......
VmFlags: rd wr mr mw me ac
From the output, it can be seen that this 100MB of memory is allocated through mmap anonymous mapping. Although the malloc function is called to allocate memory, it is actually allocated through mmap anonymous mapping. Why is this the case? Please refer to my article: Understanding malloc and free Source Code Thoroughly with 14 Images. After checking the virtual memory usage, we also need to check the physical memory usage. We will check the physical memory usage using cat /proc/meminfo. The output before starting the test program is as follows:
# cat /proc/meminfo
MemTotal: 3882916 kB
MemFree: 1521360 kB
MemAvailable: 3554568 kB
Buffers: 130392 kB
Cached: 1837244 kB
The output after starting the test program is as follows:
# cat /proc/meminfo
MemTotal: 3882916 kB
MemFree: 1524100 kB
MemAvailable: 3557308 kB
Buffers: 130392 kB
Cached: 1837244 kB
The difference in MemFree (free physical memory) between the two outputs is not significant, indicating that the test program did not allocate physical memory. The reason for not allocating physical memory is that we did not actually use the memory. Next, we will slightly modify the test program as follows:
#define SIZE (100 * 1024 * 1024)

int main(int argc, char *argv[]) {
    void *p = malloc(SIZE); // Request 100MB of memory
    memset(p, 0, SIZE); // Complete memory mapping, use physical memory
    while(1) sleep(1);

    return 0;
}
The test program initializes the allocated memory using memset, compiles the test program, and executes it. We will then check the memory usage of each virtual memory area using cat /proc/<pid>/smaps, the output is as follows:
55ac9a1000-55ac9c2000 rw-p 0000000000:000           [heap]
Size: 132 kB
KernelPageSize: 4 kB
MMUPageSize: 4 kB
Rss: 4 kB
Pss: 4 kB
......
VmFlags: rd wr mr mw me ac
7fb731f000-7fbd720000 rw-p 0000000000:000
Size: 102404 kB // Allocated 100MB of virtual memory through mmap
KernelPageSize: 4 kB
MMUPageSize: 4 kB
Rss: 102404 kB // Allocated 100MB of physical memory
Pss: 102404 kB // Allocated 100MB of physical memory
......
VmFlags: rd wr mr mw me ac
Size of 102404KB indicates that 100MB of virtual memory has been allocated. Rss and Pss of 102404KB indicate that the virtual address has completed memory mapping, and the actual physical memory usage of this area is 100MB. Finally, let’s take a look at the changes in system physical memory. The output of cat /proc/meminfo before starting the test program is as follows:
# cat /proc/meminfo
MemTotal: 3882916 kB
MemFree: 1522124 kB
MemAvailable: 3555336 kB
Buffers: 130392 kB
Cached: 1837244 kB
The output after starting the test program is as follows:
# cat /proc/meminfo
MemTotal: 3882916 kB
MemFree: 1420504 kB
MemAvailable: 3453716 kB
Buffers: 130392 kB
Cached: 1837244 kB
The difference in MemFree between the two results is 100MB, indicating that the system has allocated 100MB of physical memory for the test program.5. Memory Leak Troubleshooting In Linux systems, when user programs use functions like malloc, calloc, or realloc to allocate memory but forget to call the free function to release the memory, it will cause memory leaks.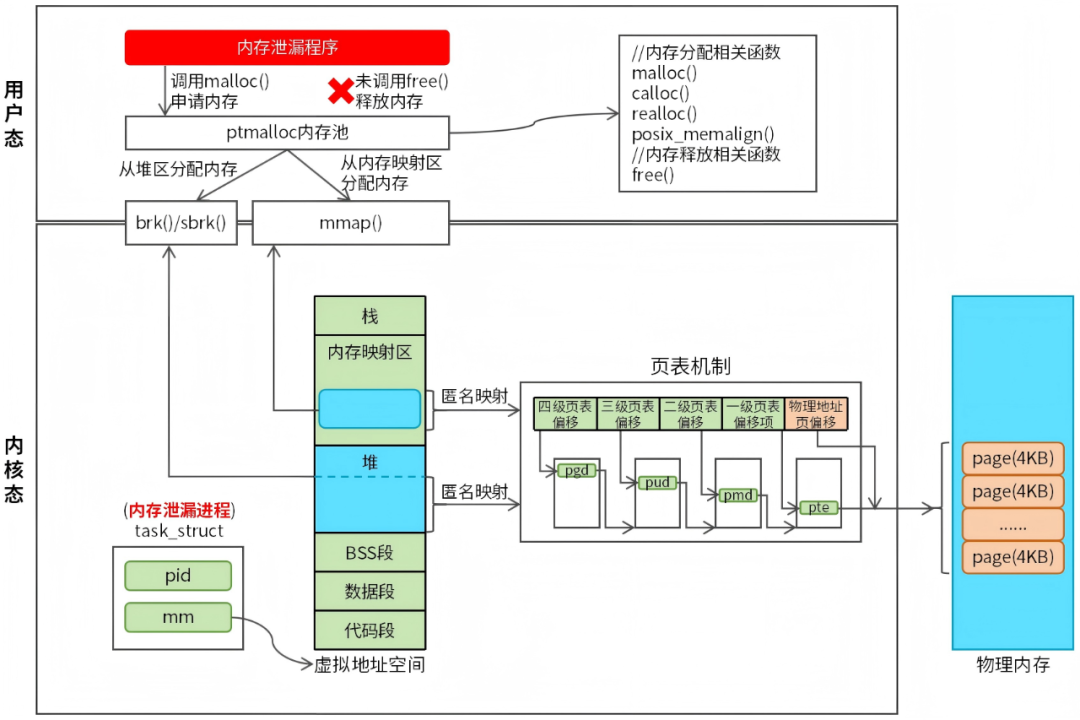 Figure 4 Linux Memory Leak Principles The principle of Linux memory leaks is shown in Figure 4. When a user program calls memory allocation functions (such as the malloc function) to allocate memory, the malloc function ultimately allocates memory from the heap or through mmap anonymous memory mapping. In fact, the heap is also a type of mmap anonymous mapping. As seen in Figure 4, the areas of memory leaks are mainly the heap and anonymous mapping areas, so the troubleshooting approach for memory leaks will also focus on these two memory areas. The steps for troubleshooting Linux memory leaks are as follows.(1)Confirm the existence of memory leaks Before starting the troubleshooting, it is necessary to confirm that there is indeed a memory leak in the system. The troubleshooting method can check the /proc/meminfo file.(2)Identify the process causing the memory leak To determine which process is causing the memory leak, we need to sort the Linux processes by memory usage. The relevant command is as follows:
ps -eo pid,comm,rsz,vsz --sort=-rsz | head -n 10rsz indicates physical memory, vsz indicates virtual memory. –sort=-rsz indicates sorting by actual physical memory usage from high to low. If you want to sort by virtual memory usage, you can change rsz to vsz. The output example is as follows:
# ps -eo pid,comm,rsz,vsz --sort=-rsz | head -n 10
    PID COMMAND RSZ VSZ
2638056 a.out 103040 104596
    958 pcmanfm 64412 541472
    956 wf-panel-pi 29380 1200136
    711 labwc 18256 575252
    253 systemd-journal 15056 66944
2518507 cups-browsed 12032 178884
2527597 vim 9984 15940
2518581 sshd 9856 19652
2518583 sshd 9856 19656
From the output, it can be seen that the test program a.out uses a total of 100MB of physical memory, ranking first when sorted by physical memory.
(3) Analyze the memory usage of the process
After identifying the process causing the memory leak, we can further check the virtual memory and physical memory usage of the process in detail using cat /proc/<pid>/status and cat /proc/<pid>/smaps.
(4) Identify the code memory leak point
After completing the above steps, we will have a comprehensive understanding of whether the program has memory leaks. If the program has memory leaks, we need to find the memory leak point in the code. Experienced developers usually use tools for analysis and code review to find memory leak points. There are many memory leak analysis tools, among which Valgrind is quite well-known.
Before using Valgrind, it needs to be installed. The installation method for Ubuntu is as follows:
sudo apt-get install valgrindAfter installation, use Valgrind to start your program as follows:
valgrind --leak-check=full --show-leak-kinds=all --track-origins=yes --verbose --log-file=valgrind.txt ./myprogram-
–leak-check=full: Enable detailed memory leak checking.
-
–show-leak-kinds=all: Show all types of memory leaks.
-
–track-origins=yes: Track the origins of uninitialized values.
-
–verbose: Enable detailed mode, output more debugging information.
-
–log-file=valgrind.txt: Save the output results to the specified log file.
The output of Valgrind is as follows:
==2657638== LEAK SUMMARY:
==2657638== definitely lost: 0 bytes in 0 blocks
==2657638== indirectly lost: 0 bytes in 0 blocks
==2657638== possibly lost: 104,857,600 bytes in 1 blocks
==2657638== still reachable: 0 bytes in 0 blocks
==2657638== suppressed: 0 bytes in 0 blocks
==2657638==
==2657638== For lists of detected and suppressed errors, rerun with: -s
==2657638== ERROR SUMMARY: 1 errors from 1 contexts (suppressed: 0 from 0)- definitely lost: Memory blocks allocated by the program that are completely inaccessible and have not been released, must be fixed.
- indirectly lost: Memory that is inaccessible due to other
<span> definitely lost</span>memory blocks (e.g., parent node leaks in a data structure leading to child node leaks), fixing the associated definitely lost will automatically make it disappear, no need to handle separately. - possibly lost: There are pointers pointing to memory blocks, but the pointers are located in the middle of the memory block rather than the starting address (e.g., pointer arithmetic errors), needs to be fixed.
- still reachable: At the end of the program, global/static variables still hold memory pointers (e.g., unreleased global cache), recommended to clean up.
- suppressed: Errors filtered by Valgrind’s preset rules or user configuration, not actual leaks, no need to pay attention.
Summary:
This article introduces the Linux memory management mechanism and details how to check the system’s physical memory and process’s virtual memory usage. Finally, it explains the causes of Linux memory leaks and troubleshooting methods. This article provides good guidance for debugging Linux memory leaks, and I hope it is helpful to you.