EPT hooks have always been a particularly useful tool in the field of binary security, especially after the introduction of PatchGuard in the Windows kernel. Traditional EPT hooks generally use shadow page switching, but in practice, issues such as self-modifying code, multi-core synchronization, and easy targeting of the host environment have been found. In response, Mr. Cheng Cong introduced how to use KVM, in conjunction with an emulator, to achieve shadow-less EPT hooks, cleverly solving the problems present in traditional methods.
When analyzing malicious samples, one often encounters anti-debugging interferences, such as common software and hardware breakpoint detections. This topic introduces how to use KVM to enhance existing debugging analysis tools (IDA, x64dbg, etc.) without any modifications, adding capabilities to hide software and hardware breakpoints and achieve dimensionality reduction attacks.

Let’s review the exciting content of “Next-Gen Binary Analysis Tool Based on Hardware Virtualization Technology” at the 【Sixth Security Developer Summit】.
Speaker
 【Cheng Cong: Alibaba Cloud Security – System Security Expert】 Currently working in the Alibaba Cloud Security Team, previously worked in Tencent Cloud’s virtualization team, with 7 years of experience in security confrontation, specializing in kernel security, virtualization security, reverse analysis, and binary offense and defense.
Lecture Content
The following is a verbatim transcription:Hello everyone, I am Cheng Cong. I am very happy to attend the Kanxue Security Developer Summit. Today, I will share with you the topic of the next-gen binary analysis tool based on hardware virtualization technology. I currently work in the Alibaba Cloud Security System Security Team, with research directions including virus detection, host security, kernel security, virtualization security, and binary offense and defense.Today, I will share with you the content mainly covering the following aspects: the first part is background introduction, the second part is an introduction to QEMU/KVM, the third part is shadow-less EPT hooks, the fourth part is virtualization debuggers, the fifth part is kernel-level tracing, and finally, the summary part.
01
Background Introduction
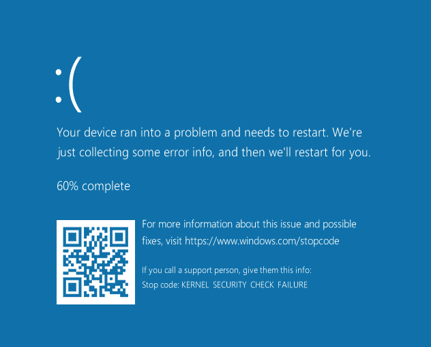
Let’s first look at the background introduction. Everyone can see this picture. If you are involved in Windows kernel security, you should be familiar with this image. After the introduction of PatchGuard in Windows 64-bit, if we perform patching or hooking operations on some sensitive parts of the kernel, it will trigger a blue screen. This is to prevent arbitrary hooking of the kernel, but there are many scenarios where we still need to perform hooking, such as creating sandboxes or developing endpoint defense products.
Then security researchers discovered that by leveraging the characteristics of hardware virtualization, EPT hooks can be implemented, which can be compatible with PatchGuard, effectively bypassing it.However, in practice, I found that traditional EPT hooks generally use shadow page tables to switch and achieve deception. We found that this method has some issues; in certain cases, it actually does not work. Today, we will introduce a new method to cleverly solve the problems present in existing methods.To implement EPT hooks, we first need a virtualization platform similar to the one in the following image, and then we can implement the functionalities we desire on this virtualization platform.
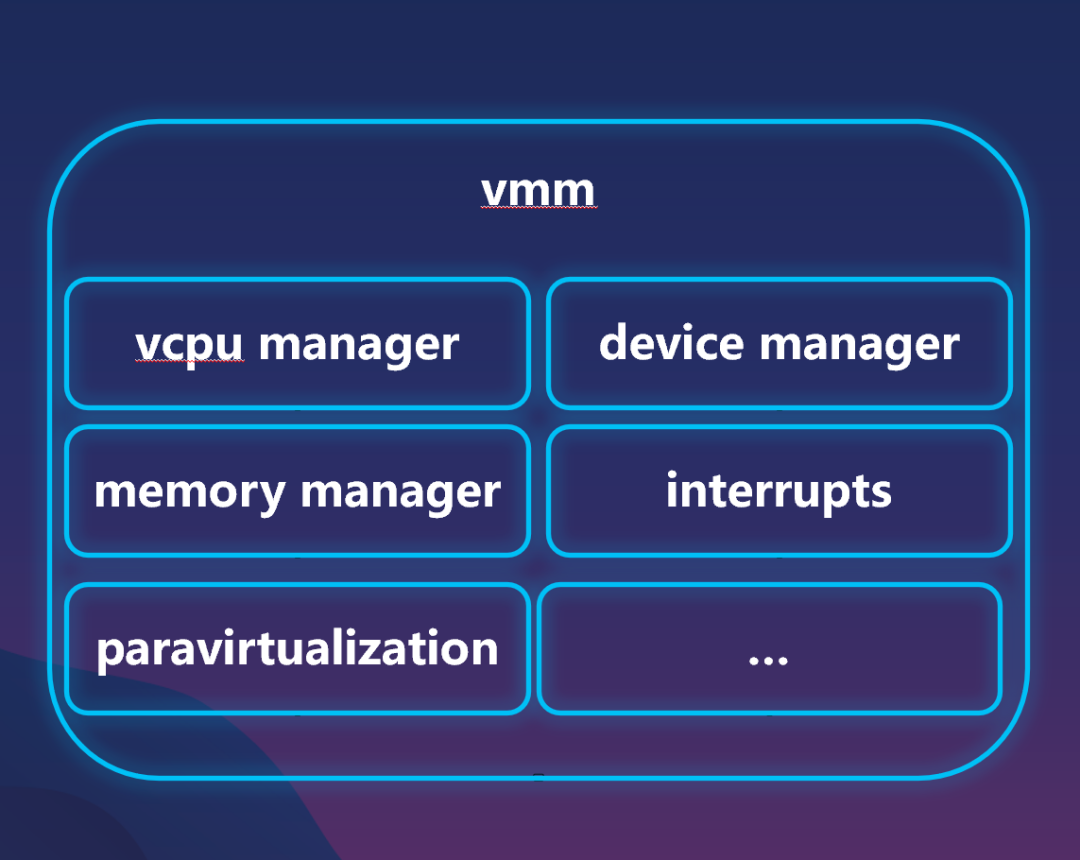
We can see that the virtualization platform includes vCPU, devices, memory, interrupts, and semi-virtual management. From this image, we can also see that the virtualization platform may contain many aspects, so developing such a virtualization platform from scratch would be a huge workload.Therefore, we generally implement EPT hooks based on existing virtualization platforms for secondary development. However, some open-source virtualization platforms that focus on security, such as the well-known Hyperplatform, may have various issues, which we commonly refer to as toy VMMs. For example, when writing some garbage MSRs, or when operating some CR or DR registers, it may crash, because it is not commercialized. So based on this issue, we ultimately chose QEMU/KVM for secondary development.Relatively speaking, the advantages of QEMU/KVM are that it is open-source and has commercialized products that are commonly used in our cloud environments. This sharing will be based on QEMU/KVM to create shadow-less EPT hooks, virtualization debuggers, and kernel-level trace tools.Why do we choose QEMU/KVM over other virtualization platforms like Hyperplatform? It has the following advantages, which I will not read out one by one.
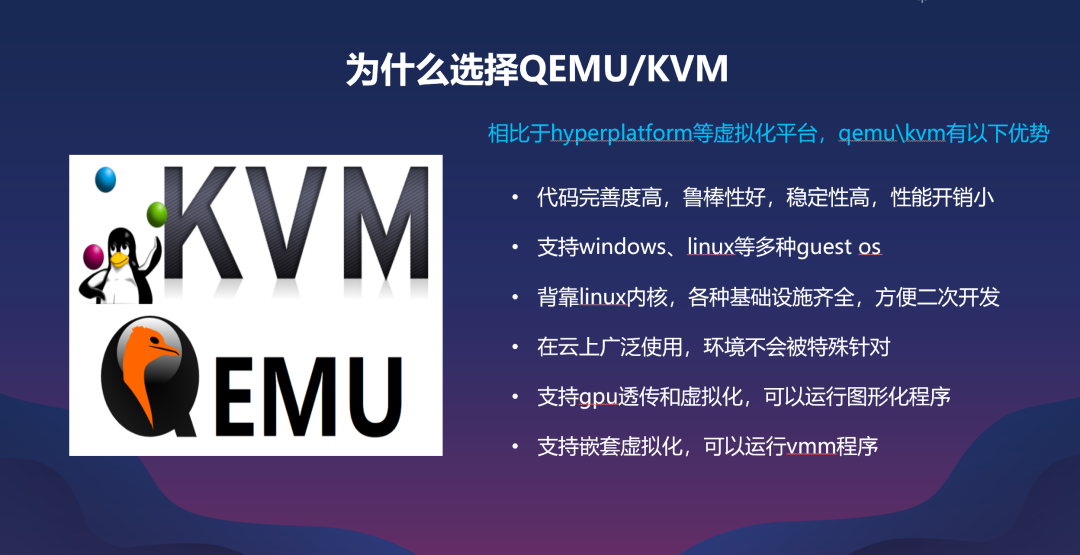
I would like to emphasize that it supports GPU pass-through and nested virtualization, allowing us to run another VMM program inside the guest. Other features include being open-source and backed by the Linux kernel, allowing us to use various infrastructure from the Linux kernel during development. After introducing its advantages, let’s give a brief introduction to it.
02
QEMU/KVM Introduction
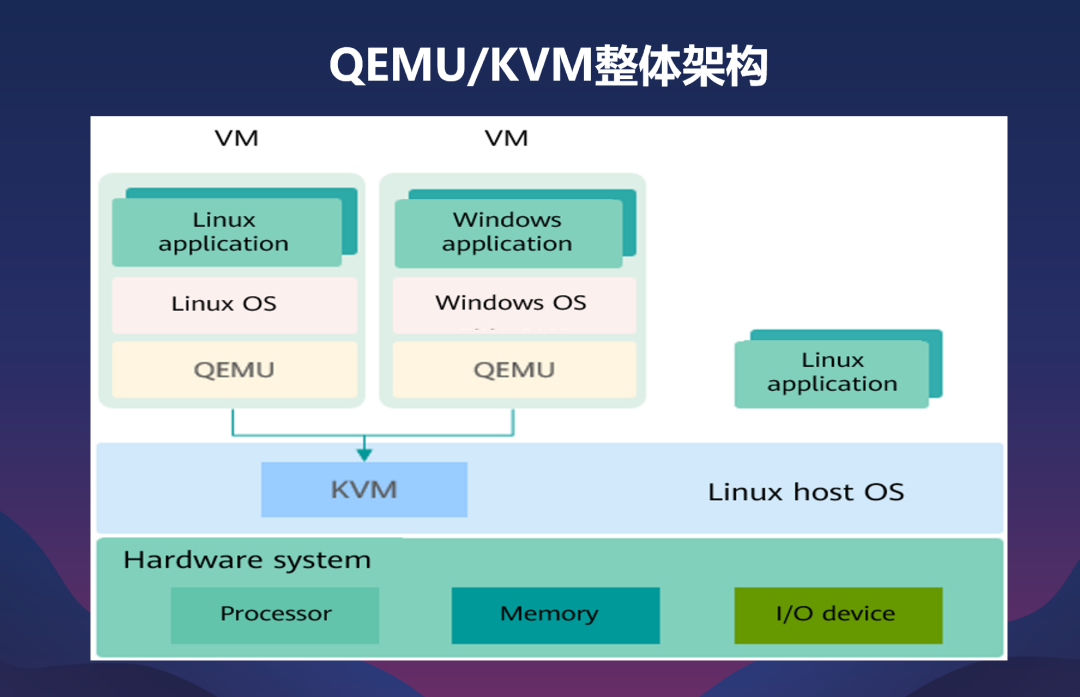 Looking at this image, we start from the bottom. The overall architecture starts with hardware, which includes CPU, memory, and devices. The Linux kernel runs on top of this hardware, and KVM, as a kernel object, runs as a driver in the kernel.Above that is our ordinary application program, and there is a special case of QEMU. QEMU also acts as an ordinary program, but it can work with the KVM driver to perform some virtualization operations. We can run guest OSs like Windows and Linux on QEMU, and they run their respective applications on top of that.After introducing the overall architecture of QEMU/KVM, let’s briefly introduce some basic principles of hardware virtualization that we may involve today. In this image, we can see two virtual machines, VM0 and VM1, running guest OSs, XP and Linux, respectively.
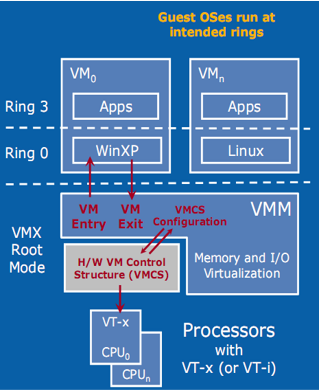 Generally speaking, if XP and Linux do not involve privileged instructions during the execution of applications in their guest OSs, such as a system call, the lower-level VMM will not intervene. The VMM only intervenes when the guest OS executes privileged instructions, such as executing CPUID in XP. At this point, the VMM will intervene because it executed a privileged instruction or encountered an exception. After the exception occurs, a VM exit will occur, and after the host (the VMM) processes it, it will return to the guest through VM entry. In summary, the VMM usually does not care about the operations inside the guest until it accesses privileged instructions or generates exceptions, at which point we care. This creates a loop between the vCPU and guest and host.After discussing CPU virtualization, let’s focus on memory virtualization, as today’s topic may be more related to memory virtualization.
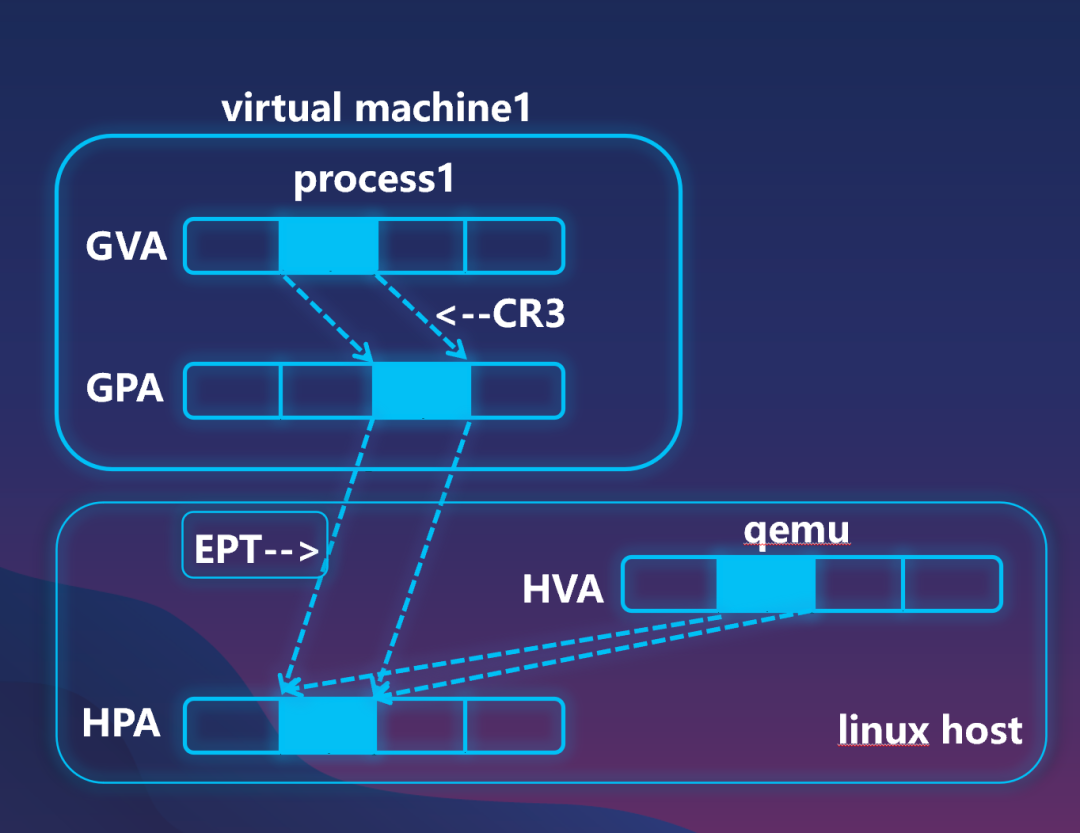 First, let’s look at this image. In a non-virtualized scenario, memory address translation is relatively simple; virtual addresses (VA) are directly translated to physical memory. In x86, this is achieved through the CR3 register pointing to the page table. With virtualization, this situation becomes more complex. The VA and physical addresses (PA) become the guest’s VA and guest’s physical memory. This translation occurs internally within the guest. However, after translating to the Guest Physical Address (GPA), the guest’s physical memory is not the final physical memory; it needs to be translated through an EPT page table to reach the final Host Physical Address (HPA). Therefore, it adds an additional step compared to a non-virtualized scenario.Besides translating from the guest’s virtual memory to its physical memory, it must also translate from the guest’s physical memory to the host’s physical memory to complete the entire translation.At the same time, we should also note that QEMU’s HVA (Host Virtual Address) maps to the host’s physical memory. Why do I mention this? Because this poses a pitfall in practice. If QEMU swaps out the HPA physical page, it can cause the GPA mapped physical page to become invalid.Then the EPT translation, as we just mentioned, is similar to the CR3 translation; it is also implemented through multi-level page tables. Within this, we can manually remove certain permissions to achieve monitoring. For example, if we remove read and write permissions, when a read or write occurs on a specific physical page within the guest, we can monitor or intercept it.Another characteristic is that EPT-related operations occur within the Linux host we just circled, which are invisible to the guest. Therefore, when we are conducting offense and defense or confrontation, we can perform dimensionality reduction attacks on some actions within the guest, such as anti-debugging, allowing us to bypass defenses.After briefly introducing the QEMU/KVM architecture and the basic principles of virtualization, we come to today’s first topic: shadow-less EPT hooks. Before discussing shadow-less EPT hooks, let’s first talk about what shadow page EPT hooks are.
03
Shadow-less EPT Hooks
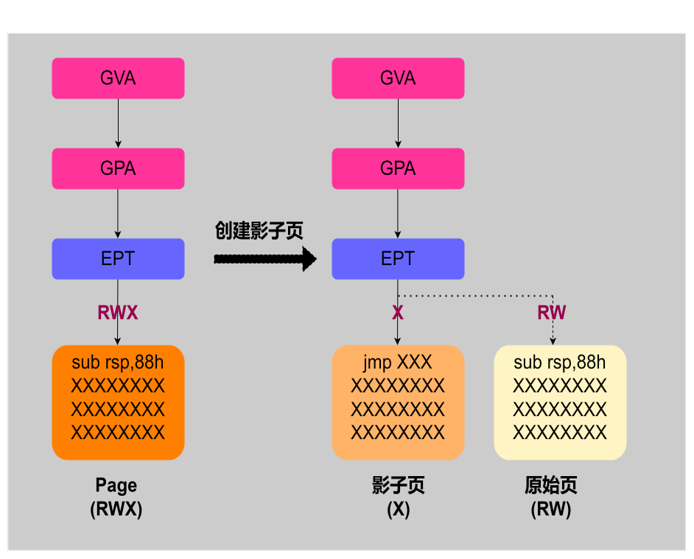
Assuming that before we perform the hook, the address translation is as described in the previous memory introduction; it translates from GVA to GPA, and the GPA is ultimately translated through EPT to the final physical page. If we assume that we need to perform a hook, we need to create a shadow page.We assume that we want to perform a hook, we can create a shadow page on this, keeping only execution permissions, and then we perform an inline hook on this shadow page. When the CPU executes the shadow page, it will trigger the hook logic. However, if PatchGuard or another program tries to read the page, we will generate an exception. Since our shadow page has only execution permissions, it will generate an exception, causing a VM exit to our host. The host captures this event, detects that you want to read an executable page, and switches to a read-write page. The read-write page contains the same content as the original page, which has not been modified. Therefore, when PatchGuard scans, it finds that the page has not been modified, but our hook logic takes effect. If subsequent CPUs execute, we switch to the read-write page. Since we currently only have read-write, if it tries to execute, we will again trigger a VM exit to switch back.In summary, when it needs to execute, we provide it with the execution page; when it needs to read and write, we provide it with the read-write page. The host is responsible for switching between the read-write and execution pages. If it reads, we provide the original content, so it finds that we have not performed a hook. What problems does this method have? Let’s look at the problems it presents. The image on the right is similar to the previous one, but it has an additional instruction. Let’s assume that we want to perform a hook on the page, and it has an instruction mov rcx,[rip]. What is the characteristic of this instruction? It reads its own page.Because we just said that if it encounters an execution page, when we want to read and write the execution page, it will switch to the read-write page. If it encounters execution and read-write pages, it will switch back to the execution page. However, this situation will cause it to read itself during execution, leading to a deadlock problem.In fact, this situation of self-reading its current page is quite common. I listed two examples below. One is that if you often disassemble the Windows kernel, you can see that many large functions in the Windows kernel have switch-case structures that generate a jump table, which resides in the current code page. When it reads, it will produce this situation.Another common case is self-modification in user mode, which is often seen in some shellcode confrontation codes. How do we improve this? Let’s look at the improvement plan.The core reason for the previous issue is that we want both execution and read-write permissions. Returning to the initial image, we can imagine that if we switch from the shadow page to the original page without removing execution permissions, then when switching from the shadow page to the original page, it can both execute and read-write.However, there is still a problem. Suppose that when we switch from the shadow page to the original page and we do not have permission to switch back, then the subsequent hook logic will fail when the CPU executes this page; the hook logic will be invalid. Therefore, we must ensure that after switching, it executes an instruction before switching back, ensuring that subsequent CPUs executing this page still have the hook logic.How do we switch back? Generally, we use MTF, which is a flag provided by x86. After setting this flag for the guest, it will execute one instruction and then generate a VM exit.The reason for this exit is MTF. It is equivalent to assuming that while executing on the shadow page, when executing an instruction that requires both execution and read-write, we step through to switch to the original page. After the original page executes this instruction, it switches back. This method resolves the issue of self-reading and self-modification mentioned earlier. What problems exist after improvement? There is actually a gap here. We mentioned that if we step through from the shadow page to the original page, we will switch to the original page, which is a readable, writable, and executable page. When we switch back, we will give it back.
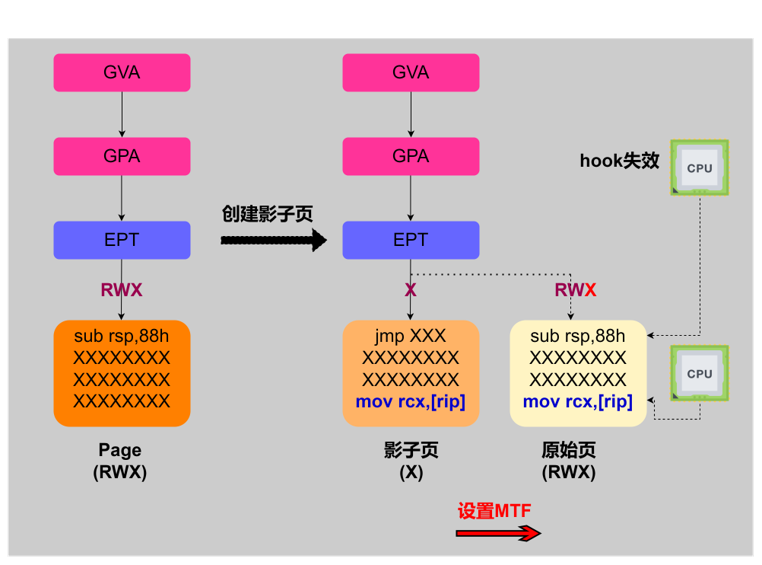
However, there is a problem. At the moment we switch to execute the single instruction, if there is another core executing this page, then the hook logic of that core will become invalid.The essence of this problem is that when one core switches page permissions, it affects another core. Suppose the following is CPU0. When CPU0 switches from the shadow page to the original page, at that moment, if another CPU executes, it means that the current CPU’s page permission switching affects another core. Generally, how do we solve this situation?We can set each core to have a separate EPT page table that maintains its own permissions, but this has some issues. One is that it requires a lot of memory since you have multiple EPT page tables, and the other is that it incurs significant performance overhead due to synchronization. The previously mentioned Hyperplatform uses this approach, but we use KVM, which is a commercial VMM that does not use separate page tables for each core; it shares a single page table. In the case of sharing a single page table, how do we solve this problem? Let’s think about it.The core point of EPT hook is page switching. Why do we switch from an execution page to a read-write page? It is because we want to deceive the CPU into reading the content before our modification. Is there a way to avoid switching pages while still deceiving the CPU into reading and writing? Our solution here is simulated execution.Let’s look at the situation of simulated execution; using simulated execution makes the entire situation much simpler. We no longer need to create a shadow page; we only need to remove the read-write permissions from the original page.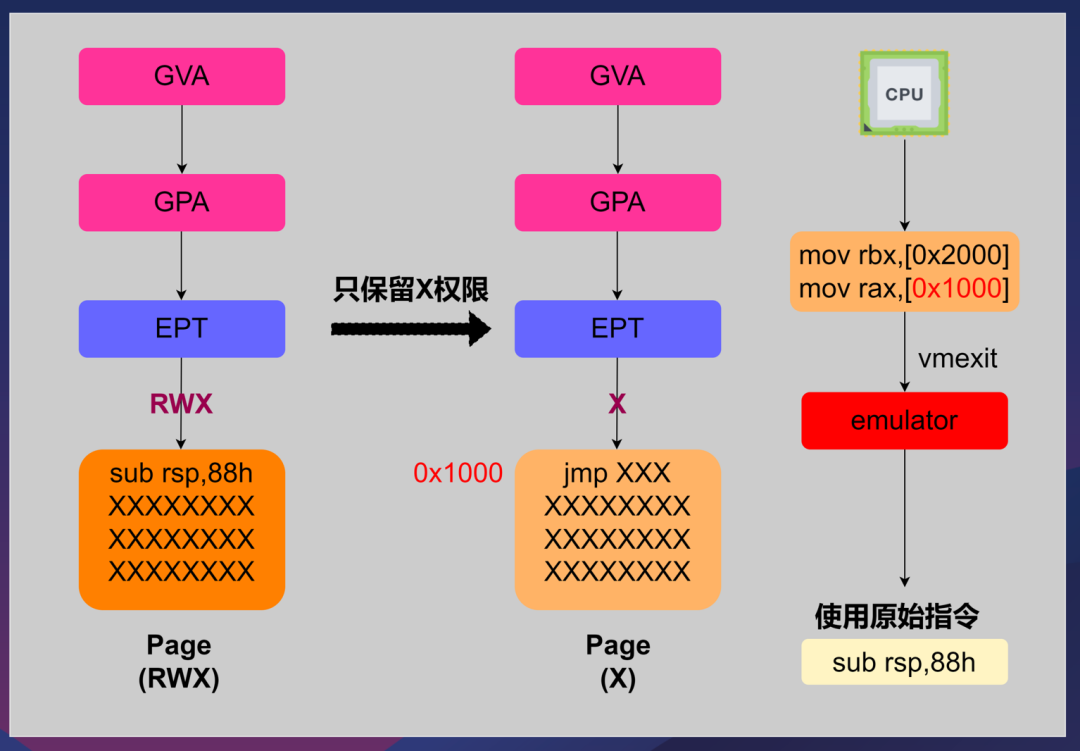 We remove the read-write permissions and keep only the execution permission. After removing the read-write logic from the original page and keeping only the execution permission, we perform an inline hook. If we assume this page is at 0x1000, we can change the header to
 jmp. When the CPU executes, it will trigger the hook logic. However, if PatchGuard tries to read this page, or if we have an example on the right where the CPU executes mov rax,[0x1000] to read this page, it will generate an exception because this page has no read-write permissions. At this point, a VM exit will occur, causing an exit to our host. The host will simulate and say, “You want to read the page at 0x1000, right?”When simulating, we give it the value of the modified content, which is still the original content sub rsp,0x88. Therefore, when it reads, it retrieves the original content, achieving deception without needing to use shadow pages.In summary, for non-EPT exceptions, such as the two instructions on the far right mov rbx,[0x2000] and mov rax,[0x1000], if we are in this example, only the 0x1000 page is set to trigger an exception, so 0x2000 will not trigger an EPT exception. For such cases, we use real execution, executing directly on the CPU. However, if it involves EPT exceptions, like the 0x1000 page, it will trigger simulated execution. In summary, we achieve simulated execution and deceive the CPU. With the simulated execution plan in place, what kind of simulator should we choose?There are many well-known simulators that are commonly used, such as Unicorn and Bochs. However, we actually choose the x86 simulator built into KVM, which was originally designed to execute MMIO operations without returning to user mode. We can directly reuse the simulator in its kernel’s emulate.c file. We need to make some modifications to the simulator, including modifying the lowest-level read and write functions and overall structures. Then we can replace the original instructions when it reads instructions, thus achieving shadow-less EPT hooks using the EPT combined with the simulator, solving the issues present in shadow pages and page switching.With this soft-hard combination approach, we can also implement other hardcore tools, such as virtualization debuggers and kernel-level trace tools, making it very easy. Next, let’s look at them in detail.
04
Virtualization Debugger
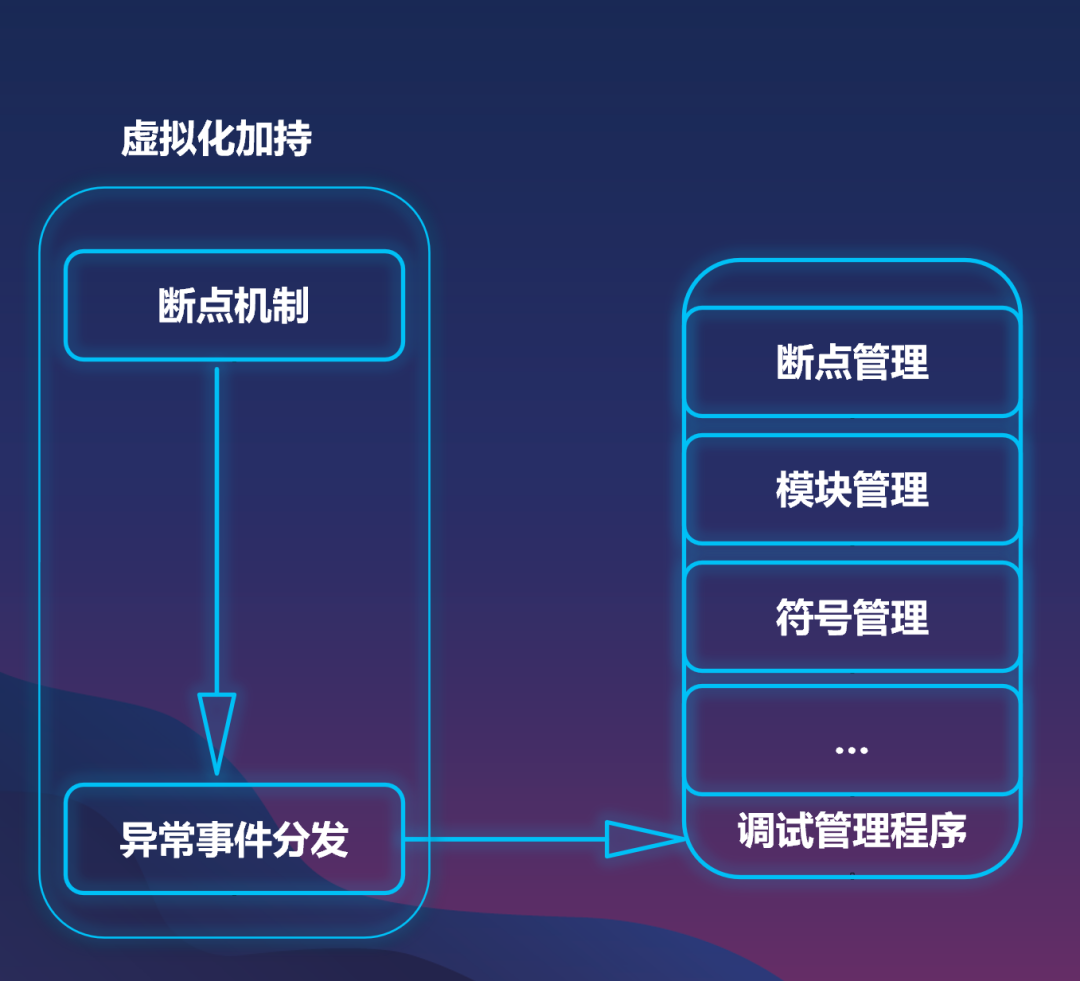 Based on the previous ideas, let’s see how to implement a virtualization debugger. Before discussing virtualization debuggers, let’s first look at ordinary debuggers. Looking at this image, a typical debugger may include several parts, such as breakpoint mechanisms, including software breakpoints and hardware breakpoints. When breakpoints are triggered, it may involve exception dispatching. For example, in Windows, it may involve a debug port, which then dispatches the event to the corresponding debug port and the debugging management program. The debugging management program may involve breakpoint management, module management, and symbol management. So, what is a virtualization debugger?What we refer to as a virtualization debugger is to implement some parts that are easily countered, such as the breakpoint mechanism you set. When you set a breakpoint, it may be detected.Another aspect is the exception event dispatching, which may involve debug ports and is also easily detectable. We implement these easily detectable parts through virtualization, making anti-debugging or anti-analysis completely ineffective against us.Since the exception event dispatching may involve many points, today we will focus on how to use virtualization to implement our breakpoint mechanism.
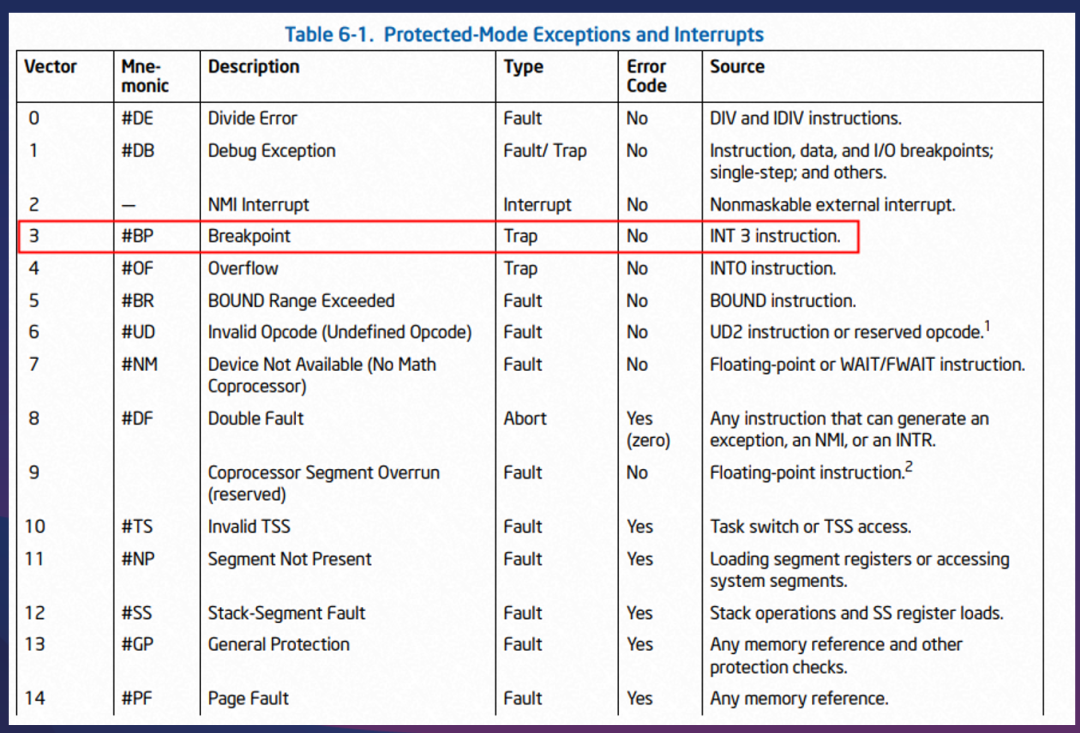 We know that it generally includes software breakpoints and hardware breakpoints. First, let’s take a simple introduction to the basic principles of software breakpoints. In x86, software breakpoints are quite simple and are represented by the
 int3 instruction, whose binary code is 0xcc. When we set a software breakpoint, the program executes the int3 instruction, triggering an exception.Afterwards, this exception will be dispatched through the previously mentioned exception event dispatching, and it will be dispatched to our debugger. After the debugger receives this exception, it can handle the breakpoint.As we mentioned, this breakpoint requires writing an int3, so it is easily countered. Common countermeasures include calculating a CRC for the function. If it changes, we detect it, or we check the function header to see if it is still the 0xcc instruction.Now let’s look at a specific counterexample. This example is quite simple; it repeatedly opens a file, such as a.txt, and continuously performs operations. However, it subsequently checks whether the CreateFile header has been set with a software breakpoint. If a software breakpoint is set, it will trigger an exception and exit the process.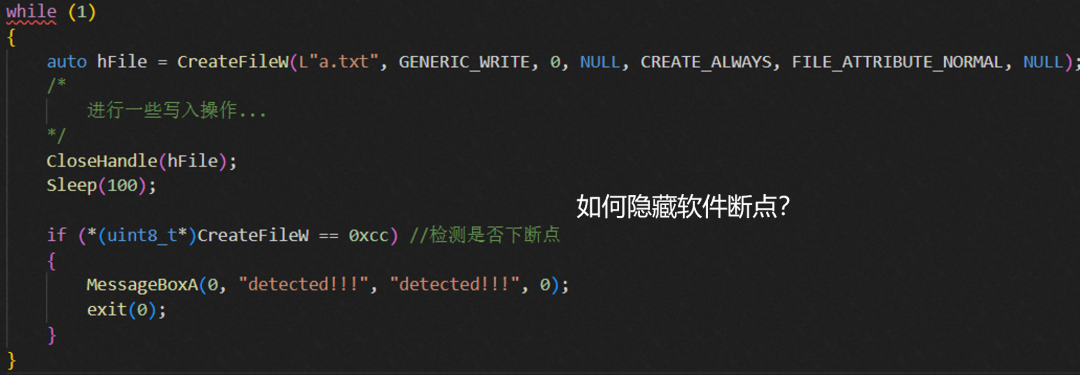 Assuming we want to debug this program but want to set a software breakpoint on
 CreateFile, how do we hide this software breakpoint? With the EPT hook plan we just discussed, hiding a software breakpoint becomes very simple. As we just mentioned, the EPT hook requires performing an inline hook on that page. At this point, we can also remove the read-write permissions from the original page and insert a software breakpoint int3 at the top of the execution page. At this point, if the program checks for the breakpoint, it will attempt to read and write to this page. This read-write will trigger our VM exit to the host.The host will use the simulator, and the simulator will provide a fake instruction, allowing it to read the original content sub rsp,0x88, so it will not detect the software breakpoint we set.After introducing how to hide software breakpoints, how do we create a debugger that has the ability to hide software breakpoints? If you study anti-debugging, you should be aware of similar products like HyperDbg, which is a debugger developed from scratch using virtualization. However, we find that developing from scratch poses some issues: one is the workload is large, as it needs to rewrite both the virtualization layer and the debugging interaction layer.
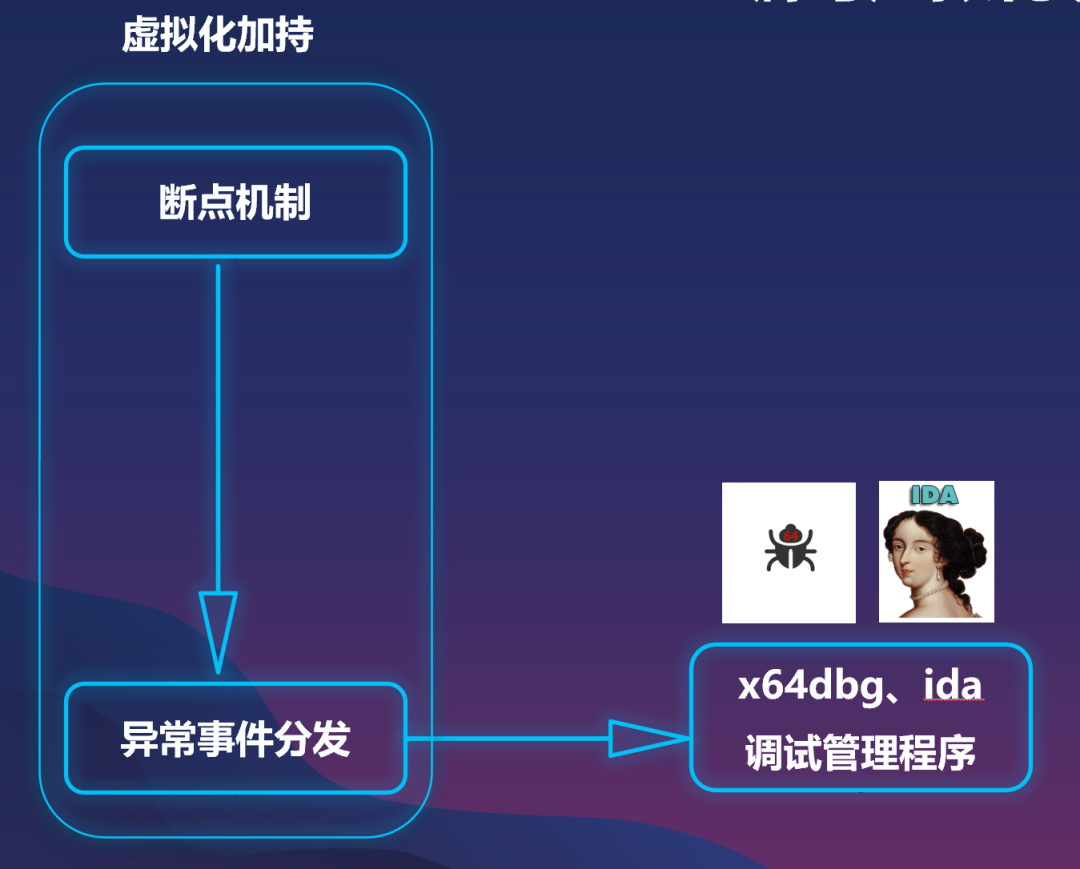
Another issue is that the overall interaction is not as user-friendly as commercial products, such as IDA. Additionally, the cost of switching users from other debuggers is relatively high. Therefore, our method for writing a virtualization debugger is to enhance existing debuggers, such as the popular x64dbg and IDA. This way, we have a lower switching cost and the original debugger is a commercial product, ensuring stability. However, there is an issue: products like x64dbg are open-source, allowing us to easily find where to set breakpoints in the process. Therefore, we can modify the breakpoint-setting process to turn it into a hidden software breakpoint.But for closed-source products like IDA, how do we modify it? Assuming we are not patching anything, how do we add a hidden software breakpoint? Let’s first look at the left image, which illustrates the process of IDA setting a software breakpoint in a non-virtualized scenario. We can see that its main process involves writing an int3 into the debugged process, followed by calling ReadProcessMemory to use the system’s user-mode API to perform the write operation, which ultimately leads to MmCopyVirtualMemory in the kernel.Now that we have virtualization, we can perform an EPT hook on MmCopyVirtualMemory. After entering the EPT hook point, we can check whether IDA is setting a software breakpoint. If it is setting a software breakpoint, we can use a VM call to notify our KVM below, allowing KVM to convert the explicit software breakpoint into a hidden software breakpoint according to the principles we discussed earlier. Let’s look at a specific example of hiding a software breakpoint.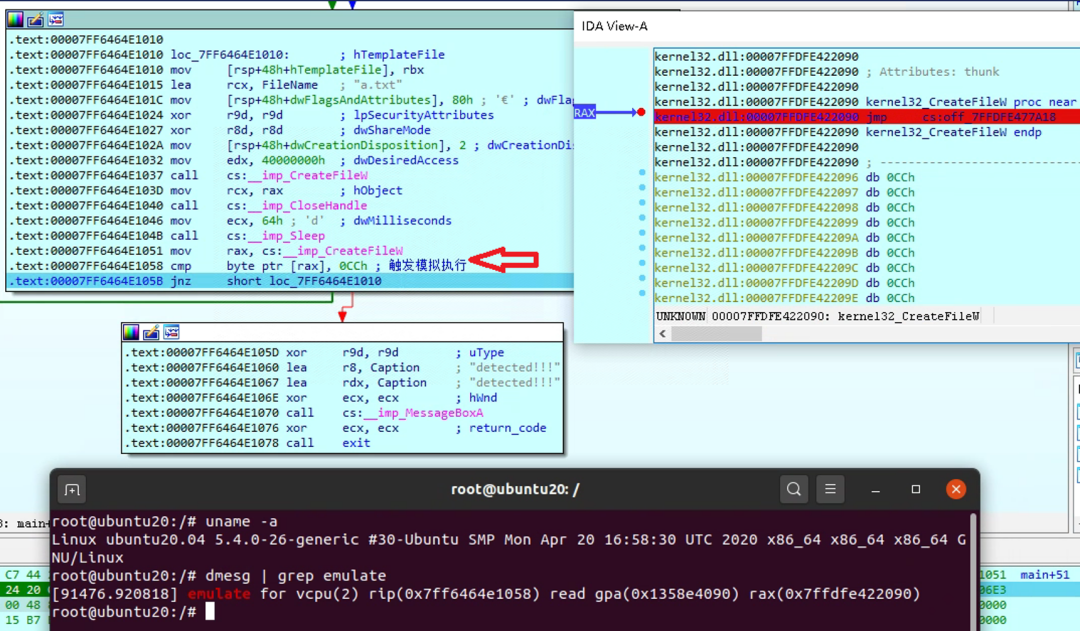 In the upper left corner of this image is the compiled assembly of the program we just mentioned, which continuously operates on files. After performing file operations, it sleeps for a while and then checks whether
 CreateFile has been set with a breakpoint. If it detects a breakpoint, it will proceed to the exception exit process, indicating that it has detected a debugger. However, in this image, we indeed set a breakpoint there, but it will not exit. Why?Because the instruction in the arrow triggers simulated execution, and simulated execution deceives it.Let’s look at the logs printed from KVM. We can see that the simulated execution’s rip is 0x7ff646411058, which corresponds to the rip in the arrow. Now, let’s look at a video demonstration. This is on a physical Ubuntu machine running a Windows guest. Our Ubuntu kernel is 5.4.0, and the Windows kernel version is 18363. First, let’s demonstrate the scenario without virtualization support. We will see how the software breakpoint detection example behaves without virtualization support.It will continuously perform file operations and then check for a software breakpoint. We will see how it behaves when it executes that instruction. As expected, since we do not set a breakpoint on CreateFile, it will be able to execute continuously.Now, let’s set a software breakpoint on CreateFile. We can see that the address of CreateFile is 7ffb251d2090. We remember this value, and the logs will show it later. The difference in setting the breakpoint now is that in addition to writing an int3, we also remove the read-write permissions from the page where CreateFile resides. Let’s see if we can trigger it now and whether the breakpoint can be detected.After setting the breakpoint, we can see that it indeed triggers, which means our breakpoint was successfully set.Now let’s see if it goes into the exception exit process. We will check if the instruction 7ff6c78c1058 can detect our breakpoint. Running it, we can see that this time it does not go into the exception exit process. The flashing arrow indicates it continues in the original program flow, not entering the exception exit process.We can see that it executes that instruction, and as we mentioned, it is simulated execution. We can see it has left a simulated execution log.Now let’s check KVM’s logs. It indicates that the simulated IP is 7ff6c78c1058, and during simulation, it has deceived the process, effectively substituting the original instruction.I specifically printed out the rax register, which corresponds to the virtual memory of CreateFile. The GPA here is the guest’s virtual memory corresponding to the guest’s physical memory. After running it again, we can see more logs, and the breakpoint still triggers, indicating that our breakpoint remains effective.We can see that it has also logged the simulated execution logic. If we remove the breakpoint now, it will no longer have simulated execution logic, effectively bypassing it.Let me share some pitfalls I encountered during practice. The first issue is that the guest memory may be swapped to disk. For example, if CreateFile is in a DLL, the system may map all processes’ DLLs to the same physical memory to save memory. In this case, the mapping between GVA and GPA becomes non-unique. If we set a breakpoint, we need to change the GPA permissions, which will affect all processes.How do we ensure uniqueness? Our method is to write a segment of identical content into it, which will trigger a copy-on-write (COW) operation, making the GVA to GPA mapping unique.The second issue is EPT exceptions caused by QEMU swapping pages. At the beginning of our introduction to memory virtualization, we specifically mentioned that the mapping relationship between QEMU’s HVA and HPA will affect EPT mapping. Therefore, when QEMU swaps pages, the relationship between its HPA and HPA is effectively switched. Our solution here is to add a mlock at startup, effectively locking the mapping relationship.After discussing software breakpoints, let’s briefly discuss hardware breakpoints. x86 provides eight debug registers, from dr0 to dr7, for hardware debugging. The first four, dr0 to dr3, are hardware breakpoint registers where we can place memory or I/O addresses. When the CPU executes and meets the conditions, it will stop. Generally, we can use them to monitor data reads and writes, hence they are also called data breakpoints.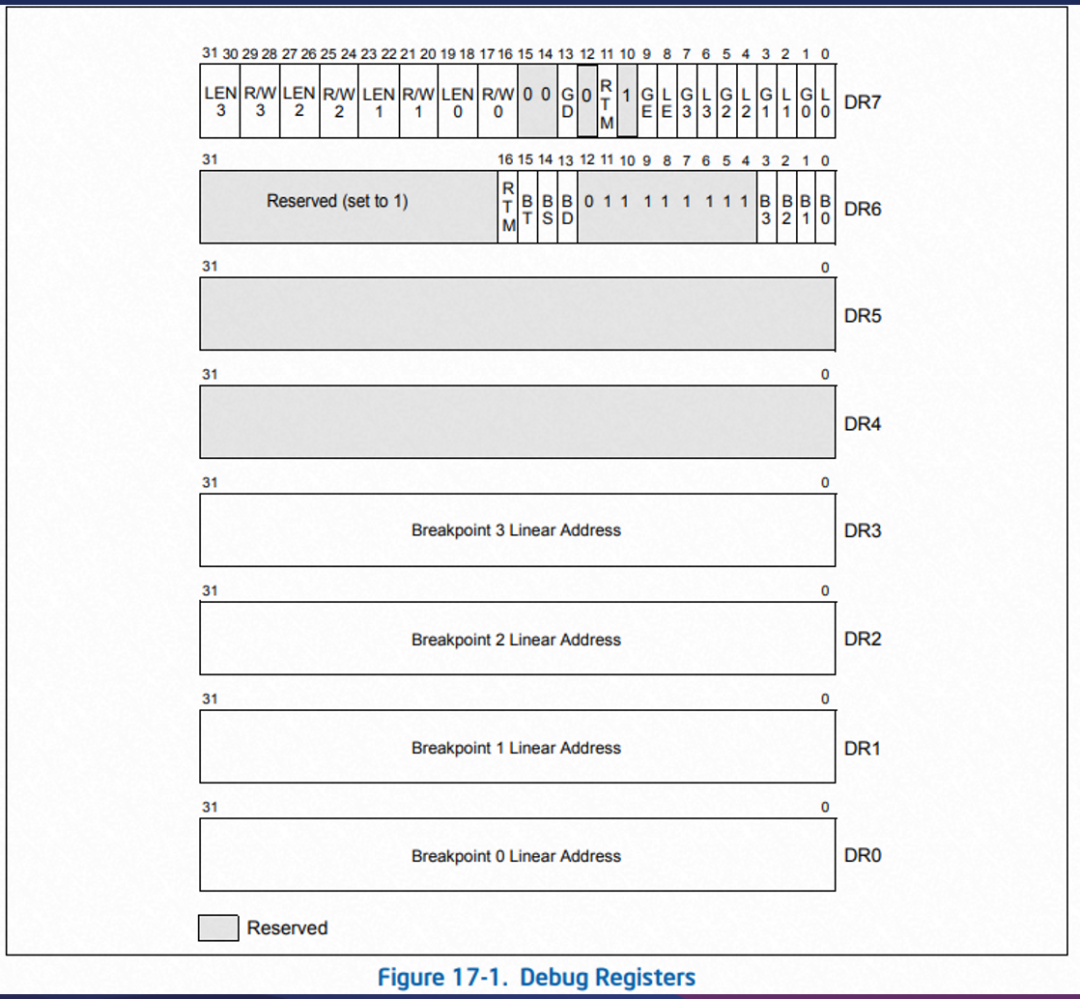 Hardware breakpoints are powerful because they are a mechanism provided by the CPU itself, but their drawback is that there are only four of them, as they only include
 dr0 to dr3, and they are also relatively easy to detect.Let’s look at a specific detection example. This example is also quite simple; it repeatedly reads a global variable and prints it. After printing, it checks whether any of the debug registers are set. If any are set, it indicates that someone has set a hardware breakpoint. For example, if we set a hardware breakpoint on the global variable, dr0 will have a value. If dr0 has a value, it will trigger an exception, indicating that it has detected a debugger setting a hardware breakpoint.How do we hide hardware breakpoints? With the EPT hook plan, hiding hardware breakpoints becomes very simple. It does not even require patching memory. Suppose we want to monitor who reads or writes to the address 0x1000. We simply need to remove the read-write permissions from that page. When someone reads or writes to it, it will trigger a simulator logic, and that logic will match the current thread’s breakpoint. If it matches successfully, it will inject a #DB exception into the guest. Injecting a #DB exception is relatively straightforward; we have existing functions in KVM for this. One tricky part is how to obtain the current thread of the guest within the host and KVM, which has many pitfalls. Let’s see how we can obtain the current thread of the guest in KVM.First, let’s look at how the guest obtains its current thread. Taking the Windows 64-bit kernel as an example, we can see that the code is quite simple. It retrieves the current thread by taking the base offset of gs register at 188 and reading memory. We might intuitively think that the way to obtain it in KVM is to execute this code. However, this is clearly not feasible because, at this point, gs is not pointing to the guest, and cr3 has switched from the guest to the host, making the memory inaccessible.We use another solution: the GS base refers to the GS when the guest exits, which is correct. However, we found that it needs to be corrected; there are issues. After correcting, we obtain the correct GS base. Then, we can use a KVM-provided function, kvm_read_guest_virt, to read. The principle of this function is that it manually parses the cr3 page table to read the corresponding final physical memory in the guest. However, we found that this function checks the VCPU’s CPL (current privilege level), so in practice, we cannot use this function. Instead, we need to use a lower-level function and manually set the CPL to 0. The video demonstration of hardware breakpoints is similar to software breakpoints; we just need to place it in the vt_hidden directory, and it will automatically gain the ability to hide hardware breakpoints.
05
Kernel-Level Trace
Next, let’s discuss how to implement a kernel-level trace based on the previous ideas. Before discussing kernel-level traces, let’s first talk about user-mode traces. This image shows a binary instrumentation tool based on Intel Pin, which implements a trace tool. It can display the instruction sequence for executing ls. The instruction sequence shown here is not complete; it should also include other registers. This instruction sequence is very useful in practice, for example, in unpacking scenarios, where we want to determine when we reach the entry point of a shell or in virtualization and VMP scenarios. If we combine the instruction sequence with LLVM’s IR and symbolic execution, we can achieve optimization for single-branch virtualization, resulting in excellent effects.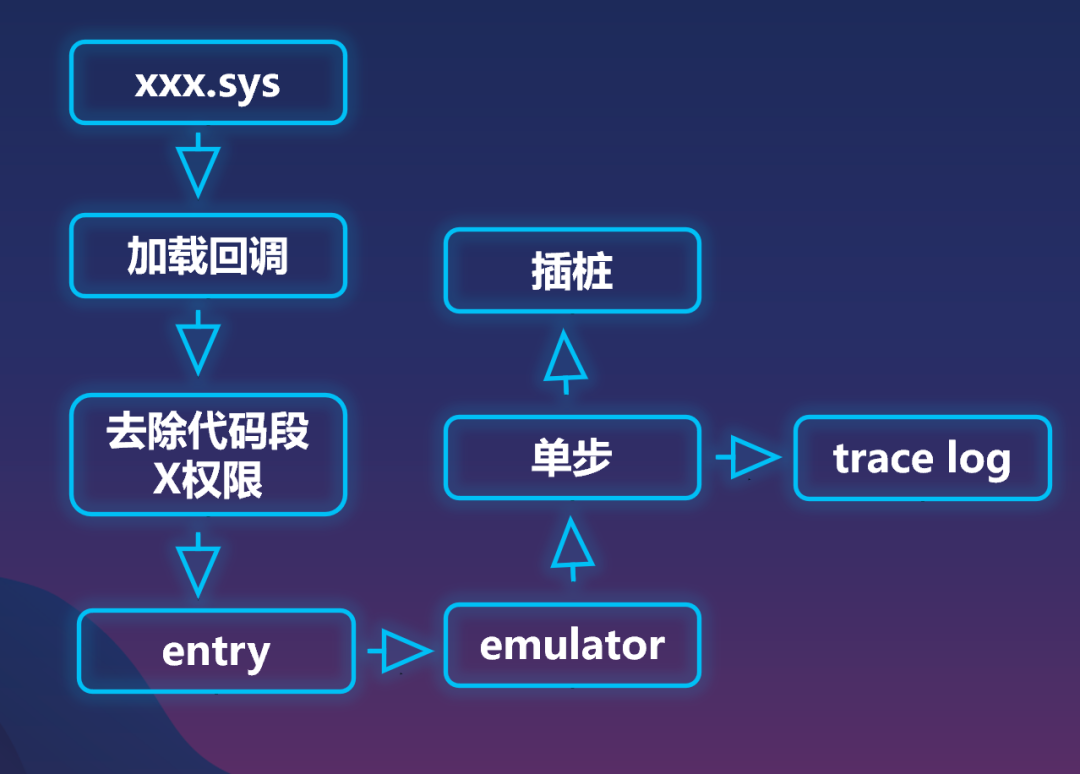 Another common binary analysis scenario is that this information is comprehensive, allowing us to check for any malicious behavior. This is an example of user-mode tracing, where all instructions are traced.However, we found that tools like Intel Pin and others only support user mode and do not support kernel mode. How do we leverage the previous ideas and use hardware virtualization to implement a kernel-level trace? For example, if we want to print all instructions executed by a driver, or if we want to unpack its VMP shell, how do we achieve that?The overall idea is still based on real execution combined with simulated execution. Let’s see how to generate a trace for a driver program.Suppose we have a
 xxx.sys driver, and we register a load callback. When it loads, we can sense it. After sensing, we use virtualization to remove its execution permissions, and when it tries to execute its entry point, it will generate an exception. This will lead to a VM exit to our KVM, where we will use the simulator to simulate the execution of this instruction.By simulating this instruction, we can step through one instruction at a time, thus obtaining a trace log.Moreover, during simulation, we can also modify its registers and memory, allowing us to implement kernel-level instrumentation functionality.Our method, compared to others, such as using a debugger to generate traces by stepping through, is more effective. It can generate trace logs without the noise associated with pure QEMU simulations, and we won’t be detected like we would in a debugger. This introduces how we can achieve a kernel-level trace tool through a combination of soft and hard methods.
06
Conclusion
We mainly introduced how to leverage the characteristics of hardware virtualization combined with simulators to implement shadow-less EPT hooks, solving some problems present in traditional methods. We also introduced how to build our virtualization debugger and kernel-level tracing tools based on QEMU/KVM. There may also be sandboxing and other tools, which will not be elaborated on here.My sharing ends here. Thank you all.Note: The PPT and replay video of the summit topic have been uploaded to 【Kanxue Course】https://www.kanxue.com/book-leaflet-153.htm
PPT and replay video are charged for【non-ticket holders】;
For【ticket holders】, it’s free: We have sent the “redemption code” to your phone via SMS. Please redeem it as instructed~ (If you haven’t received it, please add the staff WeChat: kanxuecom, note “2022 SDC” and send the conference order screenshot)

《Kanxue 2022 SDC》
https://www.kanxue.com/book-leaflet-153.htm
Long press to identify the mini program to participate in the lottery
(1) Publicly forward this article (do not set groups)
(2) You need to show a screenshot of the WeChat Moments when redeeming
 – End –
 Click “Read Original” to get the complete PPT and replay video of the topic!