Experimental Scenario
1 Introduction
Recently, while reviewing exam papers, I encountered an innovative question based on photoresistors. Inspired by this, I decided to design a clever experiment using Phyphox and ESP32 to see if I could measure my own heart rate.
2 Design Idea
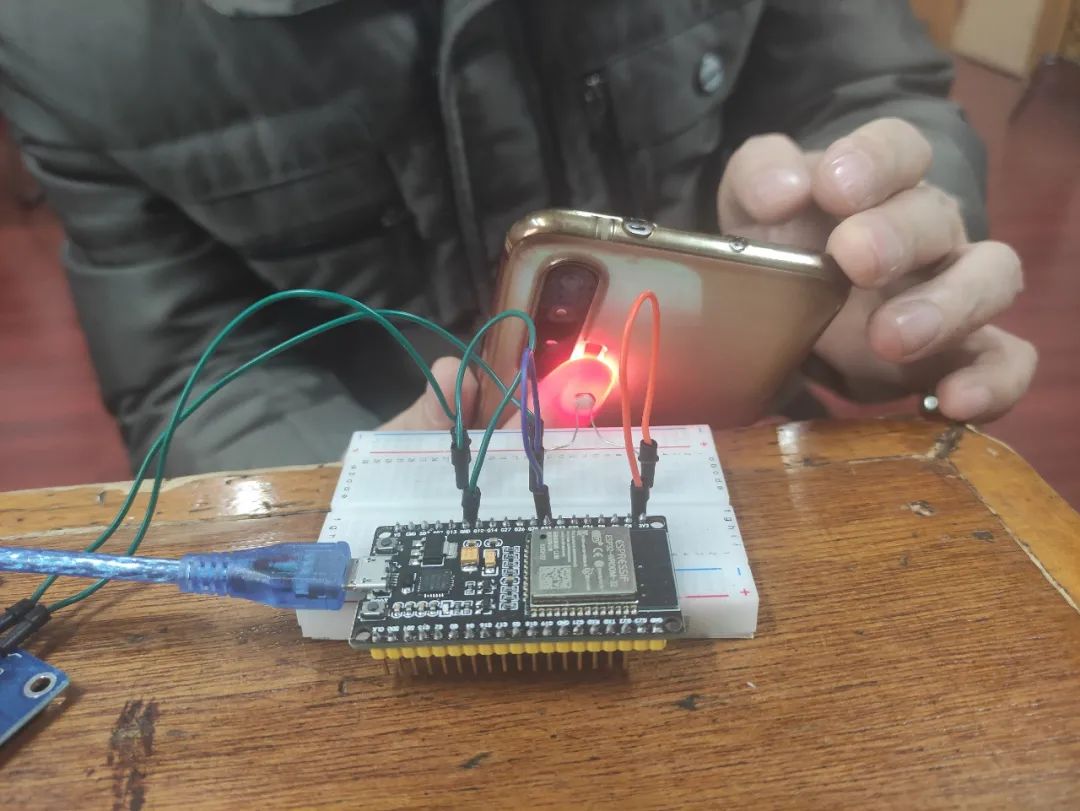
Utilizing the combination of Phyphox and ESP32 to measure the resistance value of the photoresistor, I then turned on the flashlight on my smartphone, using the pad of my index finger to cover the flashlight while positioning my fingernail directly against the light-receiving surface of the photoresistor. Since the blood circulation in the pad of the index finger is driven by the heart’s pumping action, the heartbeat will inevitably cause periodic changes in the blood volume within the pad of the finger. These periodic changes in blood volume will, in turn, lead to periodic changes in the light intensity after passing through the finger, which will cause periodic changes in the resistance value of the photoresistor. If I can capture the periodic changes in the resistance value of the photoresistor using the combination of Phyphox and ESP32, that period will correspond to the heartbeat cycle.
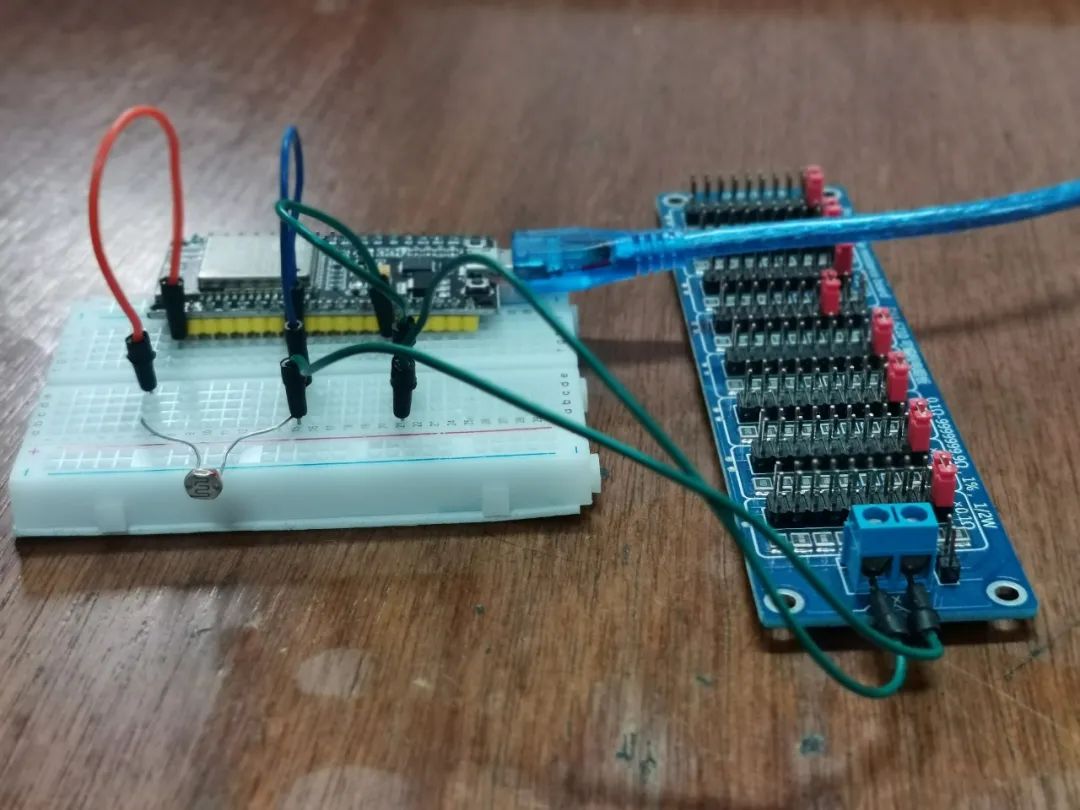
Experimental Circuit
With ease, I directly copied the experimental circuit from my previous research on the characteristics of photoresistors, making no modifications to the circuit connections or program uploads; I only needed to ensure that the experimental circuit was in a normal state.
3 Early Research
Exploring the relationship between the resistance value of the photoresistor and light intensity using ESP32 and Phyphox.
Improvements and applications of the Arduino-based photoresistor experiment.
Investigating the relationship between the current of the photoresistor and light intensity using Phyphox and ESP32 Bluetooth.
Conducting experiments on the conductive properties of photoresistors using Phyphox and ESP32 Bluetooth.
4 Experimental Debugging
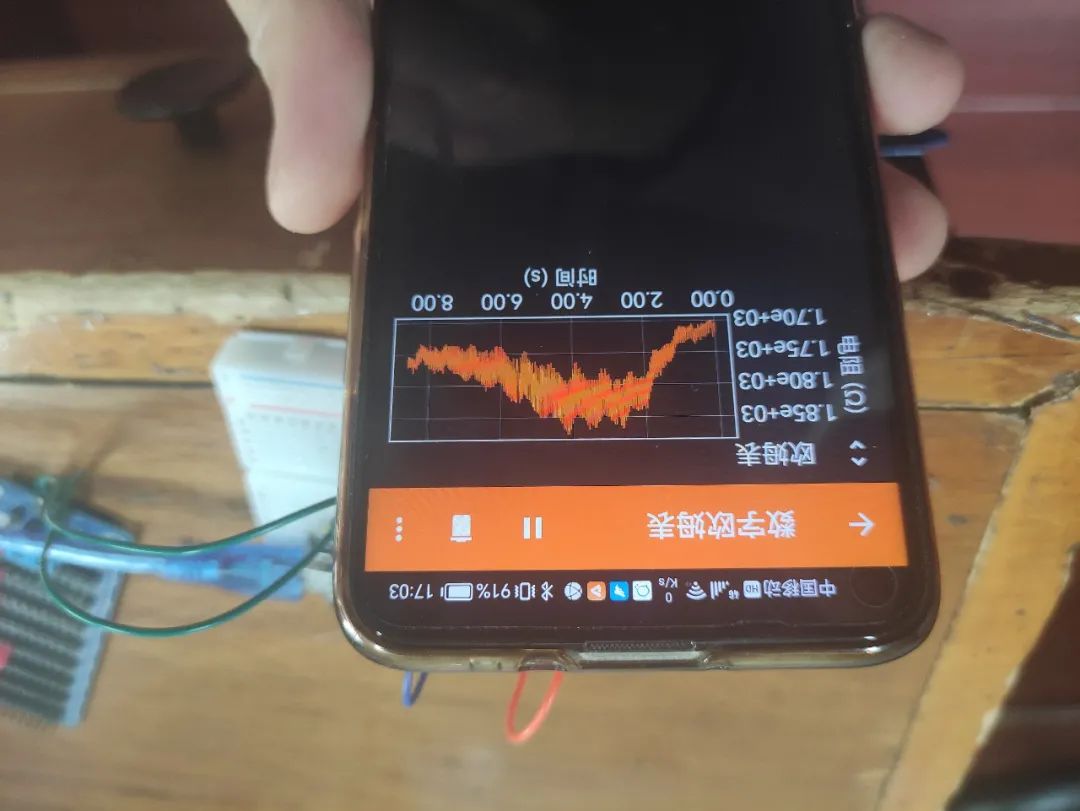
Establishing a Bluetooth connection between the smartphone and ESP32, running the Phyphox experimental program, and gently waving my hand over the photoresistor, I could see the waveform changes of the resistance-time curve on the smartphone screen.
5 Experimental Implementation
Turning on the flashlight on the smartphone, covering it with the pad of my index finger, and positioning my fingernail against the light-receiving surface of the photoresistor, the exciting waveform appeared on the smartphone screen.
Experimental Scenario
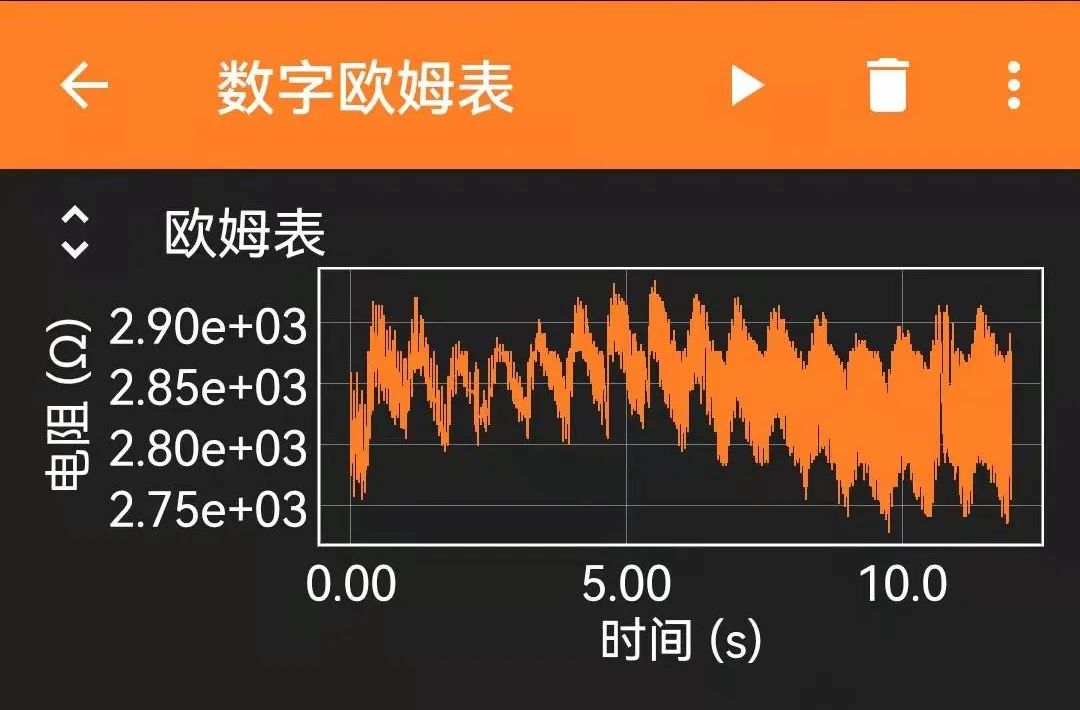
Experimental Data
Expanding the resistance-time graph obtained from the experiment to full screen, the time for 10 cycles was measured to be 7.41 seconds, indicating the heartbeat cycle is 0.741 seconds.
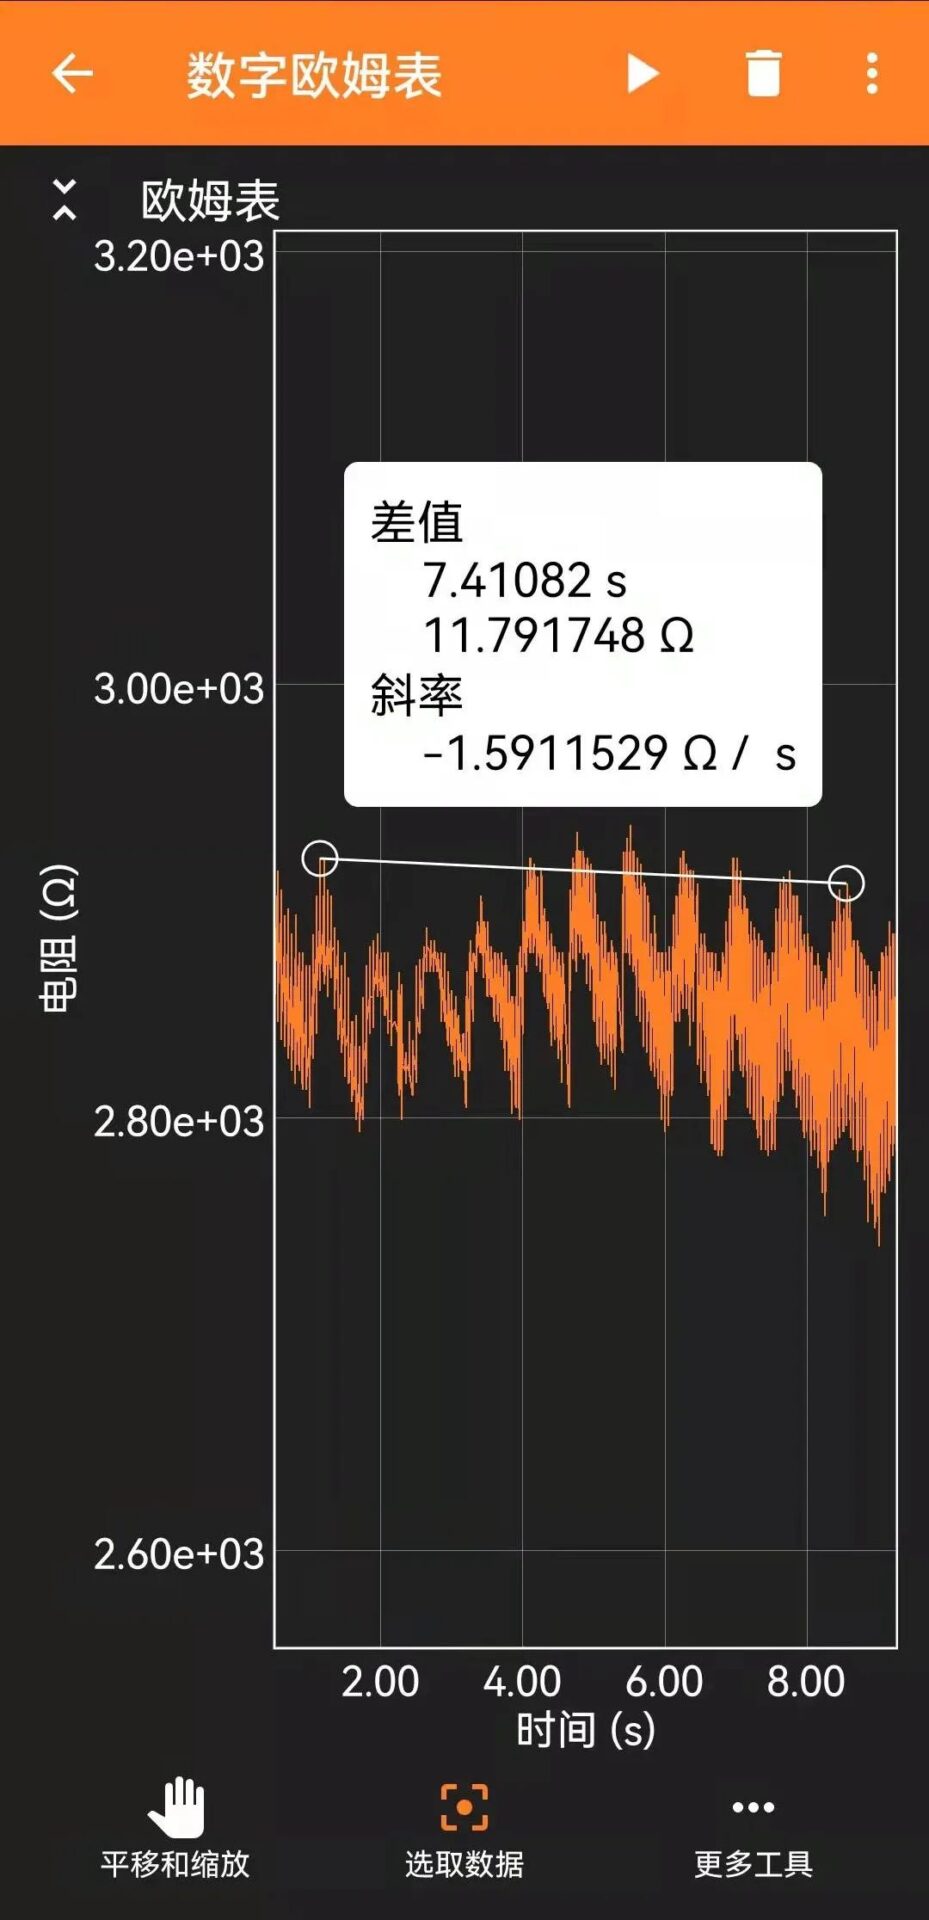
Data Analysis
Converting the data into a commonly accepted format, it can be determined that the heart beats approximately 80.97 times in one minute, resulting in a heart rate of 80.97 beats per minute.
5 Insights
Imagine, during the teaching of the “Sensors” section in high school physics, if this device were used to explore the relationship between the resistance value of the photoresistor and light intensity, and then have a few students come up to measure their heart rates, it would surely be very interesting and unforgettable.