Remote Debugging of MIPS Executables with QEMU and IDA

Remote Debugging of MIPS Executables with QEMU and IDA

Introduction Remote debugging with QEMU is quite simple; just enable the -g parameter to bind to a local port. However, IDA requires some configuration to debug MIPS architecture binary files and pause processes for debugging. (There are many online tutorials on how to run IDA in Linux and set up the buildroot environment, or feel … Read more

Key Considerations for Zephyr Driver Initialization

Key Considerations for Zephyr Driver Initialization

1. Basic Mechanism of Driver Initialization Zephyr’s driver initialization is implemented through the following mechanisms: Device Tree : Hardware resources are defined through the device tree, and the driver relies on this information for initialization. Initialization Macros (DEVICE_DT_DEFINE and DEVICE_DEFINE) : The driver registers to Zephyr’s device model using these macros. Initialization Priority : The … Read more

Essential Tools and Devices for Embedded Development

Essential Tools and Devices for Embedded Development

For technology enthusiasts aspiring to enter the field of embedded development, understanding and preparing the relevant tools and devices is an important step in starting this journey. This article will detail the indispensable tools and devices in the embedded development process. 01 Development Tools 1. Development Boards The development board is the core hardware platform … Read more

Mastering Byteman: Dynamic Debugging and Fault Injection for Java

Mastering Byteman: Dynamic Debugging and Fault Injection for Java

As a Java programmer, have you encountered these issues: online faults that are hard to reproduce, debugging processes that are difficult to start, and testing scenarios that cannot cover edge conditions? Don’t worry, today I’m going to introduce you to a powerful tool: Byteman. It allows you to dynamically modify the behavior of Java applications … Read more

How to Debug FPGA Using Internal Logic Analyzers?

How to Debug FPGA Using Internal Logic Analyzers?

1 Reasons Driving Change in FPGA Debugging Technology The reprogramming capability of FPGAs is a key advantage in the functional debugging of hardware designs. In the early days of using CPLDs and FPGAs, when a design was found to be malfunctioning, engineers would use the “debug hook” method. They would route the internal signals of … Read more

Introduction to PROFIBUS Connection Debugging Cases

Introduction to PROFIBUS Connection Debugging Cases

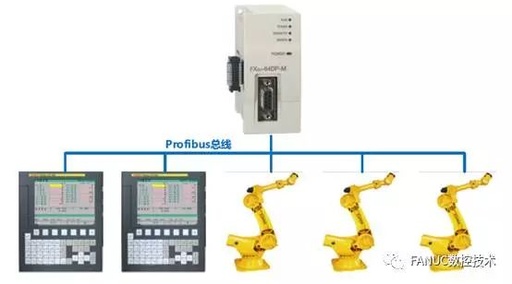
PROFIBUS is an international, open, fieldbus standard that is independent of device manufacturers. The transmission speed can be selected from 9.6 kbaud to 12 Mbaud, and when the bus system starts, all devices connected to the bus should be set to the same speed. It is used for factory automation at the workshop level for … Read more

Understanding SWD Download Communication Principles

Understanding SWD Download Communication Principles

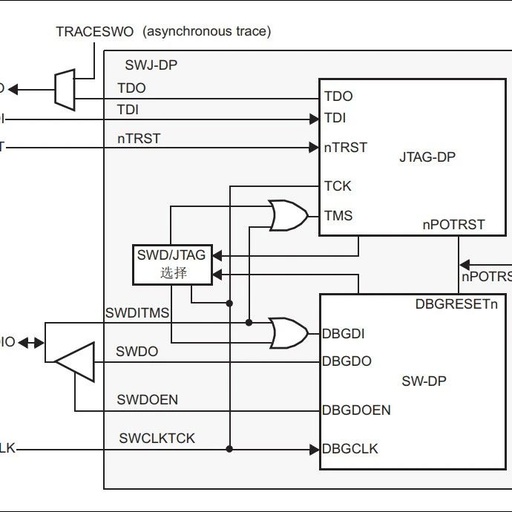
Follow+Star PublicAccount, don’t miss exciting content Author | strongerHuang WeChat Public Account | Embedded Column The mainstream download interfaces for microcontrollers based on the Cortex-M core are JTAG and SWD. Differences Between SWD and JTAG Pins: JTAG: TDI: Test Data In. Serial input pin TDO: Test Data Out, serial output pin TCK: Test Clock, clock … Read more

SWD Low-Level Implementation Principles

SWD Low-Level Implementation Principles

Author | strongerHuang WeChat Official Account | Embedded Column The mainstream download interfaces for microcontrollers based on the Cortex-M core are JTAG and SWD. Differences Between SWD and JTAG Pins: JTAG: TDI:Test Data In. Serial input pin TDO:Test Data Out, serial output pin TCK:Test Clock, clock pin TMS:Test Mode Select, mode select (control signal) pin … Read more

C++ Debugging Tips: How to Quickly Locate Issues with GDB

C++ Debugging Tips: How to Quickly Locate Issues with GDB

Writing code inevitably leads to bugs. Using print statements to check values? That’s too basic! Today, let’s have a good talk about using GDB, the debugging tool. Don’t be fooled by its simple interface; its debugging capabilities are truly powerful! What is GDB? Simply put, GDB is a command-line debugging tool that allows you to … Read more

Advanced Linux Debugging Techniques: GDB Reverse Debugging Made Easy

Advanced Linux Debugging Techniques: GDB Reverse Debugging Made Easy

Reverse Debugging has a cool nickname – Time Travel Debugging. Yes, you read that right, it’s time travel debugging! Just looking at the name, you can tell how amazing it is! To explain it clearly, this article is quite long, so please read patiently; it won’t disappoint you! Introduction When debugging programs, have you encountered … Read more