Introduction
Remote debugging with QEMU is quite simple; just enable the -g parameter to bind to a local port. However, IDA requires some configuration to debug MIPS architecture binary files and pause processes for debugging. (There are many online tutorials on how to run IDA in Linux and set up the buildroot environment, or feel free to reach out to me for discussions.)
QEMU Usage Mode
The usage mode is for running a single executable file. Since some executables require runtime libraries, it is necessary to use the chroot command to change the root path to the root directory of the file system of the target executable.
Additionally, when using QEMU to emulate executable files, it relies on certain system library files from the host machine. The method I used is straightforward: I directly copied some library files from the host machine to the absolute path in the target file system after chroot, so that it can run normally. The steps are as follows:
cd squashfs/   # Enter the root directory of the executable file to be emulated
cp $(which qemu-mips) ./    # Copy the QEMU executable file for the corresponding architecture to the current folder for easier execution. The specific architecture to copy can be determined using readelf -h file.
ldd qemu-mips    # Check the dependencies required by qemu-mips, as shown in the figure below. The first line, linux-vdso.so.1, resides in the memory of Linux and does not need to be copied manually: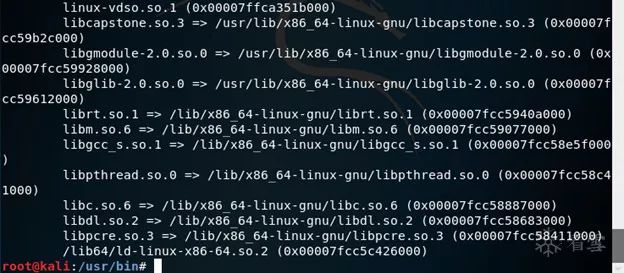
Use a simple and straightforward script to copy the dependencies to the corresponding locations:
gedit move.sh # Write a script to copy dependencies to the corresponding locations in the file system of the target executable, the content of move.sh is as follows: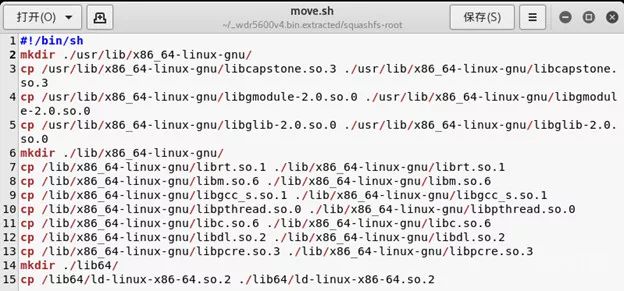
Now you can normally use the combination of chroot and QEMU usage mode.
Using the chroot command, combined with the previous qemu-mips environment, run any executable file within the firmware:

The parameters passed to the uhttpd service are as follows:
-
-p: Listening port
-
-h: HTTP file root directory location
-
-c: HTTP configuration file location
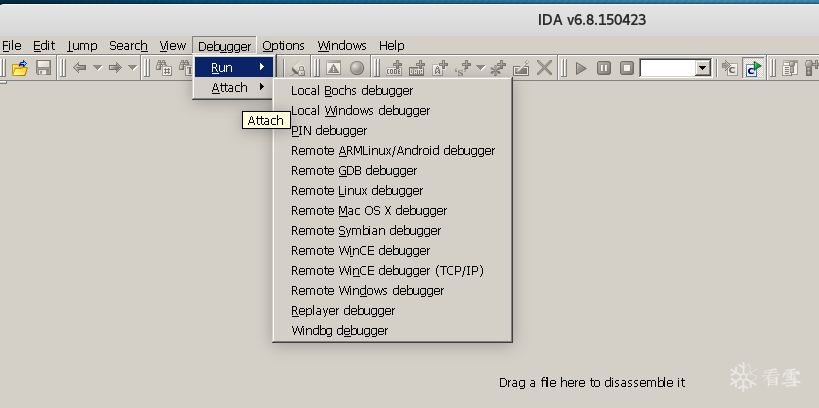
As you can see, the uhttpd service was not executed directly, but is waiting for us to connect and debug. On the other side, open IDA, select Debugger, and choose Remote gdb debugger:
A dialog box pops up as follows:
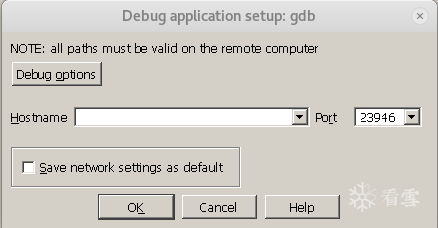
Fill in the hostname with the IP of the host running the executable program to be debugged, and fill in the Port with the port number attached with the -g parameter. Save the completed configuration as the default network settings.
Since we are debugging a MIPS architecture executable file, we need to click on Debug options in the above image for advanced settings. First, check the Suspend on debugging start option under Events, which means to pause the process at the start of debugging:
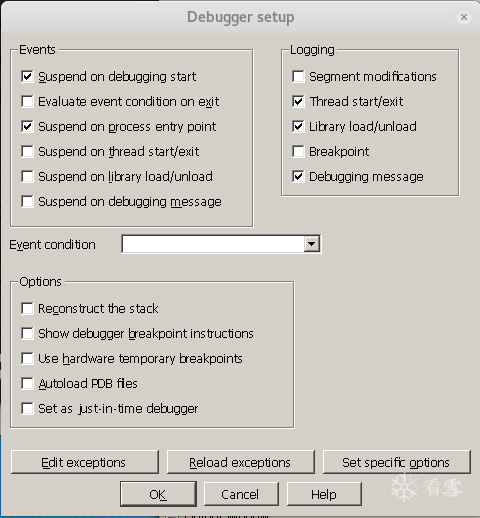
Next, the key point is to specify the architecture of the target process. In the lower right corner of the above image, select mips in the Set specific options:
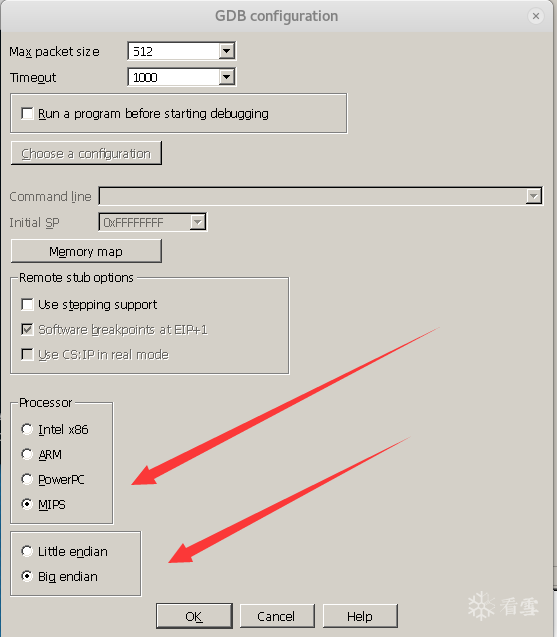
After selecting the mips architecture, you need to choose whether it is big-endian or little-endian. This information can be viewed using readelf -h file. In my example, I used a big-endian file.
Once the settings are complete, if the previous configurations are correct, the following dialog box will pop up:
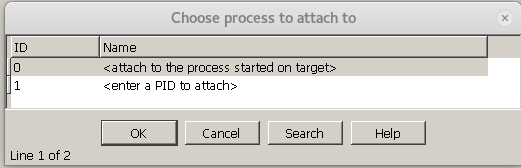
Select to attach to a running thread on the target host port; just select the first one, and the result is as follows:
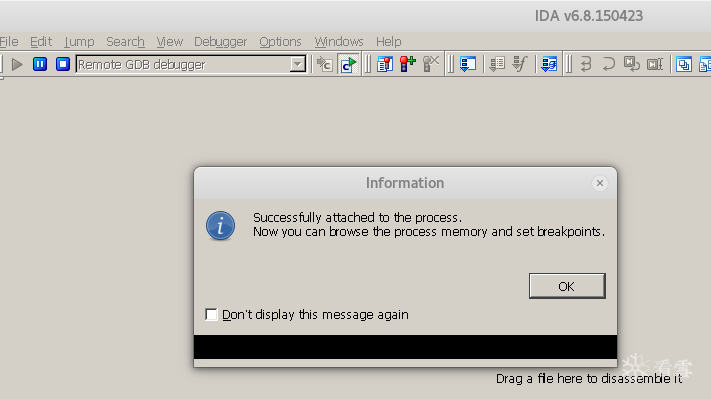
The prompt indicates that you have successfully attached to the process, and now you can browse and debug the execution process of the executable program, as well as the memory situation. As shown in the figure below:
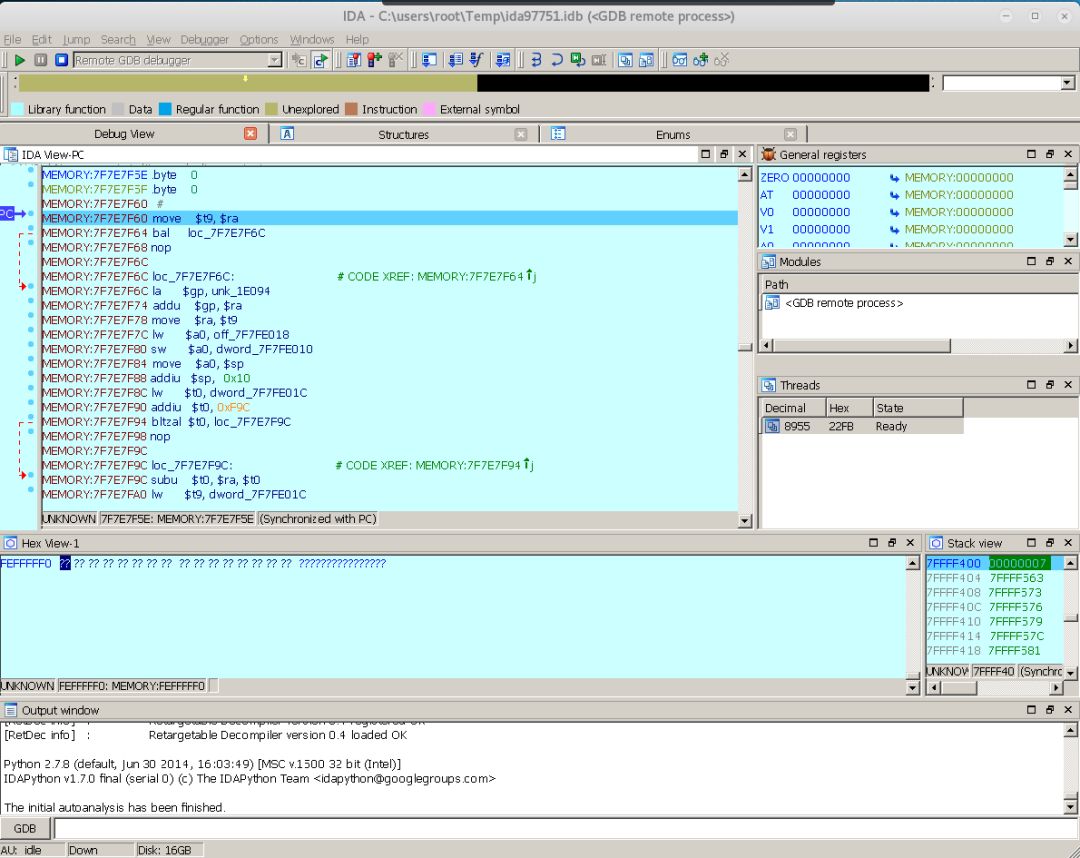
At this point, dynamic debugging is successfully set up, and all binary experts can now show their skills.
Related References
Additionally, regarding the use of the MIPS decompilation tool retdec, it is actually introduced in the retdec GitHub readme. The GitHub address is as follows:
https://github.com/avast-tl/retdec
The compilation process is under the build-and-installation section; you can run the following command when using:
$RETDEC_INSTALL_DIR/bin/retdec-decompiler.sh test.exeOr refer to this post:
https://bbs.pediy.com/thread-227079.htm
I also found a tool that can check for dangerous function calls in source code called flawfinder.
-
Official website: https://www.dwheeler.com/flawfinder/
-
Debian download method: sudo apt-get install flawfinder
Welcome everyone to provide guidance and exchange ideas.

Kanxue ID: Shangzihao
https://bbs.pediy.com/user-671705.htm
This article is original by Shangzihao from the Kanxue forum.
Please indicate the source from the Kanxue community when reprinting.


Recommended Popular Technical Articles:
-
Windows 10 Heap Structure and Unlink Analysis
-
CVE-2015-1805 iovyroot Kernel Address Lookup
-
10 Relocation Types in 32-bit ELF Format
-
Office 0day (CVE-2018-0802 and 2017-11882) Vulnerability Analysis and Exploitation